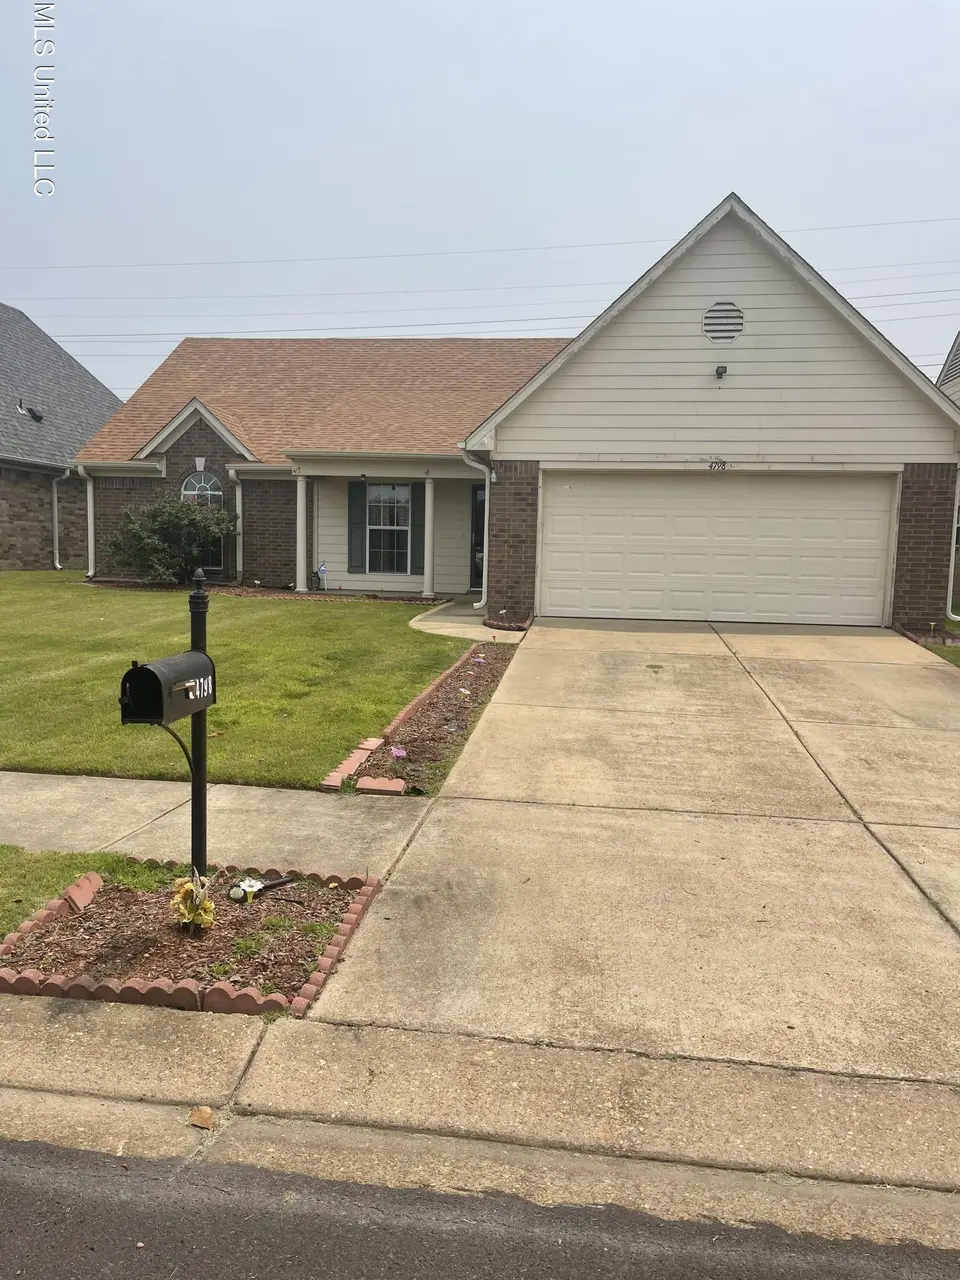
4798 Encore Pkwy · Walls, MS
Flood risk 1/10 · Minimal
- FEMA flood zone
- X
- Chance of flooding over 30 yrs
- 0.0%
- Est. flood insurance / yr
- $507 – $1,088
Fire risk 1/10 · Minimal
- Est. fire insurance / yr
- $1,241 – $2,305
Heat risk 7/10 · Major
- Hot days now (above 110°F)
- 7 days/yr
- Hot days in 30 yrs
- 22 days/yr
Wind risk 5/10 · Moderate
- Chance of severe wind over 30 yrs
- 26.0%
Air-quality risk 2/10 · Minimal
- Unhealthy air days now
- 2 days/yr
- Unhealthy air days in 30 yrs
- 2 days/yr
Risk factors via First Street. Map © Google.
Why this score? — see what drove the B grade
The composite is a weighted blend of 9 inputs, each scored 0–100. Each bar is that input's sub-score; the figure is the points it added to the 100-point composite (weight × sub-score).
- Cash flow +24.9/30.0
- ARV discount +12.0/15.0
- Appreciation +10.0/10.0
- DSCR +8.1/10.0
- 1% rule +5.2/10.0
- Schools +4.0/10.0
- Livability +3.2/5.0
- Rent growth +2.5/5.0
- Condition / age +2.5/5.0
$221,000
🖨 Deal sheet 📄 Offer letter ✓ Due diligence
Listing remarks MLS
Well kept split bedroom plan with covered patio and located across from community lake. Home has nice covered front porch, 3 bedroom, 2 baths, large great room with gas log fireplace and privacy fenced yard.
Key facts
- Community lake
- Walking trail
- Open kitchen concept
Tags
Property features AI
Finance
- HOA & community: Homeowners association with $175 annual fee; Community features: Fishing
Exterior
- Parking: 2-car garage; Concrete parking
- Security: Other security features
- Utilities: Public sewer; Private water; Cable available; Water available
- Home design: Single-family house; One level
- Construction: Brick veneer construction; Architectural shingle roof; Slab foundation; Built by builder
- Exterior features: Patio; Porch; Back yard fencing; Level lot; See remarks
Interior
- Kitchen: Free-standing range
- Bedrooms: Bedroom on main level
- Flooring: Luxury vinyl; Laminate
- Bathrooms: 2 full bathrooms
- Heating & cooling: Central heating (natural gas); Central air conditioning
- Interior features: Open floorplan; Bay windows; Storm door(s); Living room fireplace; Move-in ready
- Laundry & utility: Dedicated laundry room
Neighborhood map
What this means for you Summary
Snapshot
- This is a 3-bed/2.0-bath other listed at $221k.
Deal economics
- At list price, monthly cash flow is $472 ($6k/yr) — positive.
- The deal already cash-flows at list — no discount required.
- Meets the 1% rule at list price ($2k rent vs $221k).
Location & tenants
- Location reads 64/100 on livability (#124 in MS) — a middle-class / working-renter tenant base. Strengths: crime A+, cost of living A+; Watch: amenities F, commute F, employment F.
- Desoto County School District (suburban): math 48% / reading 42% proficiency, ranked #20 of 130 in MS (top 15%) — families likely to look elsewhere, expect single-tenant / working-renter base with shorter leases.
- Zoned schools: Walls Elementary School (math 24% / reading 26%, grade F, #217 of 375 statewide, top 58%, 718 students, 100% FRL); Lake Cormorant Middle (math 51% / reading 30%, grade F, #60 of 179 statewide, top 37%, 764 students, 100% FRL); Lake Cormorant High (math 29% / reading 42%, grade F, #66 of 197 statewide, top 34%, 969 students, 100% FRL) — zoned schools average 100% FRL vs 43% district-wide (56 pts higher); higher-poverty schools than district average — tighter screening recommended.
- Market conditions: 51 active listings in the ZIP; 4 comparable units currently listed for rent nearby; rentals leasing fast (median 4d on market — plan ~1-2 weeks tenant-placement turnaround); 1,155 units permitted in DeSoto County in 2024 (0 in 5+ unit buildings).
- At $2,257/mo this rent would consume 46% of the median local household income ($60k/yr) (locally 229% of renters already pay >50% of income on rent) — very limited rent-growth headroom before tenants either downsize or default.
Forward outlook
- In year one you build about $24k of equity ($2k loan paydown + $22k appreciation (10.0% local appreciation)).
- DeSoto County population projected at +33% by 2050 — long-run rental-demand tailwind backs the buy-and-hold thesis.
- At projected returns (10.0% appreciation + 3.0% rent growth), your $62k cash investment doubles in ~3 years — after that, you're playing with house money.
- By year 2, paydown + projected appreciation supports a ~$38k cash-out refi (75% LTV) — recoverable capital for the next deal without selling this one.
Negotiation context
- Only 8 days on market — expect competitive offers; lowballing is unlikely to land.
- 5 sale attempts since 17y ago with the ask held roughly flat each time — persistent listings suggest the price (not the market) is what's stuck; bring a comps-based counter.
Risks & watch-outs
- Climate carrying-cost: moderate wind risk, 26% chance of damaging wind over 30y; extreme-heat days projected 7→22/yr by 2055 (HVAC capex compounding) — expect insurance premiums to compound above CPI over the hold.
Questions for the listing agent
- What does the HOA fee cover, when was the last increase, and are there any pending special assessments or reserve-fund shortfalls?
- Is there a deadline driving the sale (1031 exchange, divorce, estate, relocation)? That informs how much negotiation room exists.
- Schools are D-rated, which usually means shorter tenancies and higher turnover. Who's the typical renter profile here, and what's been the actual vacancy rate?
- What's the average days-on-market for RENTAL listings here right now (not sales)? A rising rental-DOM trend means longer vacancies and softer asking-rent achievability than the comps imply.
- What's the recent tenant-quality profile in this submarket — average credit score on applications, eviction rate, late-payment / NSF rate, and stable-employment percentage? A property-management company in the area should have these aggregated.
- How much new for-sale + rental construction is in the pipeline within 1–3 miles? Heavy new supply typically softens prices + rents 12–24 months out; constrained supply supports both.
Investment metrics
- 1% rule
- 1.02% ✓
- Cap rate
- 8.86%
- Cash-on-cash
- 9.15%
- DSCR
- 1.41
- GRM
- 8.2
CMA / ARV
- ARV (median comp)
- $245,288
- List price
- $221,000
- Delta
- -9.90%
- Verdict
- FAIR
- Comps
- 20 within 1.0 mi
Projected returns pro-forma
10.0% appreciation · 3.0% rent growth · sell at horizon
- IRR
- 30.9%
- Equity multiple
- 3.43×
- Total profit
- $150,317
- Equity at exit
- $199,094
- IRR
- 26.8%
- Equity multiple
- 7.77×
- Total profit
- $418,828
- Equity at exit
- $429,354
Cash invested: $61,880 (down + closing). Projections, not guarantees.
Landlord ↔ Tenant lean methodology
- Overall (STATE)
- 90 Strongly Landlord-Friendly
- State Mississippi
- 90 Strongly Landlord-Friendly · R+11
- County
- — inherits STATE
- City
- — inherits STATE
ZIP-level market 38680
- Home prices YoY
- 4.6%
- Active inventory
- 51
- Price-to-rent
- 8.2×
Monthly cashflow live
- Estimated rent
- $2,257 medium interval (Pro) →
- Mortgage (P&I)
- −$1,159
- Tax from tax record
- −$45 /mo · $545/yr
- Insurance
- −$92
- HOA
- −$15
- Vacancy / Maint / Mgmt
- −$474
- Net cashflow
- $472
Break-even live
UW: 25.0% down · 7.5% · 30yr · 1.5% tax · 5.0% vac · 8.0% maint · 8.0% mgmt
Financing live
Cash to close
- Down payment
- $55,250
- Closing costs
- $6,630
- Reserves months
- —
- Total cash needed
- —
Loan-product check · same deal, 3 products live
Conventional
25% down · 7.5% · 30yr
- Down + closing
- —
- Monthly P&I
- —
- Monthly cashflow
- —
- DSCR
- —
- Eligible?
- —
Personal DTI + credit; lowest rate.
DSCR
20% down · 8.5% · 30yr
- Down + closing
- —
- Monthly P&I
- —
- Monthly cashflow
- —
- DSCR
- —
- Eligible?
- —
No personal income docs; deal must DSCR.
Hard money
10% down · 12.0% · 12mo
- Down + closing
- —
- Monthly P&I
- —
- Monthly cashflow
- —
- DSCR
- —
- Eligible?
- —
Short-term bridge; refi at stabilization.
Rent comps 4 comps
| Address | Beds | Baths | Sqft | Rent | $/sqft | DOM | Units | Dist |
|---|---|---|---|---|---|---|---|---|
| 4876 Reunion Dr Walls, MS | 4.0 | 2.0 | 2115 | $2,428 | $1.15 | 1d | 1 | 0.70mi |
| 9274 Lakeside Cir S Walls, MS | 4.0 | 2.5 | 1957 | $1,940 | $0.99 | 1d | 1 | 1.41mi |
| 9274 Lakeside Cir S Unit 1 Walls, MS | 4.0 | 2.5 | 1957 | $1,960 | $1.00 | 43d | 1 | 1.41mi |
| 5560 Lakeside Cir W Walls, MS | 4.0 | 2.5 | 1957 | $1,910 | $0.98 | 4d | 1 | 1.43mi |
HOA detail
- Monthly dues
- $15 · $180/yr
- Likely covers
- gas
Listing history 13 events
-
2026-05-13status Pending 492-char remark
-
2026-05-04$221,000 Active 492-char remark
-
2025-10-08historical
-
2025-10-02price $221,000
-
2025-10-02status Active
-
2025-05-31$221,900 Active
-
2025-05-31historical
-
2015-04-16soldstatus
-
2015-04-10soldstatus
Show marketing remark (207 chars)
Well kept split bedroom plan with covered patio and located across from community lake. Home has nice covered front porch, 3 bedroom, 2 baths, large great room with gas log fireplace and privacy fenced yard.
-
2014-06-09$100,000
Show marketing remark (207 chars)
Well kept split bedroom plan with covered patio and located across from community lake. Home has nice covered front porch, 3 bedroom, 2 baths, large great room with gas log fireplace and privacy fenced yard.
-
2010-05-15soldstatus
-
2009-10-08$125,950
-
2009-04-01soldstatus
ⓘ Source: listings_history table (triggers on properties + properties_extension) + one-shot
backfill from property_details.listing_events for pre-trigger history.
Tax reassessment forecast MS · Resets to sale price
- Current annual tax
- $545 · $45/mo
- Projected year-2 tax
- $1,746 · $145/mo
- Expected delta
- +$1,201/yr (+$100/mo · 220.6%)
ⓘ Screening estimate from a state-policy table — verify with the county assessor before closing.
Climate risk First Street
- Flood 1/10 Low FEMA zone X · 0% chance over 30 yrs
- Wildfire 1/10 Low
- Heat 7/10 Severe 7 d/yr ≥110°F today · 22 d/yr by 30 yrs out
- Wind 5/10 Major 26% chance of damaging wind over 30 yrs
- Air quality 2/10 Low 2 unhealthy d/yr today · 2 by 30 yrs out
Nearby sold comps map
Loading sold comps map…
Walkable amenities ~0.75 mi
Loading nearby amenities…
Taxation est. · year 1
- Rental income
- $27,088
- − Mortgage interest
- −$12,379
- − Property taxes
- −$545
- − Insurance
- −$1,105
- − Repairs & maintenance
- −$2,167
- − Management
- −$2,167
- − HOA
- −$180
- − Depreciation
- −$6,429
- Taxable income
- $2,116
- Est. tax owed @ 24.0%
- −$508
- After-tax cash flow
- $5,155/yr
For passive investors: Depreciation is non-cash, so a rental often shows a tax loss while cash-flowing — sheltering income. Rental losses are passive: they offset passive income freely, and up to $25,000/yr can offset ordinary (W-2) income if you actively participate and your MAGI is under $100k (phasing out to $0 by $150k); unused losses carry forward. On sale, claimed depreciation is recaptured at up to 25%, and gains may owe capital-gains tax (a 1031 exchange can defer both). Figures are a year-1 estimate at your 24.0% rate — not tax advice; consult a CPA.
Schools (NCES district)
- District
- Desoto County School District
- NCES district ID
- 2801320
- Math proficiency
- 48% ▼ -13.00%
- Reading proficiency
- 42% ▼ -6.00%
- Median HH income
- $59,272
- Composite
- 39.56/100
- National rank
- #3933
- State rank
- #20 of 130 in MS
Livability — Walls
- Score
- 64/100
- State rank
- #124
- US rank
- #13666
Category grades
Schools grade is shown separately in the Schools card above.
Census & demographics
- Census place
- Walls, MS
- County
- DeSoto County · 176,513 people
- City population
- 9,171
- Metro
- Memphis, TN-MS-AR
- Population (ZIP)
- 6,839
- Household income
- $59,503
- Rent vs Own
- Severe rent burden
- 229.0
Population outlook (DeSoto County) Hauer SSP2
- Today (2025)
- 203,338 people
- By 2030
- 217,692 · +7.1%
- By 2040
- 245,320 · +20.6%
- By 2050
- 270,133 · +32.8%
- By 2075
- 323,341 · +59.0%
- By 2100
- 348,742 · +71.5%
Race, ethnicity, and origin ACS 2023
- Neighborhood character
- Diverse neighborhood (Simpson 0.60)
- Race & ethnicity
- Black 46% White 42% Hispanic / Latino 8% Two or more races 3% Native American 1% Asian 1%
- Hispanic origin (detail)
- Mexican 6%
- Common ancestry
- Romanian 1% Serbian 1% British 1%
- Foreign-born
- 4% · Canada
- Languages at home
- 93% English-only · Spanish 6%
Political lean MEDSL · DeSoto
- 2024 margin
- Strong R (+24.1) · D 36.7% · R 60.8% · Other 2.5%
- 2008→2024 swing
- +14.2pp toward D · 2008: -38.2pp · 2024: -24.1pp
- All cycles
- 2024: R+24.1 2020: R+23.9 2016: R+34.8 2012: R+33.5 2008: R+38.2
Not yet ingested
- Civics
- —
Market trends
- HPI YoY
- ▲ 10.29%
- Current HPI
- 232.28
- Rent YoY
- —
- Metro
- Memphis, TN-MS-AR
- State GDP YoY
- —
- F500 in state
- 0
Price history
+75.5% since first listed13 events — show timeline
- 2026-05-13 Pending — MLSU
- 2026-05-04 Listed $221,000 MLSU
- 2025-10-08 Listing Removed — MLSU
- 2025-10-02 Price Changed $221,000 MLSU
- 2025-10-02 Relisted — MLSU
- 2025-05-31 Listing Removed — MLSU
- 2025-05-31 Listed $221,900 MLSU
- 2015-04-16 Sold (Public Records) — Public Records
- 2015-04-10 Sold (MLS) — MLSU
- 2014-06-09 Listed $100,000 MLSU
- 2010-05-15 Sold (MLS) — MLSU
- 2009-10-08 Listed $125,950 MLSU
- 2009-04-01 Sold (Public Records) — Public Records
Property tax history
-6.5%/yrLatest (2025): $545 · -12.7% YoY. Source: county tax records.
Cash-flow waterfall
monthlySold comps — $/sqft
last 12 mo · ≤1 miLoading sold comps…