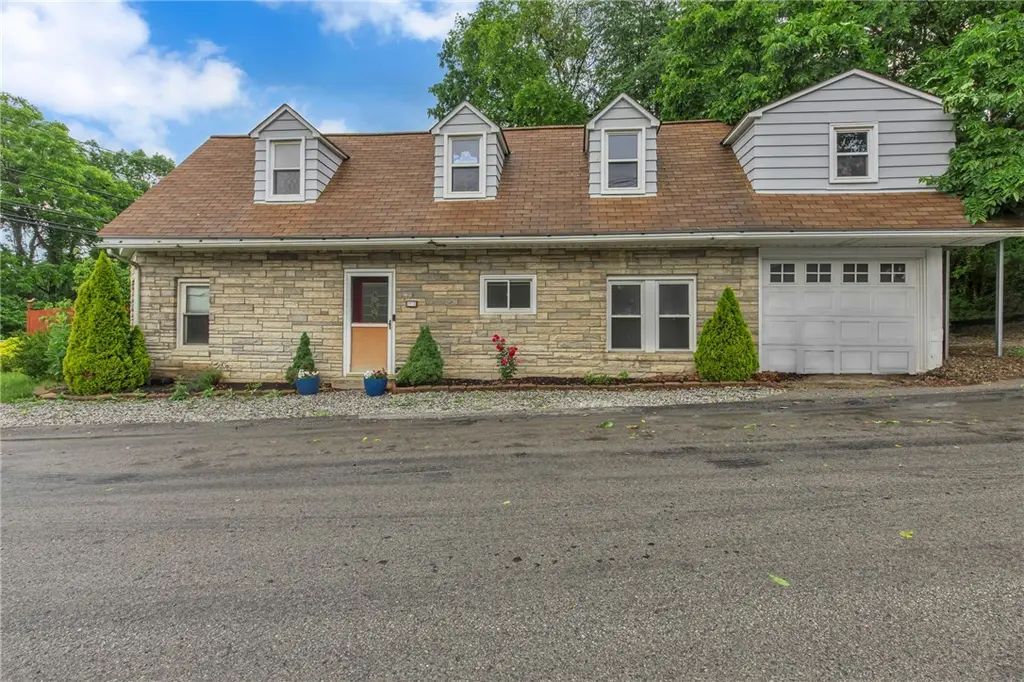
2972 Brodhead Rd · Aliquippa, PA
Flood risk 1/10 · Minimal
- FEMA flood zone
- X (unshaded)
- Chance of flooding over 30 yrs
- 0.0%
- Est. flood insurance / yr
- $507 – $1,088
Fire risk 1/10 · Minimal
- Est. fire insurance / yr
- $511 – $949
Heat risk 3/10 · Minor
- Hot days now (above 97°F)
- 6 days/yr
- Hot days in 30 yrs
- 15 days/yr
Wind risk 2/10 · Minimal
- Chance of severe wind over 30 yrs
- —
Air-quality risk 3/10 · Minor
- Unhealthy air days now
- 2 days/yr
- Unhealthy air days in 30 yrs
- 4 days/yr
Risk factors via First Street. Map © Google.
Why this score? — see what drove the C- grade
The composite is a weighted blend of 9 inputs, each scored 0–100. Each bar is that input's sub-score; the figure is the points it added to the 100-point composite (weight × sub-score).
- ARV discount +15.0/15.0
- Cash flow +13.1/30.0
- Schools +5.0/10.0
- Livability +4.0/5.0
- DSCR +3.9/10.0
- 1% rule +3.5/10.0
- Rent growth +3.0/5.0
- Condition / age +2.5/5.0
- Appreciation +0.0/10.0
$185,000
🖨 Deal sheet (PDF) 📄 Offer letter ✓ Due diligence
Listing remarks MLS
Storybook charm abounds in this 3-4 bedroom updated Stone cape cod situated in Center Twnshp. Beginning with a new 2 car carport +integral garage, professional landscaping & amazing fenced yard just over a 1/4 acre. Gorgeous wood covered patio perfect to sit out & enjoy nature. Step inside & immediately fall in love w/ the open floor plan. Amazing kitchen renovation w/ updated counters & cabinets, hardware, backsplash, island & more! Dining area steps out to the yard perfect for entertaining. The LR is spacious w/ gas fireplace, updated carpet & ample windows adding natural light. 1st floor bedroom off kitchen could also make a great den. The owner's suite boasts a new WIC just completed. Off the owner's suite is another flex space currently being utilized as a den, but would make a great nursery as well. The 3rd bedroom is a perfect kids room w/ a window alcove & cozy nooks. Full updated bath w/ bath fitters tub & surround. Conveniently located to Shopping, dining, & 376. Low Taxes!
Key facts
- 2 car carport
- Attached garage
- Covered wood patio
Tags
Property features AI
Exterior
- Parking: Attached covered garage; Total 3 parking spaces
- Utilities: Public water; Public sewer
- Home design: Resale property
- Construction: Frame construction; Asphalt roof
- Exterior features: Lot with approximate dimensions 58 x 121 x 125 x 55 x 136; 0.28 acre lot
Interior
- Kitchen: Refrigerator; Stove; Some gas appliances
- Flooring: Vinyl
- Bathrooms: 1 full bathroom
- Heating & cooling: Gas heating; Hot water heating
- Interior features: Kitchen island
Neighborhood map
What this means for you Summary
Snapshot
- This is a 3-bed/1.0-bath single-family listed at $185k.
Deal economics
- At list price, monthly cash flow is $-6 ($-74/yr) — negative.
- To cash-flow at today's rent, offer at most $184k (0.6% below list).
- To meet the 1% rule (rent ≥ 1% of price), the offer needs to be $157k (15.0% below list).
- Recommended offer: $157k (15.0% below list) — sets the bar for 1% rule.
- Cap rate 6.3% vs local median 4.3% in Aliquippa — top-decile yield for the area; either an underpriced asset or a hidden risk that comps aren't pricing in. Stress-test before assuming the spread holds.
Location & tenants
- Location reads 80/100 on livability (#216 in PA, #1,891 nationally) — a professional / high-income tenant draw. Strengths: commute A+, cost of living A+, housing A+; Watch: amenities F, employment F.
- Zoned schools: Todd Lane El Sch (math 44% / reading 61%, grade C-, #578 of 1,518 statewide, top 38%, 493 students, 28% FRL); Central Valley Ms (math 26% / reading 58%, grade D-, #221 of 512 statewide, top 45%, 543 students, 23% FRL); Central Valley Hs (math 87%, 709 students, 22% FRL).
- Market conditions: Rents rising (+2.0%/yr); 127 active listings in the ZIP; 1 comparable units currently listed for rent nearby; 272 units permitted in Beaver County in 2024 (80 in 5+ unit buildings).
Forward outlook
- Local home prices are declining (-3.0%/yr); year-one equity from $1k of loan paydown is wiped out by about $6k of value loss. Plan a longer hold.
- Beaver County population projected at -14% by 2050 — secular population decline; favor cash flow + early exit over multi-decade hold.
Negotiation context
- Only 9 days on market — expect competitive offers; lowballing is unlikely to land.
- 5 sale attempts since 25y ago with the ask held roughly flat each time — persistent listings suggest the price (not the market) is what's stuck; bring a comps-based counter.
- Current owner paid $150k; 23% above their basis — modest negotiation headroom, anchor on the comps not their cost.
Risks & watch-outs
- Watch-outs: built in 1931 — expect roof / HVAC / electrical / plumbing capex.
Questions for the listing agent
- What do current leases actually rent for vs. the listed asking? Can we see a recent rent roll and the last 12 months of T-12 income?
- Built in 1931 — when were the roof, HVAC, electrical panel, plumbing, and water heater last replaced?
- Is there a deadline driving the sale (1031 exchange, divorce, estate, relocation)? That informs how much negotiation room exists.
- What's the average days-on-market for RENTAL listings here right now (not sales)? A rising rental-DOM trend means longer vacancies and softer asking-rent achievability than the comps imply.
- What's the recent tenant-quality profile in this submarket — average credit score on applications, eviction rate, late-payment / NSF rate, and stable-employment percentage? A property-management company in the area should have these aggregated.
- How much new for-sale + rental construction is in the pipeline within 1–3 miles? Heavy new supply typically softens prices + rents 12–24 months out; constrained supply supports both.
Investment metrics
- 1% rule
- 0.85% ✗
- Cap rate
- 6.25%
- Cash-on-cash
- -0.14%
- DSCR
- 0.99
- GRM
- 9.8
CMA / ARV
- ARV (on-the-fly)
- $274,209
- Comps found
- 7
Show comp detail 7 sales within ~0.75 mi
| Address | Dist | Beds/Ba | Sqft | Sold | Price | $/sf | Match |
|---|---|---|---|---|---|---|---|
| 223 Columbia Dr | 0.59mi | 3/2.0 | 1,156 (-0%) | 3mo | $274,120 | $237 | 66 |
| 221 Bainbridge Dr | 0.68mi | 3/2.0 | 1,132 (-2%) | 3mo | $284,900 | $252 | 58 |
| 234 Columbia Dr | 0.63mi | 3/2.0 | 1,180 (+2%) | 9mo | $306,000 | $259 | 56 |
| 436 Chapel Rd | 0.66mi | 3/2.0 | 1,124 (-3%) | 12mo | $174,900 | $156 | 50 |
| 710 Ivy Ln | 0.59mi | 3/2.5 | 1,228 (+6%) | 9mo | $330,000 | $269 | 49 |
| 215 Columbia Dr | 0.60mi | 4/2.5 (+1) | 1,212 (+5%) | 10mo | $243,000 | $200 | 45 |
| 185 Ridgeview Dr | 0.67mi | 3/1.5 | 1,312 (+13%) | 12mo | $221,000 | $168 | 34 |
Match score weights: distance 35% · size 25% · config 20% · recency 20%. Top-matched comps best support the ARV.
Projected returns pro-forma
-3.0% appreciation · 2.05% rent growth · sell at horizon
- IRR
- -17.6%
- Equity multiple
- 0.39×
- Total profit
- $-31,854
- Equity at exit
- $27,584
- IRR
- -11.5%
- Equity multiple
- 0.34×
- Total profit
- $-34,214
- Equity at exit
- $15,995
Cash invested: $51,800 (down + closing). Projections, not guarantees.
Landlord ↔ Tenant lean methodology
- Overall (STATE)
- 62 Landlord-Friendly
- State Pennsylvania
- 62 Landlord-Friendly · EVEN
- County
- — inherits STATE
- City
- — inherits STATE
ZIP-level market 15001
- Home prices YoY
- -20.8%
- Rents YoY
- 2.0%
- Active inventory
- 127
- Price-to-rent
- 9.8×
Monthly cashflow live
- Estimated rent
- $1,572 medium interval (Pro) →
- Mortgage (P&I)
- −$970
- Tax from tax record
- −$200 /mo · $2,406/yr
- Insurance
- −$77
- HOA
- −$0
- Vacancy / Maint / Mgmt
- −$330
- Net cashflow
- $-6
Break-even live
Sensitivity live
| Price | -10% $99 | -5% $46 | +0% $-6 | +5% $-59 | +10% $-111 |
|---|---|---|---|---|---|
| Rent | -10% $-130 | -5% $-68 | +0% $-6 | +5% $56 | +10% $118 |
| Rate | -1.0pp $87 | -0.5pp $41 | base $-6 | +0.5pp $-54 | +1.0pp $-103 |
UW: 25.0% down · 7.5% · 30yr · 1.5% tax · 5.0% vac · 8.0% maint · 8.0% mgmt
Financing live
Cash to close
- Down payment
- $46,250
- Closing costs
- $5,550
- Reserves months
- —
- Total cash needed
- —
Loan-product check · same deal, 3 products live
Conventional
25% down · 7.5% · 30yr
- Down + closing
- —
- Monthly P&I
- —
- Monthly cashflow
- —
- DSCR
- —
- Eligible?
- —
Personal DTI + credit; lowest rate.
DSCR
20% down · 8.5% · 30yr
- Down + closing
- —
- Monthly P&I
- —
- Monthly cashflow
- —
- DSCR
- —
- Eligible?
- —
No personal income docs; deal must DSCR.
Hard money
10% down · 12.0% · 12mo
- Down + closing
- —
- Monthly P&I
- —
- Monthly cashflow
- —
- DSCR
- —
- Eligible?
- —
Short-term bridge; refi at stabilization.
Rent comps 1 comps
| Address | Beds | Baths | Sqft | Rent | $/sqft | DOM | Units | Dist |
|---|---|---|---|---|---|---|---|---|
| 124 Bennett Blvd Aliquippa, PA | 3.0 | 2.0 | 1350 | $1,500 | $1.11 | 12d | 1 | 1.49mi |
Listing history 7 events
-
2026-06-21days on market $185,000 Active 9 DOM
-
2026-06-18days on market $185,000 Active 6 DOM
-
2026-06-17days on market $185,000 Active 5 DOM
-
2026-06-16days on market $185,000 Active 4 DOM
-
2026-06-15days on market $185,000 Active 3 DOM
-
2026-06-13remarks 699-char remark
-
2026-06-13$185,000 Active 1 DOM
ⓘ Source: listings_history table (triggers on properties + properties_extension) + one-shot
backfill from property_details.listing_events for pre-trigger history.
Tax reassessment forecast PA · Partial reset (capped growth)
- Current annual tax
- $2,406 · $200/mo
- Projected year-2 tax
- $2,664 · $222/mo
- Expected delta
- +$259/yr (+$22/mo · 10.8%)
ⓘ Screening estimate from a state-policy table — verify with the county assessor before closing.
Climate risk First Street
- Flood 1/10 Low FEMA zone X (unshaded) · 0% chance over 30 yrs
- Wildfire 1/10 Low
- Heat 3/10 Moderate 6 d/yr ≥97°F today · 15 d/yr by 30 yrs out
- Wind 2/10 Low
- Air quality 3/10 Moderate 2 unhealthy d/yr today · 4 by 30 yrs out
Nearby sold comps map
Loading sold comps map…
Walkable amenities ~0.75 mi
Loading nearby amenities…
Taxation est. · year 1
- Rental income
- $18,859
- − Mortgage interest
- −$10,363
- − Property taxes
- −$2,406
- − Insurance
- −$925
- − Repairs & maintenance
- −$1,509
- − Management
- −$1,509
- − Depreciation
- −$5,382
- Taxable loss
- −$3,234
- Est. tax savings @ 24.0%
- +$776
- After-tax cash flow
- $702/yr
For passive investors: Depreciation is non-cash, so a rental often shows a tax loss while cash-flowing — sheltering income. Rental losses are passive: they offset passive income freely, and up to $25,000/yr can offset ordinary (W-2) income if you actively participate and your MAGI is under $100k (phasing out to $0 by $150k); unused losses carry forward. On sale, claimed depreciation is recaptured at up to 25%, and gains may owe capital-gains tax (a 1031 exchange can defer both). Figures are a year-1 estimate at your 24.0% rate — not tax advice; consult a CPA.
Schools (NCES district)
No district data.
Livability — Aliquippa
- Score
- 80/100
- State rank
- #216
- US rank
- #1891
Category grades
Schools grade is shown separately in the Schools card above.
Census & demographics
- County
- Beaver County · 116,001 people
- City population
- 31,976
- Metro
- Pittsburgh, PA
- Population (ZIP)
- 31,976
- Household income
- $70,985
- Rent vs Own
- Severe rent burden
- 720.0
Population outlook (Beaver County) Hauer SSP2
- Today (2025)
- 164,976 people
- By 2030
- 161,449 · -2.1%
- By 2040
- 151,752 · -8.0%
- By 2050
- 141,155 · -14.4%
- By 2075
- 118,142 · -28.4%
- By 2100
- 91,740 · -44.4%
Race, ethnicity, and origin ACS 2023
- Neighborhood character
- Predominantly White (80%)
- Race & ethnicity
- White 80% Black 13% Two or more races 5% Hispanic / Latino 2%
- Common ancestry
- Romanian 6% Serbian 2% Subsaharan African 2%
- Foreign-born
- 3% · Canada
- Languages at home
- 96% English-only · Other Indo-European 2% Spanish 1% German/W. Germanic 1%
Political lean MEDSL · Beaver
- 2024 margin
- Strong R (+20.7) · D 39.2% · R 59.9%
- 2008→2024 swing
- -17.9pp toward R · 2008: -2.8pp · 2024: -20.7pp
- All cycles
- 2024: R+20.7 2020: R+17.7 2016: R+20.1 2012: R+6.6 2008: R+2.8
Not yet ingested
- Civics
- —
Market trends
- HPI YoY
- ▼ -65.21%
- Current HPI
- 247.7251
- Rent YoY
- ▲ 2.05%
- Metro
- Pittsburgh, PA
- State GDP YoY
- ▲ 1.68%
- F500 in state
- 34
Industry mix (Fortune 500 HQ in PA)
| Industry | F500 HQs | Revenue |
|---|---|---|
| Healthcare | 2 | $309B |
|
||
| Insurance | 2 | $27B |
|
||
| Telecommunications / Media | 1 | $124B |
|
||
| Industrial Distribution | 1 | $22B |
|
||
| Financial Services | 1 | $20B |
|
||
| Chemicals / Materials | 1 | $18B |
|
||
Price history
+415.3% since first listed23 events — show timeline
- 2026-06-12 Listed $185,000 West Penn MLS
- 2022-01-10 Sold (Public Records) $150,000 Public Records
- 2022-01-06 Sold (MLS) $150,000 West Penn MLS
- 2022-01-05 Pending — West Penn MLS
- 2021-11-20 Contingent — West Penn MLS
- 2021-11-17 Listed $150,000 West Penn MLS
- 2020-10-01 Sold (Public Records) $80,937 Public Records
- 2018-06-07 Sold (MLS) $98,000 West Penn MLS
- 2018-05-14 Contingent — West Penn MLS
- 2018-04-26 Price Changed $98,000 West Penn MLS
- 2018-03-07 Listed $99,500 West Penn MLS
- 2018-02-10 Delisted — West Penn MLS
- 2018-01-19 Price Changed $99,500 West Penn MLS
- 2017-12-05 Price Changed $99,900 West Penn MLS
- 2017-11-17 Price Changed $103,000 West Penn MLS
- 2017-10-03 Price Changed $105,000 West Penn MLS
- 2017-08-15 Listed $107,000 West Penn MLS
- 2002-05-21 Sold (Public Records) $63,000 Public Records
- 2002-05-21 Sold (MLS) $63,000 West Penn MLS
- 2001-10-27 Listed $63,000 West Penn MLS
- 2000-11-10 Sold (Public Records) $53,000 Public Records
- 1990-10-05 Sold (Public Records) $37,500 Public Records
- 1987-12-09 Sold (Public Records) $35,900 Public Records
Property tax history
+5.4%/yrLatest (2026): $2,406 · +3.2% YoY. Source: county tax records.
Cash-flow waterfall
monthlySold comps — $/sqft
last 12 mo · ≤1 miLoading sold comps…