26734 Peach #112 · Meadowbrook, CA
Flood risk 1/10 · Minimal
- FEMA flood zone
- X (unshaded)
- Chance of flooding over 30 yrs
- 0.0%
- Est. flood insurance / yr
- $507 – $1,088
Fire risk 9/10 · Severe
- Est. fire insurance / yr
- $659 – $1,223
Heat risk 6/10 · Moderate
- Hot days now (above 104°F)
- 5 days/yr
- Hot days in 30 yrs
- 12 days/yr
Wind risk 1/10 · Minimal
- Chance of severe wind over 30 yrs
- —
Air-quality risk 6/10 · Moderate
- Unhealthy air days now
- 9 days/yr
- Unhealthy air days in 30 yrs
- 11 days/yr
Risk factors via First Street. Map © Google.
Why this score? — see what drove the B- grade
The composite is a weighted blend of 9 inputs, each scored 0–100. Each bar is that input's sub-score; the figure is the points it added to the 100-point composite (weight × sub-score).
- Cash flow +30.0/30.0
- 1% rule +10.0/10.0
- DSCR +10.0/10.0
- ARV discount +7.5/15.0
- Schools +3.0/10.0
- Rent growth +2.5/5.0
- Condition / age +2.5/5.0
- Livability +2.3/5.0
- Appreciation +0.0/10.0
$50,777
🖨 Deal sheet 📄 Offer letter ✓ Due diligence
Listing remarks
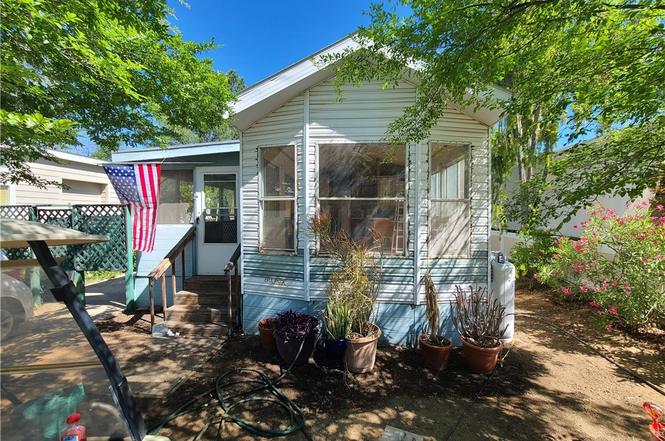
Welcome to Meadowbrook RV Park, Home of One of Lowest Space Rents in the County! This 55+ Membership Community Offers a Fishing Pond, Community Center, Laundry Room, Shower Room, and Many Senior Activities. This home is Ready for a New Owner to Make it their Own, this Home sits on the Perfect Lot that backs up to a Beautiful Green Belt with Plenty of Trees Great for Walks and Shade. Unique Features Include a Patio, a Shed, Plenty of Trees, and Private Setting. Don't miss out on this Great Opportunity!
Key facts
- Shed
- Community center
- Fishing pond
Tags
Property features AI
Finance
- Other: Lot size estimated; lot characterized as 0–1 unit/acre; Living area reported as estimated
- HOA & community: Senior community; Street lighting in community; Land lease of approximately $262 per month (park-managed); water included in rent
Exterior
- Parking: Located in MeadowBrook park
- Utilities: Standard electric service; Community septic system; Public/District water (water connected)
- Home design: Single-story home; Mobile home remains on the property; Mobile dimensions approximately 42' x 10'
- Construction: Year built reported by builder
- Exterior features: No pool
Interior
- Kitchen: Gas cooktop
- Bedrooms: All bedrooms located down/on main level
- Bathrooms: 1 full bathroom
- Interior features: All bedrooms on main level; Entry at street level
- Laundry & utility: On-site laundry (see remarks)
Neighborhood map
What this means for you Summary
Snapshot
- This is a 1-bed/1.0-bath manufactured listed at $51k.
Deal economics
- At list price, monthly cash flow is $1k ($14k/yr) — positive.
- The deal already cash-flows at list — no discount required.
- Meets the 1% rule at list price ($2k rent vs $51k).
- Recommended offer: $45k (12.0% below list) — sets the bar for market timing.
Location & tenants
- Location reads 46/100 on livability (#1,278 in CA) — a working-class tenant base; expect higher turnover. Strengths: housing A+; Watch: employment C-, crime D, schools F.
- Perris Union High (suburban): math 21% / reading 48% proficiency, ranked #282 of 517 in CA (top 54%) — families likely to look elsewhere, expect single-tenant / working-renter base with shorter leases; 72% free/reduced lunch — lower-income household profile, screen leases tightly.
- Market conditions: 205 active listings in the ZIP; solid renter incomes; 9,195 units permitted in Riverside County in 2024 (1,512 in 5+ unit buildings).
Forward outlook
- Local home prices are declining (-3.0%/yr); year-one equity from $351 of loan paydown is wiped out by about $2k of value loss. Plan a longer hold.
- Riverside County population projected at +22% by 2050 — long-run rental-demand tailwind backs the buy-and-hold thesis.
- At projected returns (-3.0% appreciation + 3.0% rent growth), your $14k cash investment doubles in ~2 years — after that, you're playing with house money.
Negotiation context
- It's been on market 128 days — a 12% lower offer ($45k) is reasonable based on typical stale-listing flexibility.
- 2 sale attempts; this cycle's ask has dropped $19k (27%) from the opening price — seller is motivated, your offer sets the floor, not the list.
Risks & watch-outs
- Climate carrying-cost: severe wildfire risk; extreme-heat days projected 5→12/yr by 2055 (HVAC capex compounding) — expect insurance premiums to compound above CPI over the hold.
Questions for the listing agent
- It's been on market 128 days. Have you received any prior offers? Is the seller open to a 12% concession, seller financing, or rate buy-down credit?
- Why hasn't it sold? Are there any deal-killer items the seller is aware of (foundation, flood, title, zoning, code violations)?
- Is there a deadline driving the sale (1031 exchange, divorce, estate, relocation)? That informs how much negotiation room exists.
- Schools are F-rated, which usually means shorter tenancies and higher turnover. Who's the typical renter profile here, and what's been the actual vacancy rate?
- Crime grade is D in this area — have there been break-ins, vandalism, or insurance claims at this property in the last 3 years? What carrier currently insures it and at what premium?
- What's the average days-on-market for RENTAL listings here right now (not sales)? A rising rental-DOM trend means longer vacancies and softer asking-rent achievability than the comps imply.
- What's the recent tenant-quality profile in this submarket — average credit score on applications, eviction rate, late-payment / NSF rate, and stable-employment percentage? A property-management company in the area should have these aggregated.
- How much new for-sale + rental construction is in the pipeline within 1–3 miles? Heavy new supply typically softens prices + rents 12–24 months out; constrained supply supports both.
Investment metrics
- 1% rule
- 3.77% ✓
- Cap rate
- 33.72%
- Cash-on-cash
- 97.95%
- DSCR
- 5.36
- GRM
- 2.2
CMA / ARV
No comps found within radius.
Projected returns pro-forma
-3.0% appreciation · 3.0% rent growth · sell at horizon
- IRR
- 99.0%
- Equity multiple
- 5.62×
- Total profit
- $65,715
- Equity at exit
- $7,571
- IRR
- —
- Equity multiple
- 11.73×
- Total profit
- $152,517
- Equity at exit
- $4,390
Cash invested: $14,218 (down + closing). Projections, not guarantees.
Landlord ↔ Tenant lean methodology
- Overall (STATE)
- 18 Strongly Tenant-Friendly
- State California
- 18 Strongly Tenant-Friendly · D+13
- County
- — inherits STATE
- City
- — inherits STATE
ZIP-level market 92570
- Home prices YoY
- -11.8%
- Active inventory
- 205
- Price-to-rent
- 2.2×
Monthly cashflow live
- Estimated rent
- $1,913 medium interval (Pro) →
- Mortgage (P&I)
- −$266
- Tax est. 1.5%
- −$63 /mo · $762/yr
- Insurance
- −$21
- HOA
- −$0
- Vacancy / Maint / Mgmt
- −$402
- Net cashflow
- $1,161
Break-even live
UW: 25.0% down · 7.5% · 30yr · 1.5% tax · 5.0% vac · 8.0% maint · 8.0% mgmt
Financing live
Cash to close
- Down payment
- $12,694
- Closing costs
- $1,523
- Reserves months
- —
- Total cash needed
- —
Loan-product check · same deal, 3 products live
Conventional
25% down · 7.5% · 30yr
- Down + closing
- —
- Monthly P&I
- —
- Monthly cashflow
- —
- DSCR
- —
- Eligible?
- —
Personal DTI + credit; lowest rate.
DSCR
20% down · 8.5% · 30yr
- Down + closing
- —
- Monthly P&I
- —
- Monthly cashflow
- —
- DSCR
- —
- Eligible?
- —
No personal income docs; deal must DSCR.
Hard money
10% down · 12.0% · 12mo
- Down + closing
- —
- Monthly P&I
- —
- Monthly cashflow
- —
- DSCR
- —
- Eligible?
- —
Short-term bridge; refi at stabilization.
Listing history 19 events
-
2026-06-18days on market $50,777 Active 128 DOM
-
2026-06-18price $50,777 Active 127 DOM
-
2026-06-17days on market $70,000 Active 127 DOM
-
2026-06-16days on market $70,000 Active 126 DOM
-
2026-06-15days on market $70,000 Active 125 DOM
-
2026-06-13days on market $70,000 Active 123 DOM
-
2026-06-13days on market $70,000 Active 122 DOM
-
2026-06-09days on market $70,000 Active 119 DOM
-
2026-06-08days on market $70,000 Active 118 DOM
-
2026-06-07days on market $70,000 Active 117 DOM
-
2026-06-04days on market $70,000 Active 114 DOM
-
2026-06-03days on market $70,000 Active 113 DOM
-
2026-06-02days on market $70,000 Active 112 DOM
-
2026-06-01days on market $70,000 Active 111 DOM
-
2026-05-31days on market $70,000 Active 110 DOM
-
2026-02-10$70,000 Active
-
2025-12-31historical
-
2025-11-19price $70,000
-
2025-05-21$99,777 Active
ⓘ Source: listings_history table (triggers on properties + properties_extension) + one-shot
backfill from property_details.listing_events for pre-trigger history.
Climate risk First Street
- Flood 1/10 Low FEMA zone X (unshaded) · 0% chance over 30 yrs
- Wildfire 9/10 Extreme
- Heat 6/10 Major 5 d/yr ≥104°F today · 12 d/yr by 30 yrs out
- Wind 1/10 Low
- Air quality 6/10 Major 9 unhealthy d/yr today · 11 by 30 yrs out
Nearby sold comps map
Loading sold comps map…
Walkable amenities ~0.75 mi
Loading nearby amenities…
Taxation est. · year 1
- Rental income
- $22,958
- − Mortgage interest
- −$2,844
- − Property taxes
- −$762
- − Insurance
- −$254
- − Repairs & maintenance
- −$1,837
- − Management
- −$1,837
- − Depreciation
- −$1,477
- Taxable income
- $13,948
- Est. tax owed @ 24.0%
- −$3,348
- After-tax cash flow
- $10,579/yr
For passive investors: Depreciation is non-cash, so a rental often shows a tax loss while cash-flowing — sheltering income. Rental losses are passive: they offset passive income freely, and up to $25,000/yr can offset ordinary (W-2) income if you actively participate and your MAGI is under $100k (phasing out to $0 by $150k); unused losses carry forward. On sale, claimed depreciation is recaptured at up to 25%, and gains may owe capital-gains tax (a 1031 exchange can defer both). Figures are a year-1 estimate at your 24.0% rate — not tax advice; consult a CPA.
Schools (NCES district)
- District
- Perris Union High
- NCES district ID
- 0630210
- Math proficiency
- 21% ▲ 2.00%
- Reading proficiency
- 48% ▲ 5.00%
- Median HH income
- $49,210
- Composite
- 29.75/100
- National rank
- #6439
- State rank
- #282 of 517 in CA
Livability — Meadowbrook
- Score
- 46/100
- State rank
- #1278
- US rank
- #26467
Category grades
Schools grade is shown separately in the Schools card above.
Census & demographics
- Census place
- Meadowbrook, CA
- County
- Riverside County · 2,287,001 people
- City population
- 118,178
- Metro
- Riverside-San Bernardino-Ontario, CA
- Population (ZIP)
- 58,082
- Household income
- $79,393
- Rent vs Own
- Severe rent burden
- 1140.0
Population outlook (Riverside County) Hauer SSP2
- Today (2025)
- 2,664,475 people
- By 2030
- 2,802,692 · +5.2%
- By 2040
- 3,050,904 · +14.5%
- By 2050
- 3,256,783 · +22.2%
- By 2075
- 3,655,058 · +37.2%
- By 2100
- 3,766,594 · +41.4%
Race, ethnicity, and origin ACS 2023
- Neighborhood character
- Predominantly Hispanic (77%)
- Race & ethnicity
- Hispanic / Latino 77% Two or more races 15% White 14% Black 4% Asian 2% Native American 1%
- Hispanic origin (detail)
- Mexican 68%
- Common ancestry
- Lithuanian 1% Italian 0%
- Foreign-born
- 32% · Canada
- Languages at home
- 33% English-only · Spanish 65% Tagalog/Filipino 1% Other Indo-European 1%
Political lean MEDSL · Riverside
- 2024 margin
- Toss-up / Even · D 48.0% · R 49.3% · Other 2.6%
- 2008→2024 swing
- -3.6pp toward R · 2008: 2.3pp · 2024: -1.3pp
- All cycles
- 2024: R+1.3 2020: D+8.0 2016: D+4.3 2012: R+0.4 2008: D+2.3
Not yet ingested
- Civics
- —
Market trends
- HPI YoY
- ▼ -61.72%
- Current HPI
- 460.1716
- Rent YoY
- —
- Metro
- Riverside-San Bernardino-Ontario, CA
- State GDP YoY
- ▲ 3.21%
- F500 in state
- 116
Industry mix (Fortune 500 HQ in CA)
| Industry | F500 HQs | Revenue |
|---|---|---|
| Technology | 27 | $1,492B |
|
||
| Financial Services | 3 | $174B |
|
||
| Retail | 3 | $44B |
|
||
| Insurance | 3 | $26B |
|
||
| Media / Entertainment | 2 | $115B |
|
||
| Pharmaceuticals / Biotech | 2 | $62B |
|
||
Price history
-29.8% since first listed4 events — show timeline
- 2026-02-10 Listed $70,000 CRMLS
- 2025-12-31 Listing Removed — CRMLS
- 2025-11-19 Price Changed $70,000 CRMLS
- 2025-05-21 Listed $99,777 CRMLS
Cash-flow waterfall
monthlySold comps — $/sqft
last 12 mo · ≤1 miLoading sold comps…