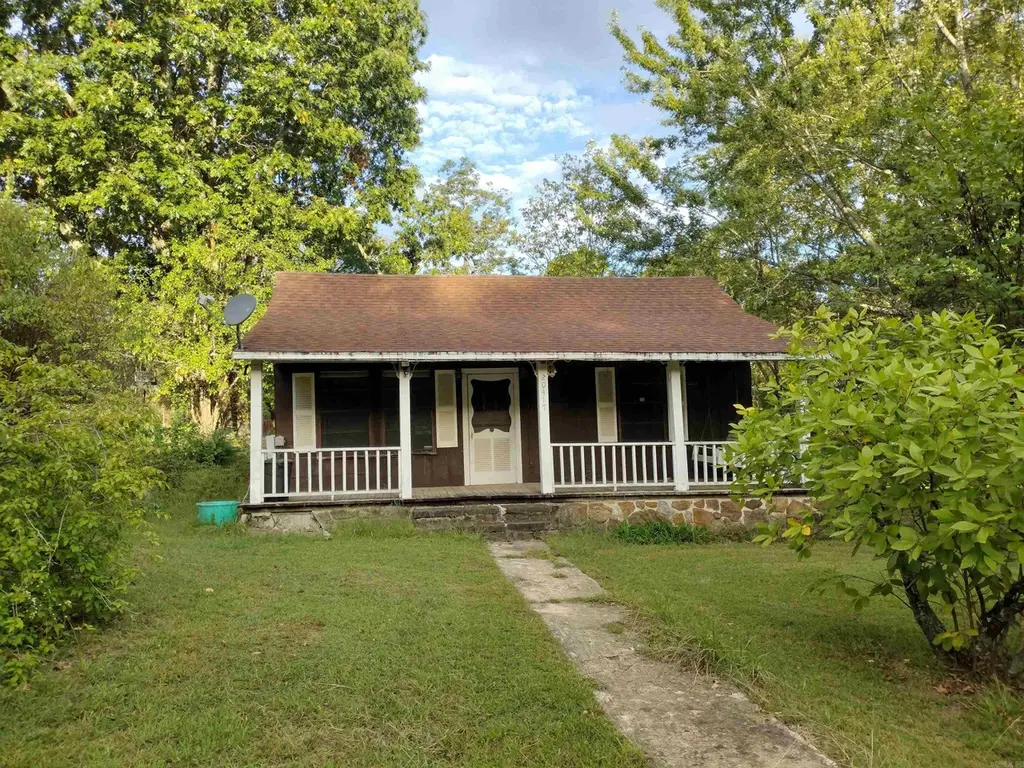
20417 Hwy 263 · Fox, AR
Flood risk 1/10 · Minimal
- FEMA flood zone
- —
- Chance of flooding over 30 yrs
- 0.0%
- Est. flood insurance / yr
- —
Fire risk 4/10 · Minor
- Est. fire insurance / yr
- $1,499 – $2,785
Heat risk 3/10 · Minor
- Hot days now (above 104°F)
- 4 days/yr
- Hot days in 30 yrs
- 10 days/yr
Wind risk 2/10 · Minimal
- Chance of severe wind over 30 yrs
- 4.0%
Air-quality risk 2/10 · Minimal
- Unhealthy air days now
- 0 days/yr
- Unhealthy air days in 30 yrs
- 1 days/yr
Risk factors via First Street. Map © Google.
Why this score? — see what drove the B grade
The composite is a weighted blend of 9 inputs, each scored 0–100. Each bar is that input's sub-score; the figure is the points it added to the 100-point composite (weight × sub-score).
- Cash flow +30.0/30.0
- 1% rule +10.0/10.0
- DSCR +10.0/10.0
- ARV discount +7.5/15.0
- Appreciation +5.0/10.0
- Schools +3.1/10.0
- Rent growth +2.5/5.0
- Livability +2.5/5.0
- Condition / age +2.5/5.0
$54,900
🖨 Deal sheet 📄 Offer letter ✓ Due diligence
Listing remarks MLS
Great investment, fixer upper hwy frontage would make great rental
Key facts
- 1.2 acre lot
- 3 parking spots
- Listed 254 days
Neighborhood map
What this means for you Summary
Snapshot
- This is a 2-bed/1.0-bath single-family listed at $55k.
Deal economics
- At list price, monthly cash flow is $345 ($4k/yr) — positive.
- The deal already cash-flows at list — no discount required.
- Meets the 1% rule at list price ($863 rent vs $55k).
- Recommended offer: $48k (12.0% below list) — sets the bar for market timing.
Location & tenants
- Location reads: area grade B — affects rentability + tenant quality, not the cash-flow math above.
- Mountain View School District (rural): math 34% / reading 41% proficiency, ranked #107 of 238 in AR (top 45%) — families likely to look elsewhere, expect single-tenant / working-renter base with shorter leases.
- Market conditions: 11 active listings in the ZIP; 2 units permitted in Stone County in 2024 (0 in 5+ unit buildings).
Forward outlook
- In year one you build about $2k of equity ($380 loan paydown + $2k appreciation (3.0% local appreciation)).
- Stone County population projected to shrink 6% by 2050 — rents likely to lag national; underwrite the cash flow, not the appreciation.
- At projected returns (3.0% appreciation + 3.0% rent growth), your $15k cash investment doubles in ~3 years — after that, you're playing with house money.
Negotiation context
- It's been on market 255 days — a 12% lower offer ($48k) is reasonable based on typical stale-listing flexibility.
- 3 sale attempts with the ask held roughly flat each time — persistent listings suggest the price (not the market) is what's stuck; bring a comps-based counter.
Questions for the listing agent
- It's been on market 255 days. Have you received any prior offers? Is the seller open to a 12% concession, seller financing, or rate buy-down credit?
- Why hasn't it sold? Are there any deal-killer items the seller is aware of (foundation, flood, title, zoning, code violations)?
- Is there a deadline driving the sale (1031 exchange, divorce, estate, relocation)? That informs how much negotiation room exists.
- What's the average days-on-market for RENTAL listings here right now (not sales)? A rising rental-DOM trend means longer vacancies and softer asking-rent achievability than the comps imply.
- What's the recent tenant-quality profile in this submarket — average credit score on applications, eviction rate, late-payment / NSF rate, and stable-employment percentage? A property-management company in the area should have these aggregated.
- How much new for-sale + rental construction is in the pipeline within 1–3 miles? Heavy new supply typically softens prices + rents 12–24 months out; constrained supply supports both.
Investment metrics
- 1% rule
- 1.57% ✓
- Cap rate
- 13.84%
- Cash-on-cash
- 26.96%
- DSCR
- 2.20
- GRM
- 5.3
CMA / ARV
No comps found within radius.
Projected returns pro-forma
3.0% appreciation · 3.0% rent growth · sell at horizon
- IRR
- 32.9%
- Equity multiple
- 2.86×
- Total profit
- $28,592
- Equity at exit
- $24,685
- IRR
- 33.2%
- Equity multiple
- 5.62×
- Total profit
- $70,954
- Equity at exit
- $38,043
Cash invested: $15,372 (down + closing). Projections, not guarantees.
Landlord ↔ Tenant lean methodology
- Overall (STATE)
- 92 Strongly Landlord-Friendly
- State Arkansas
- 92 Strongly Landlord-Friendly · R+14
- County
- — inherits STATE
- City
- — inherits STATE
ZIP-level market 72051
- Active inventory
- 11
- Price-to-rent
- 5.3×
Monthly cashflow live
- Estimated rent
- $863 medium interval (Pro) →
- Mortgage (P&I)
- −$288
- Tax from tax record
- −$25 /mo · $305/yr
- Insurance
- −$23
- HOA
- −$0
- Vacancy / Maint / Mgmt
- −$181
- Net cashflow
- $345
Break-even live
UW: 25.0% down · 7.5% · 30yr · 1.5% tax · 5.0% vac · 8.0% maint · 8.0% mgmt
Financing live
Cash to close
- Down payment
- $13,725
- Closing costs
- $1,647
- Reserves months
- —
- Total cash needed
- —
Loan-product check · same deal, 3 products live
Conventional
25% down · 7.5% · 30yr
- Down + closing
- —
- Monthly P&I
- —
- Monthly cashflow
- —
- DSCR
- —
- Eligible?
- —
Personal DTI + credit; lowest rate.
DSCR
20% down · 8.5% · 30yr
- Down + closing
- —
- Monthly P&I
- —
- Monthly cashflow
- —
- DSCR
- —
- Eligible?
- —
No personal income docs; deal must DSCR.
Hard money
10% down · 12.0% · 12mo
- Down + closing
- —
- Monthly P&I
- —
- Monthly cashflow
- —
- DSCR
- —
- Eligible?
- —
Short-term bridge; refi at stabilization.
Listing history 20 events
-
2026-06-19days on market $54,900 Active 255 DOM
-
2026-06-18days on market $54,900 Active 254 DOM
-
2026-06-17days on market $54,900 Active 253 DOM
-
2026-06-16days on market $54,900 Active 252 DOM
-
2026-06-15days on market $54,900 Active 251 DOM
-
2026-06-14days on market $54,900 Active 249 DOM
-
2026-06-12days on market $54,900 Active 248 DOM
-
2026-06-09days on market $54,900 Active 245 DOM
-
2026-06-08days on market $54,900 Active 244 DOM
-
2026-06-07days on market $54,900 Active 243 DOM
-
2026-06-07days on market $54,900 Active 242 DOM
-
2026-06-02days on market $54,900 Active 238 DOM
-
2026-06-01days on market $54,900 Active 237 DOM
-
2026-05-31days on market $54,900 Active 236 DOM
-
2026-05-30days on market $54,900 Active 235 DOM
-
2026-01-15status Back on Market 66-char remark
Show marketing remark (66 chars)
Great investment, fixer upper hwy frontage would make great rental
-
2025-12-15historical Take Backups 66-char remark
Show marketing remark (66 chars)
Great investment, fixer upper hwy frontage would make great rental
-
2025-10-16status Back on Market 66-char remark
Show marketing remark (66 chars)
Great investment, fixer upper hwy frontage would make great rental
-
2025-10-13historical Take Backups 66-char remark
Show marketing remark (66 chars)
Great investment, fixer upper hwy frontage would make great rental
-
2025-10-07$54,900 New Listing 66-char remark
Show marketing remark (66 chars)
Great investment, fixer upper hwy frontage would make great rental
ⓘ Source: listings_history table (triggers on properties + properties_extension) + one-shot
backfill from property_details.listing_events for pre-trigger history.
Tax reassessment forecast AR · Resets to sale price
- Current annual tax
- $305 · $25/mo
- Projected year-2 tax
- $351 · $29/mo
- Expected delta
- +$46/yr (+$4/mo · 15.1%)
ⓘ Screening estimate from a state-policy table — verify with the county assessor before closing.
Climate risk First Street
- Flood 1/10 Low 0% chance over 30 yrs
- Wildfire 4/10 Moderate
- Heat 3/10 Moderate 4 d/yr ≥104°F today · 10 d/yr by 30 yrs out
- Wind 2/10 Low 4% chance of damaging wind over 30 yrs
- Air quality 2/10 Low 0 unhealthy d/yr today · 1 by 30 yrs out
Nearby sold comps map
Loading sold comps map…
Walkable amenities ~0.75 mi
Loading nearby amenities…
Taxation est. · year 1
- Rental income
- $10,352
- − Mortgage interest
- −$3,075
- − Property taxes
- −$305
- − Insurance
- −$274
- − Repairs & maintenance
- −$828
- − Management
- −$828
- − Depreciation
- −$1,597
- Taxable income
- $3,444
- Est. tax owed @ 24.0%
- −$826
- After-tax cash flow
- $3,317/yr
For passive investors: Depreciation is non-cash, so a rental often shows a tax loss while cash-flowing — sheltering income. Rental losses are passive: they offset passive income freely, and up to $25,000/yr can offset ordinary (W-2) income if you actively participate and your MAGI is under $100k (phasing out to $0 by $150k); unused losses carry forward. On sale, claimed depreciation is recaptured at up to 25%, and gains may owe capital-gains tax (a 1031 exchange can defer both). Figures are a year-1 estimate at your 24.0% rate — not tax advice; consult a CPA.
Schools (NCES district)
- District
- Mountain View School District
- NCES district ID
- 0510200
- Math proficiency
- 34% ▼ -20.00%
- Reading proficiency
- 41% ▼ -13.00%
- Median HH income
- $31,281
- Composite
- 30.61/100
- National rank
- #6192
- State rank
- #107 of 238 in AR
Livability — Fox
No livability data for this city. (Only ~50 U.S. cities are tracked.)
Census & demographics
- City population
- 604
- Population (ZIP)
- 604
Population outlook (Stone County) Hauer SSP2
- Today (2025)
- 12,440 people
- By 2030
- 12,372 · -0.5%
- By 2040
- 12,081 · -2.9%
- By 2050
- 11,628 · -6.5%
- By 2075
- 10,863 · -12.7%
- By 2100
- 9,420 · -24.3%
Race, ethnicity, and origin ACS 2023
- Neighborhood character
- Predominantly White (86%)
- Race & ethnicity
- White 86% Two or more races 13%
- Common ancestry
- Italian 11% Iranian 4% Romanian 1%
Political lean MEDSL · Stone
- 2024 margin
- Solid R (+61.7) · D 18.1% · R 79.7% · Other 2.2%
- 2008→2024 swing
- -25.3pp toward R · 2008: -36.4pp · 2024: -61.7pp
- All cycles
- 2024: R+61.7 2020: R+57.9 2016: R+52.3 2012: R+45.2 2008: R+36.4
Not yet ingested
- Civics
- —
Market trends
- HPI YoY
- —
- Current HPI
- —
- Rent YoY
- —
- Metro
- —
- State GDP YoY
- ▲ 3.80%
- F500 in state
- 10
Industry mix (Fortune 500 HQ in AR)
| Industry | F500 HQs | Revenue |
|---|---|---|
| Retail | 1 | $681B |
|
||
| Food / Agriculture | 1 | $53B |
|
||
| Retail / Energy | 1 | $22B |
|
||
| Transportation / Logistics | 1 | $12B |
|
||
| Energy | 1 | $4B |
|
||
Price history
5 events — show timeline
- 2026-01-15 Relisted — CARMLS
- 2025-12-15 Contingent — CARMLS
- 2025-10-16 Relisted — CARMLS
- 2025-10-13 Contingent — CARMLS
- 2025-10-07 Listed $54,900 CARMLS
Property tax history
-6.6%/yrLatest (2025): $305 · +0.0% YoY. Source: county tax records.
Cash-flow waterfall
monthlySold comps — $/sqft
last 12 mo · ≤1 miLoading sold comps…