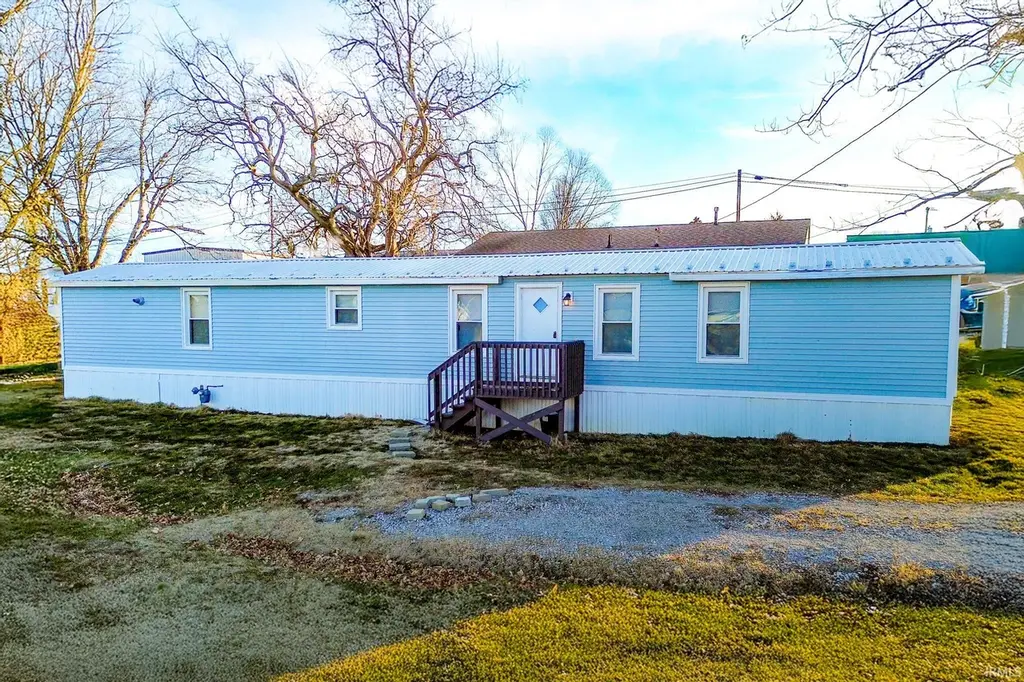
207 W Chestnut St · Gosport, IN
Flood risk No data
- FEMA flood zone
- —
- Chance of flooding over 30 yrs
- —
- Est. flood insurance / yr
- —
Fire risk No data
- Est. fire insurance / yr
- —
Heat risk No data
- Hot days now (above threshold)
- —
- Hot days in 30 yrs
- —
Wind risk No data
- Chance of severe wind over 30 yrs
- —
Air-quality risk No data
- Unhealthy air days now
- —
- Unhealthy air days in 30 yrs
- —
Risk factors via First Street. Map © Google.
Why this score? — see what drove the C+ grade
The composite is a weighted blend of 9 inputs, each scored 0–100. Each bar is that input's sub-score; the figure is the points it added to the 100-point composite (weight × sub-score).
- Cash flow +25.4/30.0
- Appreciation +10.0/10.0
- DSCR +8.4/10.0
- 1% rule +6.7/10.0
- Condition / age +3.8/5.0
- Livability +3.6/5.0
- Schools +3.3/10.0
- Rent growth +2.5/5.0
- ARV discount +0.0/15.0
$94,000
🖨 Deal sheet 📄 Offer letter ✓ Due diligence
Listing remarks MLS
Welcome to your recently renovated, move-in ready home on its own city lot. With a sleek design and affordable price, this property offers both style and convenience. Enjoy the modern kitchen, cozy living area, and private outdoor space. The 2 car garage is in unknown condition, but could potentially be restored. Don't miss out on this great opportunity!
Key facts
- Move-in ready
- Cozy living area
- Recently renovated
Tags
Neighborhood map
What this means for you Summary
Snapshot
- This is a 3-bed/2.0-bath single-family listed at $94k. Condition is rated good.
Deal economics
- At list price, monthly cash flow is $216 ($3k/yr) — positive.
- The deal already cash-flows at list — no discount required.
- Meets the 1% rule at list price ($1k rent vs $94k).
- Recommended offer: $83k (12.0% below list) — sets the bar for market timing.
Location & tenants
- Location reads 71/100 on livability (#133 in IN) — a middle-class / working-renter tenant base. Strengths: crime A+, cost of living A+, housing A+; Watch: schools D+, employment D, amenities F.
- Spencer-Owen Community Schools (rural): math 38% / reading 40% proficiency, ranked #155 of 301 in IN (top 52%) — families likely to look elsewhere, expect single-tenant / working-renter base with shorter leases.
- Market conditions: 30 active listings in the ZIP; 120 units permitted in Owen County in 2024 (0 in 5+ unit buildings).
Forward outlook
- In year one you build about $10k of equity ($650 loan paydown + $9k appreciation (10.0% local appreciation)).
- Owen County population projected at -30% by 2050 — secular population decline; favor cash flow + early exit over multi-decade hold.
- At projected returns (10.0% appreciation + 3.0% rent growth), your $26k cash investment doubles in ~2 years — after that, you're playing with house money.
- By year 4, paydown + projected appreciation supports a ~$36k cash-out refi (75% LTV) — recoverable capital for the next deal without selling this one.
Negotiation context
- It's been on market 134 days — a 12% lower offer ($83k) is reasonable based on typical stale-listing flexibility.
- 3 sale attempts since 2y ago; this cycle's ask has dropped $5k (5%) from the opening price — seller is motivated, your offer sets the floor, not the list.
Questions for the listing agent
- It's been on market 134 days. Have you received any prior offers? Is the seller open to a 12% concession, seller financing, or rate buy-down credit?
- Why hasn't it sold? Are there any deal-killer items the seller is aware of (foundation, flood, title, zoning, code violations)?
- Is there a deadline driving the sale (1031 exchange, divorce, estate, relocation)? That informs how much negotiation room exists.
- Schools are D-rated, which usually means shorter tenancies and higher turnover. Who's the typical renter profile here, and what's been the actual vacancy rate?
- What's the average days-on-market for RENTAL listings here right now (not sales)? A rising rental-DOM trend means longer vacancies and softer asking-rent achievability than the comps imply.
- What's the recent tenant-quality profile in this submarket — average credit score on applications, eviction rate, late-payment / NSF rate, and stable-employment percentage? A property-management company in the area should have these aggregated.
- How much new for-sale + rental construction is in the pipeline within 1–3 miles? Heavy new supply typically softens prices + rents 12–24 months out; constrained supply supports both.
Investment metrics
- 1% rule
- 1.17% ✓
- Cap rate
- 9.05%
- Cash-on-cash
- 9.86%
- DSCR
- 1.44
- GRM
- 7.1
CMA / ARV
- ARV (median comp)
- $76,229
- List price
- $94,000
- Delta
- 23.31%
- Verdict
- OVERPRICED
- Comps
- 1 within 2.0 mi
Show comp detail 4 sales within ~0.75 mi
| Address | Dist | Beds/Ba | Sqft | Sold | Price | $/sf | Match |
|---|---|---|---|---|---|---|---|
| 467 N 7th St | 0.03mi | 3/1.0 | 1,280 (+11%) | 14mo | $184,500 | $144 | 64 |
| 346 W North St | 0.22mi | 3/2.0 | 1,268 (+10%) | 12mo | $254,000 | $200 | 63 |
| 239 E Walnut St | 0.47mi | 3/1.0 | 1,126 (-2%) | 12mo | $145,000 | $129 | 60 |
| 127 N 3rd St | 0.29mi | 3/1.0 | 1,218 (+6%) | 22mo | $175,000 | $144 | 54 |
Match score weights: distance 35% · size 25% · config 20% · recency 20%. Top-matched comps best support the ARV.
Projected returns pro-forma
10.0% appreciation · 3.0% rent growth · sell at horizon
- IRR
- 31.5%
- Equity multiple
- 3.47×
- Total profit
- $64,988
- Equity at exit
- $84,683
- IRR
- 27.2%
- Equity multiple
- 7.86×
- Total profit
- $180,578
- Equity at exit
- $182,621
Cash invested: $26,320 (down + closing). Projections, not guarantees.
Landlord ↔ Tenant lean methodology
- Overall (STATE)
- 90 Strongly Landlord-Friendly
- State Indiana
- 90 Strongly Landlord-Friendly · R+11
- County
- — inherits STATE
- City
- — inherits STATE
ZIP-level market 47433
- Home prices YoY
- 9.4%
- Active inventory
- 30
- Price-to-rent
- 7.1×
Monthly cashflow live
- Estimated rent
- $1,096 medium interval (Pro) →
- Mortgage (P&I)
- −$493
- Tax est. 1.5%
- −$118 /mo · $1,410/yr
- Insurance
- −$39
- HOA
- −$0
- Vacancy / Maint / Mgmt
- −$230
- Net cashflow
- $216
Break-even live
UW: 25.0% down · 7.5% · 30yr · 1.5% tax · 5.0% vac · 8.0% maint · 8.0% mgmt
Financing live
Cash to close
- Down payment
- $23,500
- Closing costs
- $2,820
- Reserves months
- —
- Total cash needed
- —
Loan-product check · same deal, 3 products live
Conventional
25% down · 7.5% · 30yr
- Down + closing
- —
- Monthly P&I
- —
- Monthly cashflow
- —
- DSCR
- —
- Eligible?
- —
Personal DTI + credit; lowest rate.
DSCR
20% down · 8.5% · 30yr
- Down + closing
- —
- Monthly P&I
- —
- Monthly cashflow
- —
- DSCR
- —
- Eligible?
- —
No personal income docs; deal must DSCR.
Hard money
10% down · 12.0% · 12mo
- Down + closing
- —
- Monthly P&I
- —
- Monthly cashflow
- —
- DSCR
- —
- Eligible?
- —
Short-term bridge; refi at stabilization.
Listing history 24 events
-
2026-06-19days on market $94,000 Active 134 DOM
-
2026-06-18days on market $94,000 Active 133 DOM
-
2026-06-17days on market $94,000 Active 132 DOM
-
2026-06-16days on market $94,000 Active 131 DOM
-
2026-06-15days on market $94,000 Active 130 DOM
-
2026-06-14days on market $94,000 Active 128 DOM
-
2026-06-13days on market $94,000 Active 127 DOM
-
2026-06-10days on market $94,000 Active 125 DOM
-
2026-06-09days on market $94,000 Active 124 DOM
-
2026-06-08days on market $94,000 Active 123 DOM
-
2026-06-07days on market $94,000 Active 122 DOM
-
2026-06-05days on market $94,000 Active 119 DOM
-
2026-06-03days on market $94,000 Active 118 DOM
-
2026-06-02days on market $94,000 Active 117 DOM
-
2026-06-01days on market $94,000 Active 116 DOM
-
2026-05-31days on market $94,000 Active 115 DOM
-
2026-05-30days on market $94,000 Active 114 DOM
-
2026-04-17price $94,000 356-char remark
Show marketing remark (356 chars)
Welcome to your recently renovated, move-in ready home on its own city lot. With a sleek design and affordable price, this property offers both style and convenience. Enjoy the modern kitchen, cozy living area, and private outdoor space. The 2 car garage is in unknown condition, but could potentially be restored. Don't miss out on this great opportunity!
-
2026-02-05$99,000 Active 356-char remark
Show marketing remark (356 chars)
Welcome to your recently renovated, move-in ready home on its own city lot. With a sleek design and affordable price, this property offers both style and convenience. Enjoy the modern kitchen, cozy living area, and private outdoor space. The 2 car garage is in unknown condition, but could potentially be restored. Don't miss out on this great opportunity!
-
2024-10-29$109,000 Active
-
2024-09-09price $119,900
-
2024-05-06price $134,900
-
2024-04-17price $139,900
-
2024-04-12$149,900 Active
ⓘ Source: listings_history table (triggers on properties + properties_extension) + one-shot
backfill from property_details.listing_events for pre-trigger history.
Nearby sold comps map
Loading sold comps map…
Walkable amenities ~0.75 mi
Loading nearby amenities…
Taxation est. · year 1
- Rental income
- $13,153
- − Mortgage interest
- −$5,265
- − Property taxes
- −$1,410
- − Insurance
- −$470
- − Repairs & maintenance
- −$1,052
- − Management
- −$1,052
- − Depreciation
- −$2,735
- Taxable income
- $1,169
- Est. tax owed @ 24.0%
- −$280
- After-tax cash flow
- $2,315/yr
For passive investors: Depreciation is non-cash, so a rental often shows a tax loss while cash-flowing — sheltering income. Rental losses are passive: they offset passive income freely, and up to $25,000/yr can offset ordinary (W-2) income if you actively participate and your MAGI is under $100k (phasing out to $0 by $150k); unused losses carry forward. On sale, claimed depreciation is recaptured at up to 25%, and gains may owe capital-gains tax (a 1031 exchange can defer both). Figures are a year-1 estimate at your 24.0% rate — not tax advice; consult a CPA.
Condition & rehab AI · 12 photos
This recently renovated, move-in ready home offers a good condition with modern updates and a good curb appeal. It is ready for immediate occupancy and minor improvements can further enhance its value.
Value-add opportunities
- Resale Paint exterior siding — Enhances curb appeal and property value
- Rental Replace carpet — Improves comfort and reduces maintenance costs
Renovation cost estimate screening
Value-add ROI direction
- Resale Paint exterior siding — Enhances curb appeal and property value ↑
- Rental Replace carpet — Improves comfort and reduces maintenance costs ↑
ⓘ Cost ranges are severity-bucket heuristics (US national rule-of-thumb). Get contractor quotes + a written scope before underwriting a rehab budget.
Schools (NCES district)
- District
- Spencer-Owen Community Schools
- NCES district ID
- 1810950
- Math proficiency
- 38% ▼ -6.00%
- Reading proficiency
- 40% ▼ -6.00%
- Median HH income
- $45,258
- Composite
- 33.21/100
- National rank
- #5529
- State rank
- #155 of 301 in IN
Livability — Gosport
- Score
- 71/100
- State rank
- #133
- US rank
- #6926
Category grades
Schools grade is shown separately in the Schools card above.
Census & demographics
- Census place
- Gosport, IN
- Population (ZIP)
- 3,722
Population outlook (Owen County) Hauer SSP2
- Today (2025)
- 19,045 people
- By 2030
- 17,930 · -5.9%
- By 2040
- 15,507 · -18.6%
- By 2050
- 13,253 · -30.4%
- By 2075
- 9,364 · -50.8%
- By 2100
- 6,686 · -64.9%
Race, ethnicity, and origin ACS 2023
- Neighborhood character
- Predominantly White (98%)
- Race & ethnicity
- White 98% Two or more races 2%
- Common ancestry
- Italian 12% Iranian 2% Slovak 2%
- Foreign-born
- 0%
Political lean MEDSL · Owen
- 2024 margin
- Solid R (+50.7) · D 23.8% · R 74.5% · Other 1.6%
- 2008→2024 swing
- -40.3pp toward R · 2008: -10.3pp · 2024: -50.7pp
- All cycles
- 2024: R+50.7 2020: R+49.1 2016: R+49.4 2012: R+27.6 2008: R+10.3
Not yet ingested
- Civics
- —
Market trends
- HPI YoY
- ▲ 24.01%
- Current HPI
- 278.3717
- Rent YoY
- —
- Metro
- —
- State GDP YoY
- ▲ 2.90%
- F500 in state
- 18
Industry mix (Fortune 500 HQ in IN)
| Industry | F500 HQs | Revenue |
|---|---|---|
| Industrial Machinery | 2 | $37B |
|
||
| Healthcare | 1 | $177B |
|
||
| Pharmaceuticals | 1 | $45B |
|
||
| Metals / Steel | 1 | $18B |
|
||
| Agriculture | 1 | $17B |
|
||
| Packaging | 1 | $12B |
|
||
Price history
-37.3% since first listed7 events — show timeline
- 2026-04-17 Price Changed $94,000 IRMLS
- 2026-02-05 Listed $99,000 IRMLS
- 2024-10-29 Listed $109,000 IRMLS
- 2024-09-09 Price Changed $119,900 IRMLS
- 2024-05-06 Price Changed $134,900 IRMLS
- 2024-04-17 Price Changed $139,900 IRMLS
- 2024-04-12 Listed $149,900 IRMLS
Cash-flow waterfall
monthlySold comps — $/sqft
last 12 mo · ≤1 miLoading sold comps…