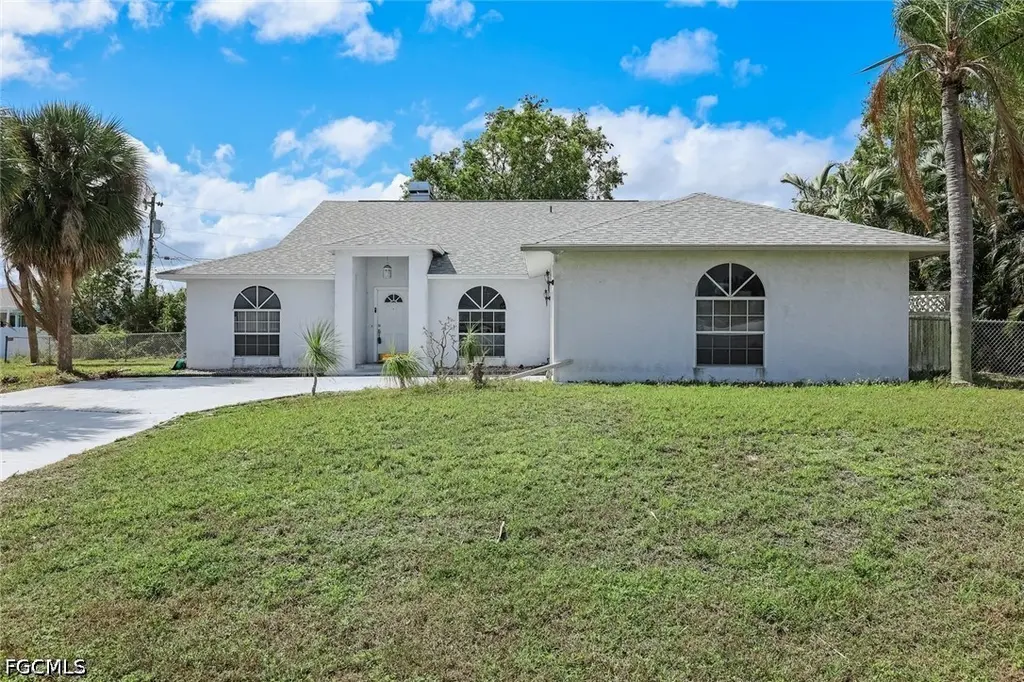
1208 SW 34th St · Cape Coral, FL
Flood risk 7/10 · Major
- FEMA flood zone
- X (shaded)
- Chance of flooding over 30 yrs
- 0.75%
- Est. flood insurance / yr
- $507 – $1,088
Fire risk 1/10 · Minimal
- Est. fire insurance / yr
- $947 – $1,759
Heat risk 10/10 · Severe
- Hot days now (above 107°F)
- 7 days/yr
- Hot days in 30 yrs
- 29 days/yr
Wind risk 10/10 · Severe
- Chance of severe wind over 30 yrs
- 99.0%
Air-quality risk 2/10 · Minimal
- Unhealthy air days now
- 1 days/yr
- Unhealthy air days in 30 yrs
- 1 days/yr
Risk factors via First Street. Map © Google.
Why this score? — see what drove the C- grade
The composite is a weighted blend of 9 inputs, each scored 0–100. Each bar is that input's sub-score; the figure is the points it added to the 100-point composite (weight × sub-score).
- Cash flow +15.3/30.0
- ARV discount +15.0/15.0
- DSCR +4.7/10.0
- Schools +4.1/10.0
- Livability +3.9/5.0
- 1% rule +3.3/10.0
- Condition / age +2.5/5.0
- Rent growth +1.4/5.0
- Appreciation +0.0/10.0
$297,000
🖨 Deal sheet 📄 Offer letter ✓ Due diligence
Listing remarks
Great price for this large well-designed home with all assessments paid. Located in a quiet yet convenient neighborhood with NO flood insurance required. The triple lot provides 120 feet of frontage for this south facing home with a fenced yard. The living area features vaulted ceilings and a fireplace. The large kitchen has an island and tons of counter space as well as a pantry. There is a formal dining room at the front of the house as well as an eat in kitchen and a breakfast bar. The main bedroom is spacious with a walk-in closet, a large en-suite bathroom with a jetted tub and separate shower. There is a French door from the bedroom to access the patio. Outside there is a large, scree
Key facts
- Fenced yard
- Vaulted ceilings
- Triple lot
Tags
Neighborhood map
What this means for you Summary
Snapshot
- This is a 3-bed/2.0-bath single-family listed at $297k.
Deal economics
- At list price, monthly cash flow is $43 ($513/yr) — positive.
- The deal already cash-flows at list — no discount required.
- To meet the 1% rule (rent ≥ 1% of price), the offer needs to be $248k (16.5% below list).
- Recommended offer: $248k (16.5% below list) — sets the bar for 1% rule.
- Cap rate 6.7% vs local median 3.1% in Cape Coral — top-decile yield for the area; either an underpriced asset or a hidden risk that comps aren't pricing in. Stress-test before assuming the spread holds.
Location & tenants
- Location reads 77/100 on livability (#208 in FL, #3,098 nationally) — a middle-class / working-renter tenant base. Strengths: housing A+, health & safety A+, amenities B+; Watch: commute F.
- Lee (suburban): math 47% / reading 50% proficiency, ranked #42 of 73 in FL (top 58%) — families likely to look elsewhere, expect single-tenant / working-renter base with shorter leases.
- Market conditions: Rents falling (-4.4%/yr); 1208 active listings in the ZIP; 40 comparable units currently listed for rent nearby; rentals at typical pace (median 22d on market — plan ~3-4 weeks tenant-placement turnaround); solid renter incomes; 15,411 units permitted in Lee County in 2024 (4,686 in 5+ unit buildings).
- This rent runs 36% of the median local income ($84k/yr) — at the standard rent-burdened threshold; future hikes will face affordability resistance.
Forward outlook
- Local home prices are declining (-3.0%/yr); year-one equity from $2k of loan paydown is wiped out by about $9k of value loss. Plan a longer hold.
- Lee County population projected at +44% by 2050 — long-run rental-demand tailwind backs the buy-and-hold thesis.
Negotiation context
- Only 7 days on market — expect competitive offers; lowballing is unlikely to land.
- 3 sale attempts since 7y ago with the ask held roughly flat each time — persistent listings suggest the price (not the market) is what's stuck; bring a comps-based counter.
- Current owner paid $121k; list at $297k implies a 145% gain — meaningful room to come down on a strong offer.
Risks & watch-outs
- Watch-outs: flood insurance adds $66/mo.
- Climate carrying-cost: major flood risk; severe wind risk, 99% chance of damaging wind over 30y; extreme-heat days projected 7→29/yr by 2055 (HVAC capex compounding) — expect insurance premiums to compound above CPI over the hold.
Questions for the listing agent
- What's the actual annual flood-insurance premium (NFIP or private), and is the property in a SFHA with mandatory coverage?
- Is there a deadline driving the sale (1031 exchange, divorce, estate, relocation)? That informs how much negotiation room exists.
- Schools are B-rated — typically a magnet for longer-tenancy family renters. What's the average tenant stay here, and is there a school-zone premium baked into asking?
- What's the average days-on-market for RENTAL listings here right now (not sales)? A rising rental-DOM trend means longer vacancies and softer asking-rent achievability than the comps imply.
- What's the recent tenant-quality profile in this submarket — average credit score on applications, eviction rate, late-payment / NSF rate, and stable-employment percentage? A property-management company in the area should have these aggregated.
- How much new for-sale + rental construction is in the pipeline within 1–3 miles? Heavy new supply typically softens prices + rents 12–24 months out; constrained supply supports both.
Investment metrics
- 1% rule
- 0.83% ✗
- Cap rate
- 6.73%
- Cash-on-cash
- 1.58%
- DSCR
- 1.07
- GRM
- 10.0
CMA / ARV
- ARV (on-the-fly)
- $475,436
- Comps found
- 12
Show comp detail 12 sales within ~0.75 mi
| Address | Dist | Beds/Ba | Sqft | Sold | Price | $/sf | Match |
|---|---|---|---|---|---|---|---|
| 1208 SW 34th St | 0.00mi | 3/2.0 | 2,132 (0%) | 0mo | $300,000 | $141 | 100 |
| 910 SW 33rd Ter | 0.41mi | 3/2.0 | 1,991 (-7%) | 1mo | $335,000 | $168 | 69 |
| 3509 SW 8th Ct | 0.51mi | 3/2.0 | 2,022 (-5%) | 2mo | $350,000 | $173 | 66 |
| 1216 SW 31st Ter | 0.32mi | 3/2.0 | 2,316 (+9%) | 8mo | $600,000 | $259 | 64 |
| 838 Gleason Pkwy | 0.52mi | 4/2.0 (+1) | 2,057 (-4%) | 3mo | $290,000 | $141 | 63 |
| 3809 SW 11th Ct | 0.55mi | 3/2.0 | 1,991 (-7%) | 2mo | $494,900 | $249 | 62 |
| 3435 SW 8th Ct | 0.51mi | 4/3.0 (+1) | 2,035 (-4%) | 5mo | $610,000 | $300 | 56 |
| 919 SW 36th Ter | 0.45mi | 4/3.0 (+1) | 2,201 (+3%) | 19mo | $490,000 | $223 | 49 |
| 1134 SW 31st Ter | 0.34mi | 4/3.0 (+1) | 2,312 (+8%) | 16mo | $742,500 | $321 | 48 |
| 1516 SW 29th St | 0.72mi | 4/2.0 (+1) | 2,249 (+6%) | 9mo | $440,000 | $196 | 45 |
| 3833 SW 15th Pl | 0.70mi | 3/2.0 | 1,828 (-14%) | 12mo | $520,000 | $284 | 33 |
| 1316 SW 28th Ter | 0.72mi | 4/2.0 (+1) | 2,344 (+10%) | 19mo | $380,000 | $162 | 29 |
Match score weights: distance 35% · size 25% · config 20% · recency 20%. Top-matched comps best support the ARV.
Projected returns pro-forma
-3.0% appreciation · 0.0% rent growth · sell at horizon
- IRR
- -18.5%
- Equity multiple
- 0.37×
- Total profit
- $-52,715
- Equity at exit
- $44,284
- IRR
- -17.9%
- Equity multiple
- 0.15×
- Total profit
- $-70,662
- Equity at exit
- $25,679
Cash invested: $83,160 (down + closing). Projections, not guarantees.
Landlord ↔ Tenant lean methodology
- Overall (STATE)
- 87 Strongly Landlord-Friendly
- State Florida
- 87 Strongly Landlord-Friendly · R+3
- County
- — inherits STATE
- City
- — inherits STATE
ZIP-level market 33914
- Home prices YoY
- -30.0%
- Rents YoY
- -4.4%
- Active inventory
- 1208
- Price-to-rent
- 10.0×
Monthly cashflow live
- Estimated rent
- $2,479 high interval (Pro) →
- Mortgage (P&I)
- −$1,558
- Tax from tax record
- −$168 /mo · $2,015/yr
- Insurance
- −$124
- Flood insurance flood zone
- −$66 /mo · $798/yr
- HOA
- −$0
- Vacancy / Maint / Mgmt
- −$521
- Net cashflow
- $43
Break-even live
UW: 25.0% down · 7.5% · 30yr · 1.5% tax · 5.0% vac · 8.0% maint · 8.0% mgmt
Financing live
Cash to close
- Down payment
- $74,250
- Closing costs
- $8,910
- Reserves months
- —
- Total cash needed
- —
Loan-product check · same deal, 3 products live
Conventional
25% down · 7.5% · 30yr
- Down + closing
- —
- Monthly P&I
- —
- Monthly cashflow
- —
- DSCR
- —
- Eligible?
- —
Personal DTI + credit; lowest rate.
DSCR
20% down · 8.5% · 30yr
- Down + closing
- —
- Monthly P&I
- —
- Monthly cashflow
- —
- DSCR
- —
- Eligible?
- —
No personal income docs; deal must DSCR.
Hard money
10% down · 12.0% · 12mo
- Down + closing
- —
- Monthly P&I
- —
- Monthly cashflow
- —
- DSCR
- —
- Eligible?
- —
Short-term bridge; refi at stabilization.
Rent comps 40 comps
| Address | Beds | Baths | Sqft | Rent | $/sqft | DOM | Units | Dist |
|---|---|---|---|---|---|---|---|---|
| 1203 SW 34th Ter Cape Coral, FL | 3.0 | 2.0 | 1422 | $2,250 | $1.58 | 10d | 1 | 0.05mi |
| 1203 SW 34th Ter Cape Coral, FL | 3.0 | 2.0 | 1422 | $2,250 | $1.58 | 3d | 1 | 0.05mi |
| 3305 SW 15th Pl Cape Coral, FL | 3.0 | 2.0 | 1550 | $1,750 | $1.13 | 14d | 1 | 0.30mi |
| 1005 SW 33rd Ter Unit NA Cape Coral, FL | 3.0 | 2.0 | 1400 | $1,900 | $1.36 | 2d | 1 | 0.31mi |
| 1400 SW 31st Ter Cape Coral, FL | 3.0 | 2.0 | 1709 | $2,695 | $1.58 | 14d | 1 | 0.34mi |
| 1622 SW 33rd St Cape Coral, FL | 3.0 | 2.0 | 2418 | $1,795 | $0.74 | 24d | 1 | 0.49mi |
| 1000 SW 37th St Cape Coral, FL | 3.0 | 2.0 | 1578 | $2,150 | $1.36 | 24d | 1 | 0.50mi |
| 3011 SW 14th Ct Cape Coral, FL | 3.0 | 2.0 | 1455 | $1,825 | $1.25 | 24d | 1 | 0.52mi |
| 1609 Savona Pkwy W Cape Coral, FL | 3.0 | 2.0 | 1560 | $1,770 | $1.13 | 24d | 1 | 0.54mi |
| 3429 SW 8th Pl Cape Coral, FL | 3.0 | 2.0 | 1426 | $2,100 | $1.47 | 24d | 1 | 0.58mi |
| 1502 SW 38th St Cape Coral, FL | 3.0 | 3.0 | 2294 | $5,800 | $2.53 | 24d | 1 | 0.60mi |
| 1137 SW 29th Ter Cape Coral, FL | 4.0 | 3.0 | 1850 | $3,100 | $1.68 | 2d | 1 | 0.62mi |
| 845 SW 37th Ln Cape Coral, FL | 3.0 | 2.0 | 1600 | $1,690 | $1.06 | 2d | 1 | 0.65mi |
| 1203 SW 29th St Cape Coral, FL | 4.0 | 2.0 | 1829 | $2,326 | $1.27 | 3d | 1 | 0.67mi |
| 1428 SW 29th St Cape Coral, FL | 3.0 | 2.0 | 1455 | $1,750 | $1.20 | 24d | 1 | 0.68mi |
| 3305 SW 7th Pl Cape Coral, FL | 3.0 | 2.0 | 1451 | $2,150 | $1.48 | 24d | 1 | 0.71mi |
| 3127 SW 18th Pl Cape Coral, FL | 4.0 | 2.0 | 2016 | $2,500 | $1.24 | 24d | 1 | 0.74mi |
| 3818 SW 17th Ave Cape Coral, FL | 3.0 | 2.0 | 2265 | $3,200 | $1.41 | 2d | 1 | 0.77mi |
| 2937 SW 8th Pl Cape Coral, FL | 3.0 | 2.0 | 1706 | $3,550 | $2.08 | 24d | 1 | 0.80mi |
| 1325 SW 28th St Cape Coral, FL | 3.0 | 2.5 | 1527 | $2,500 | $1.64 | 24d | 1 | 0.82mi |
| 3423 SW 6th Pl Cape Coral, FL | 4.0 | 2.0 | 1668 | $2,250 | $1.35 | 16d | 1 | 0.82mi |
| 1403 SW 40th Ter Cape Coral, FL | 3.0 | 2.0 | 1614 | $5,080 | $3.15 | 24d | 1 | 0.85mi |
| 1103 SW 40th Ter Cape Coral, FL | 3.0 | 2.0 | 1812 | $1,890 | $1.04 | 12d | 1 | 0.85mi |
| 1114 SW 40th Ter Cape Coral, FL | 4.0 | 2.0 | 1829 | $2,181 | $1.19 | 3d | 1 | 0.87mi |
| 4022 SW 12th Pl Cape Coral, FL | 3.0 | 2.0 | 1431 | $2,695 | $1.88 | 24d | 1 | 0.87mi |
| 1816 SW 38th Ter Cape Coral, FL | 3.0 | 2.0 | 1666 | $1,900 | $1.14 | 16d | 1 | 0.88mi |
| 3818 SW 7th Pl Cape Coral, FL | 2.0 | 2.0 | 2014 | $1,499 | $0.74 | 14d | 1 | 0.89mi |
| 3619 SW 6th Ave Cape Coral, FL | 3.0 | 2.0 | 1926 | $2,800 | $1.45 | 24d | 1 | 0.94mi |
| 2705 SW 11th Pl Cape Coral, FL | 3.0 | 2.0 | 1557 | $6,500 | $4.17 | 24d | 1 | 0.95mi |
| 4024 Chiquita Blvd S Cape Coral, FL | 3.0 | 3.0 | 2458 | $6,500 | $2.64 | 3d | 1 | 0.96mi |
| 2613 SW 15th Ave Cape Coral, FL | 3.0 | 2.0 | 1849 | $2,375 | $1.28 | 3d | 1 | 0.96mi |
| 2613 SW 15th Ave Cape Coral, FL | 3.0 | 2.0 | 1849 | $2,375 | $1.28 | 16d | 1 | 0.96mi |
| 428 SW 37th St Cape Coral, FL | 3.0 | 2.0 | 1705 | $3,500 | $2.05 | 3d | 1 | 1.09mi |
| 624 Mohawk Pkwy Cape Coral, FL | 3.0 | 2.0 | 1745 | $2,750 | $1.58 | 3d | 1 | 1.09mi |
| 531 SW 39th Ter Cape Coral, FL | 4.0 | 2.0 | 1425 | $2,600 | $1.82 | 24d | 1 | 1.10mi |
| 3729 Agualinda Blvd Cape Coral, FL | 4.0 | 2.0 | 2339 | $3,000 | $1.28 | 21d | 1 | 1.11mi |
| 4126 SW 8th Pl Cape Coral, FL | 3.0 | 2.0 | 1401 | $1,700 | $1.21 | 3d | 1 | 1.13mi |
| 4113 Skyline Blvd Cape Coral, FL | 3.0 | 2.0 | 2418 | $2,000 | $0.83 | 24d | 1 | 1.14mi |
| 4229 SW 14th Pl Cape Coral, FL | 3.0 | 2.0 | 2800 | $3,300 | $1.18 | 24d | 1 | 1.14mi |
| 4131 SW 17th Pl Cape Coral, FL | 3.0 | 2.0 | 2007 | $3,975 | $1.98 | 24d | 1 | 1.14mi |
Listing history 13 events
-
2026-04-17status Pending
-
2026-04-10$297,000 Active
-
2026-03-31historical
-
2026-01-06price $325,000
-
2025-10-17price $355,000
-
2025-09-16$365,000 Active
-
2020-06-01historical
-
2020-02-03price $254,500
-
2019-11-19price $255,000
-
2019-08-28$260,000 Active
-
2001-08-29soldstatus $121,000
-
1996-08-01soldstatus $90,000
-
1992-06-29soldstatus $85,000
ⓘ Source: listings_history table (triggers on properties + properties_extension) + one-shot
backfill from property_details.listing_events for pre-trigger history.
Tax reassessment forecast FL · Resets to sale price
- Current annual tax
- $2,015 · $168/mo
- Projected year-2 tax
- $2,465 · $205/mo
- Expected delta
- +$450/yr (+$37/mo · 22.3%)
ⓘ Screening estimate from a state-policy table — verify with the county assessor before closing.
Climate risk First Street
- Flood 7/10 Severe FEMA zone X (shaded) · 75% chance over 30 yrs
- Wildfire 1/10 Low
- Heat 10/10 Extreme 7 d/yr ≥107°F today · 29 d/yr by 30 yrs out
- Wind 10/10 Extreme 99% chance of damaging wind over 30 yrs
- Air quality 2/10 Low 1 unhealthy d/yr today · 1 by 30 yrs out
Nearby sold comps map
Loading sold comps map…
Walkable amenities ~0.75 mi
Loading nearby amenities…
Taxation est. · year 1
- Rental income
- $29,748
- − Mortgage interest
- −$16,637
- − Property taxes
- −$2,015
- − Insurance
- −$2,282
- − Repairs & maintenance
- −$2,380
- − Management
- −$2,380
- − Depreciation
- −$8,640
- Taxable loss
- −$4,586
- Est. tax savings @ 24.0%
- +$1,101
- After-tax cash flow
- $1,614/yr
For passive investors: Depreciation is non-cash, so a rental often shows a tax loss while cash-flowing — sheltering income. Rental losses are passive: they offset passive income freely, and up to $25,000/yr can offset ordinary (W-2) income if you actively participate and your MAGI is under $100k (phasing out to $0 by $150k); unused losses carry forward. On sale, claimed depreciation is recaptured at up to 25%, and gains may owe capital-gains tax (a 1031 exchange can defer both). Figures are a year-1 estimate at your 24.0% rate — not tax advice; consult a CPA.
Schools (NCES district)
- District
- Lee
- NCES district ID
- 1201080
- Math proficiency
- 47% ▼ -11.00%
- Reading proficiency
- 50% ▼ -4.00%
- Median HH income
- $49,518
- Composite
- 41.49/100
- National rank
- #3458
- State rank
- #42 of 73 in FL
Livability — Cape Coral
- Score
- 77/100
- State rank
- #208
- US rank
- #3098
Category grades
Schools grade is shown separately in the Schools card above.
Census & demographics
- Census place
- Cape Coral, FL
- County
- Lee County · 788,662 people
- City population
- 217,388
- Metro
- Cape Coral-Fort Myers, FL
- Population (ZIP)
- 45,540
- Household income
- $83,503
- Rent vs Own
- Severe rent burden
- 835.0
Population outlook (Lee County) Hauer SSP2
- Today (2025)
- 871,946 people
- By 2030
- 955,468 · +9.6%
- By 2040
- 1,113,587 · +27.7%
- By 2050
- 1,256,891 · +44.1%
- By 2075
- 1,560,270 · +78.9%
- By 2100
- 1,726,848 · +98.0%
Race, ethnicity, and origin ACS 2023
- Neighborhood character
- Predominantly White (72%)
- Race & ethnicity
- White 72% Hispanic / Latino 20% Two or more races 13% Black 5%
- Hispanic origin (detail)
- Mexican 1% Puerto Rican 4% Cuban 8%
- Common ancestry
- Romanian 4% Lithuanian 2% Slovak 1%
- Foreign-born
- 17% · Canada, Jamaica
- Languages at home
- 80% English-only · Spanish 16% German/W. Germanic 1% Russian/Polish/Slavic 1%
Political lean MEDSL · Lee
- 2024 margin
- Strong R (+28.4) · D 35.5% · R 63.9%
- 2008→2024 swing
- -18.0pp toward R · 2008: -10.4pp · 2024: -28.4pp
- All cycles
- 2024: R+28.4 2020: R+19.2 2016: R+20.4 2012: R+16.6 2008: R+10.4
Not yet ingested
- Civics
- —
Market trends
- HPI YoY
- ▼ -122.73%
- Current HPI
- 286.3064
- Rent YoY
- ▼ -4.42%
- Metro
- Cape Coral-Fort Myers, FL
- State GDP YoY
- ▲ 3.28%
- F500 in state
- 36
Industry mix (Fortune 500 HQ in FL)
| Industry | F500 HQs | Revenue |
|---|---|---|
| Industrial Technology | 2 | $29B |
|
||
| Insurance | 2 | $17B |
|
||
| Retail | 1 | $60B |
|
||
| Technology Distribution | 1 | $58B |
|
||
| Homebuilding | 1 | $35B |
|
||
| Technology Manufacturing | 1 | $35B |
|
||
Price history
+249.4% since first listed13 events — show timeline
- 2026-04-17 Pending — FORTMLS
- 2026-04-10 Listed $297,000 FORTMLS
- 2026-03-31 Listing Removed — FORTMLS
- 2026-01-06 Price Changed $325,000 FORTMLS
- 2025-10-17 Price Changed $355,000 FORTMLS
- 2025-09-16 Listed $365,000 FORTMLS
- 2020-06-01 Listing Removed — FORTMLS
- 2020-02-03 Price Changed $254,500 FORTMLS
- 2019-11-19 Price Changed $255,000 FORTMLS
- 2019-08-28 Listed $260,000 FORTMLS
- 2001-08-29 Sold (Public Records) $121,000 Public Records
- 1996-08-01 Sold (Public Records) $90,000 Public Records
- 1992-06-29 Sold (Public Records) $85,000 Public Records
Property tax history
+4.4%/yrLatest (2025): $2,015 · +10.2% YoY. Source: county tax records.
Cash-flow waterfall
monthlySold comps — $/sqft
last 12 mo · ≤1 miLoading sold comps…