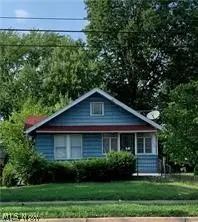
1035 E Archwood Ave · Akron, OH
Flood risk 1/10 · Minimal
- FEMA flood zone
- X (unshaded)
- Chance of flooding over 30 yrs
- 0.0%
- Est. flood insurance / yr
- $473 – $860
Fire risk 1/10 · Minimal
- Est. fire insurance / yr
- $713 – $1,323
Heat risk 3/10 · Minor
- Hot days now (above 96°F)
- 7 days/yr
- Hot days in 30 yrs
- 17 days/yr
Wind risk 1/10 · Minimal
- Chance of severe wind over 30 yrs
- —
Air-quality risk 2/10 · Minimal
- Unhealthy air days now
- 1 days/yr
- Unhealthy air days in 30 yrs
- 2 days/yr
Risk factors via First Street. Map © Google.
Why this score? — see what drove the B+ grade
The composite is a weighted blend of 9 inputs, each scored 0–100. Each bar is that input's sub-score; the figure is the points it added to the 100-point composite (weight × sub-score).
- Cash flow +28.9/30.0
- ARV discount +15.0/15.0
- DSCR +10.0/10.0
- 1% rule +8.1/10.0
- Rent growth +4.4/5.0
- Livability +4.0/5.0
- Condition / age +2.5/5.0
- Schools +2.1/10.0
- Appreciation +0.0/10.0
$76,000
🖨 Deal sheet (PDF) 📄 Offer letter ✓ Due diligence
Listing remarks MLS
INVESTMENT OPPORTUNITY! Home is currently being used as a rental property with a long-term tenant who pays $725 per month and all utilities. Lease is current until 7/2026 Additional properties available to purchase as a package.
Key facts
- 6,433 sq ft lot
- Garage
- Built 1928
Neighborhood map
What this means for you Summary
Snapshot
- This is a 2-bed/1.0-bath single-family listed at $76k.
Deal economics
- At list price, monthly cash flow is $258 ($3k/yr) — positive.
- The deal already cash-flows at list — no discount required.
- Meets the 1% rule at list price ($994 rent vs $76k).
- Recommended offer: $69k (9.0% below list) — sets the bar for market timing.
- Cap rate 10.4% vs local median 6.6% in Akron — top-decile yield for the area; either an underpriced asset or a hidden risk that comps aren't pricing in. Stress-test before assuming the spread holds.
Location & tenants
- Location reads 81/100 on livability (#104 in OH, #1,591 nationally) — a professional / high-income tenant draw. Strengths: amenities A+, commute A+, cost of living A+; Watch: crime F, employment F.
- Akron City (urban): math 22% / reading 30% proficiency, ranked #602 of 656 in OH (top 92%) — low school quality limits family demand, transient renter base, plan for 1-2y turnover; 66% free/reduced lunch — lower-income household profile, screen leases tightly.
- Market conditions: Rents rising fast (+7.6%/yr); 69 active listings in the ZIP; 40 comparable units currently listed for rent nearby; rentals lingering (median 45d on market — plan ~5-8 weeks vacancy on turnover, expect pricing pressure); 55% of comp listings sitting > 30 days — soft ceiling on asking rent; lower-income renter base — watch delinquency; 1,114 units permitted in Summit County in 2024 (397 in 5+ unit buildings).
Forward outlook
- Local home prices are declining (-3.0%/yr); year-one equity from $525 of loan paydown is wiped out by about $2k of value loss. Plan a longer hold.
- Summit County population projected to shrink 6% by 2050 — rents likely to lag national; underwrite the cash flow, not the appreciation.
- At projected returns (-3.0% appreciation + 7.6% rent growth), your $21k cash investment doubles in ~7 years — after that, you're playing with house money.
Negotiation context
- It's been on market 105 days — a 9% lower offer ($69k) is reasonable based on typical stale-listing flexibility.
- 4 sale attempts since 25y ago with the ask held roughly flat each time — persistent listings suggest the price (not the market) is what's stuck; bring a comps-based counter.
- Current owner paid $41k; list at $76k implies a 85% gain — meaningful room to come down on a strong offer.
Risks & watch-outs
- Watch-outs: built in 1928 — expect roof / HVAC / electrical / plumbing capex.
Questions for the listing agent
- It's been on market 105 days. Have you received any prior offers? Is the seller open to a 9% concession, seller financing, or rate buy-down credit?
- Built in 1928 — when were the roof, HVAC, electrical panel, plumbing, and water heater last replaced?
- Why hasn't it sold? Are there any deal-killer items the seller is aware of (foundation, flood, title, zoning, code violations)?
- Is there a deadline driving the sale (1031 exchange, divorce, estate, relocation)? That informs how much negotiation room exists.
- Crime grade is F in this area — have there been break-ins, vandalism, or insurance claims at this property in the last 3 years? What carrier currently insures it and at what premium?
- What's the average days-on-market for RENTAL listings here right now (not sales)? A rising rental-DOM trend means longer vacancies and softer asking-rent achievability than the comps imply.
- What's the recent tenant-quality profile in this submarket — average credit score on applications, eviction rate, late-payment / NSF rate, and stable-employment percentage? A property-management company in the area should have these aggregated.
- How much new for-sale + rental construction is in the pipeline within 1–3 miles? Heavy new supply typically softens prices + rents 12–24 months out; constrained supply supports both.
Investment metrics
- 1% rule
- 1.31% ✓
- Cap rate
- 10.37%
- Cash-on-cash
- 14.55%
- DSCR
- 1.65
- GRM
- 6.4
CMA / ARV
- ARV (median comp)
- $93,193
- List price
- $76,000
- Delta
- -18.45%
- Verdict
- UNDERPRICED
- Comps
- 20 within 1.0 mi
Show comp detail 12 sales within ~0.75 mi
| Address | Dist | Beds/Ba | Sqft | Sold | Price | $/sf | Match |
|---|---|---|---|---|---|---|---|
| 920 Clement St | 0.15mi | 2/1.0 | 940 (+9%) | 2mo | $95,000 | $101 | 76 |
| 627 Arden Pl | 0.44mi | 2/1.0 | 840 (-2%) | 1mo | $99,000 | $118 | 74 |
| 787 Ravenswood St | 0.31mi | 3/2.0 (+1) | 880 (+2%) | 7mo | $128,000 | $145 | 67 |
| 841 Concord Ave | 0.50mi | 3/1.0 (+1) | 840 (-2%) | 8mo | $97,000 | $115 | 62 |
| 540 Anderson Ave | 0.50mi | 2/1.5 | 928 (+8%) | 3mo | $125,000 | $135 | 60 |
| 766 Staeger St | 0.32mi | 3/1.0 (+1) | 960 (+12%) | 4mo | $100,900 | $105 | 58 |
| 985 Clement St | 0.27mi | 3/1.0 (+1) | 988 (+15%) | 4mo | $120,000 | $121 | 54 |
| 1124 Hammel St | 0.69mi | 2/1.0 | 913 (+6%) | 5mo | $129,900 | $142 | 53 |
| 553 Whitney Ave | 0.72mi | 2/1.0 | 916 (+6%) | 7mo | $40,000 | $44 | 50 |
| 529 Anderson Ave | 0.53mi | 3/1.0 (+1) | 960 (+12%) | 2mo | $156,500 | $163 | 49 |
| 982 Merton Ave | 0.55mi | 2/1.0 | 984 (+14%) | 2mo | $106,000 | $108 | 48 |
| 785 Reed Ave | 0.53mi | 2/1.0 | 732 (-15%) | 5mo | $109,900 | $150 | 46 |
Match score weights: distance 35% · size 25% · config 20% · recency 20%. Top-matched comps best support the ARV.
Projected returns pro-forma
-3.0% appreciation · 7.63% rent growth · sell at horizon
- IRR
- 10.1%
- Equity multiple
- 1.42×
- Total profit
- $8,984
- Equity at exit
- $11,332
- IRR
- 22.8%
- Equity multiple
- 3.39×
- Total profit
- $50,949
- Equity at exit
- $6,571
Cash invested: $21,280 (down + closing). Projections, not guarantees.
Landlord ↔ Tenant lean methodology
- Overall (STATE)
- 73 Landlord-Friendly
- State Ohio
- 73 Landlord-Friendly · R+6
- County
- — inherits STATE
- City
- — inherits STATE
ZIP-level market 44306
- Rents YoY
- 7.6%
- Active inventory
- 69
- Price-to-rent
- 6.4×
Monthly cashflow live
- Estimated rent
- $994 high interval (Pro) →
- Mortgage (P&I)
- −$399
- Tax from tax record
- −$97 /mo · $1,169/yr
- Insurance
- −$32
- HOA
- −$0
- Vacancy / Maint / Mgmt
- −$209
- Net cashflow
- $258
Break-even live
Sensitivity live
| Price | -10% $301 | -5% $280 | +0% $258 | +5% $237 | +10% $215 |
|---|---|---|---|---|---|
| Rent | -10% $179 | -5% $219 | +0% $258 | +5% $297 | +10% $337 |
| Rate | -1.0pp $296 | -0.5pp $277 | base $258 | +0.5pp $238 | +1.0pp $218 |
UW: 25.0% down · 7.5% · 30yr · 1.5% tax · 5.0% vac · 8.0% maint · 8.0% mgmt
Financing live
Cash to close
- Down payment
- $19,000
- Closing costs
- $2,280
- Reserves months
- —
- Total cash needed
- —
Loan-product check · same deal, 3 products live
Conventional
25% down · 7.5% · 30yr
- Down + closing
- —
- Monthly P&I
- —
- Monthly cashflow
- —
- DSCR
- —
- Eligible?
- —
Personal DTI + credit; lowest rate.
DSCR
20% down · 8.5% · 30yr
- Down + closing
- —
- Monthly P&I
- —
- Monthly cashflow
- —
- DSCR
- —
- Eligible?
- —
No personal income docs; deal must DSCR.
Hard money
10% down · 12.0% · 12mo
- Down + closing
- —
- Monthly P&I
- —
- Monthly cashflow
- —
- DSCR
- —
- Eligible?
- —
Short-term bridge; refi at stabilization.
Rent comps 40 comps
| Address | Beds | Baths | Sqft | Rent | $/sqft | DOM | Units | Dist |
|---|---|---|---|---|---|---|---|---|
| 920 Clement St Akron, OH | 2.0 | 1.0 | 940 | $995 | $1.06 | 15d | 1 | 0.15mi |
| 1055 Neville Ave Akron, OH | 2.0 | 1.0 | 600 | $700 | $1.17 | 44d | 1 | 0.20mi |
| 1017 Neville Ave Akron, OH | 2.0 | 1.0 | 600 | $675 | $1.12 | 44d | 1 | 0.20mi |
| 958 Hunt St Unit A Akron, OH | 1.0 | 1.0 | 800 | $750 | $0.94 | 44d | 1 | 0.24mi |
| 958 Hunt St #2 Akron, OH | 1.0 | 1.0 | 700 | $600 | $0.86 | 44d | 1 | 0.24mi |
| 1093 Georgia Ave Akron, OH | 2.0 | 1.0 | 752 | $1,103 | $1.47 | 15d | 1 | 0.27mi |
| 778 Ravenswood St Akron, OH | 2.0 | 1.0 | 616 | $1,150 | $1.87 | 24d | 1 | 0.28mi |
| 972 Concord Ave Akron, OH | 2.0 | 1.0 | 720 | $1,173 | $1.63 | 44d | 1 | 0.30mi |
| 1125 Georgia Ave Akron, OH | 3.0 | 1.0 | 1060 | $1,300 | $1.23 | 15d | 1 | 0.31mi |
| 864 Wyley Ave Akron, OH | 2.0 | 1.0 | 800 | $1,500 | $1.88 | 44d | 1 | 0.35mi |
| 1078 Lindsay Ave Akron, OH | 3.0 | 2.0 | 1005 | $1,350 | $1.34 | 44d | 1 | 0.36mi |
| 1070 Super Genius Cir Akron, OH | 2.0–4.0 | 1.0–2.0 | 1145 | $919 | $0.80 | 15d | 1 | 0.40mi |
| 902 Cole Ave Akron, OH | 3.0 | 1.0 | 984 | $1,050 | $1.07 | 15d | 1 | 0.42mi |
| 1005 Pardee Ave Akron, OH | 2.0 | 1.0 | 862 | $1,025 | $1.19 | 44d | 1 | 0.44mi |
| 668 Roscoe Ave Akron, OH | 2.0 | 1.0 | 720 | $875 | $1.22 | 44d | 1 | 0.49mi |
| 571 Chittenden St Akron, OH | 3.0 | 1.0 | 982 | $1,200 | $1.22 | 44d | 1 | 0.54mi |
| 1204 Inman St Akron, OH | 3.0 | 1.0 | 1080 | $1,200 | $1.11 | 24d | 1 | 0.55mi |
| 780 Anderson Ave #13 Akron, OH | 1.0 | 1.0 | 700 | $785 | $1.12 | 44d | 1 | 0.57mi |
| 780 Anderson Ave #12 Akron, OH | 1.0 | 1.0 | 700 | $785 | $1.12 | 15d | 1 | 0.57mi |
| 551 Baltimore Ave Unit 551 Akron, OH | 2.0 | 1.0 | 588 | $850 | $1.45 | 44d | 1 | 0.58mi |
| 551 Baltimore Ave Akron, OH | 2.0 | 1.0 | 588 | $850 | $1.45 | 24d | 1 | 0.58mi |
| 769 Anderson Ave #6 Akron, OH | 1.0 | 1.0 | 600 | $785 | $1.31 | 15d | 1 | 0.59mi |
| 794 Anderson Ave #9 Akron, OH | 1.0 | 1.0 | 600 | $785 | $1.31 | 24d | 1 | 0.59mi |
| 783 Anderson Ave Apt 5 Akron, OH | 2.0 | 1.0 | 900 | $900 | $1.00 | 44d | 1 | 0.60mi |
| 764 Lindsay Ave Akron, OH | 3.0 | 1.0 | 1000 | $1,295 | $1.29 | 15d | 1 | 0.60mi |
| 783 Anderson Ave Apt 10 Akron, OH | 2.0 | 1.0 | 900 | $900 | $1.00 | 15d | 1 | 0.60mi |
| 779 Anderson Ave Apt 11 Akron, OH | 2.0 | 1.0 | 900 | $900 | $1.00 | 24d | 1 | 0.61mi |
| 779 Anderson Ave Apt 10 Akron, OH | 2.0 | 1.0 | 900 | $900 | $1.00 | 15d | 1 | 0.61mi |
| 779 Anderson Ave Apt 11 Akron, OH | 2.0 | 1.0 | 900 | $900 | $1.00 | 44d | 1 | 0.61mi |
| 1313 Coventry St Akron, OH | 2.0 | 1.0 | 913 | $1,250 | $1.37 | 15d | 1 | 0.78mi |
| 548 Winans Ave Akron, OH | 1.0 | 1.0 | 700 | $1,100 | $1.57 | 44d | 1 | 0.82mi |
| 621 Hudson Ave Akron, OH | 3.0 | 1.0 | 780 | $1,100 | $1.41 | 15d | 1 | 0.87mi |
| 1102 Neptune Ave Akron, OH | 3.0 | 1.0 | 1000 | $1,200 | $1.20 | 44d | 1 | 0.93mi |
| 1036 Neptune Ave Akron, OH | 3.0 | 1.0 | 1000 | $1,350 | $1.35 | 44d | 1 | 0.97mi |
| 1442 Virginia Ave Akron, OH | 2.0 | 1.0 | 840 | $795 | $0.95 | 44d | 1 | 1.02mi |
| 1566 Coventry St Akron, OH | 1.0 | 1.5 | 600 | $795 | $1.32 | 44d | 1 | 1.02mi |
| 629 Morgan Ave Akron, OH | 2.0 | 1.0 | 960 | $1,200 | $1.25 | 44d | 1 | 1.02mi |
| 377 Talbot Ave Akron, OH | 2.0 | 1.0 | 1070 | $1,050 | $0.98 | 44d | 1 | 1.04mi |
| 1588 Coventry St Unit 7 Akron, OH | 1.0 | 1.0 | 600 | $795 | $1.32 | 24d | 1 | 1.05mi |
| 167 Chittenden St Unit 3 Akron, OH | 1.0 | 1.0 | 575 | $700 | $1.22 | 44d | 1 | 1.31mi |
Listing history 24 events
-
2026-06-18days on market $76,000 Active 105 DOM
-
2026-06-17days on market $76,000 Active 104 DOM
-
2026-06-16days on market $76,000 Active 103 DOM
-
2026-06-15days on market $76,000 Active 102 DOM
-
2026-06-14days on market $76,000 Active 100 DOM
-
2026-06-13days on market $76,000 Active 99 DOM
-
2026-06-10days on market $76,000 Active 97 DOM
-
2026-06-09days on market $76,000 Active 96 DOM
-
2026-06-08days on market $76,000 Active 95 DOM
-
2026-06-07days on market $76,000 Active 94 DOM
-
2026-06-05days on market $76,000 Active 91 DOM
-
2026-06-03days on market $76,000 Active 90 DOM
-
2026-06-02days on market $76,000 Active 89 DOM
-
2026-06-01days on market $76,000 Active 88 DOM
-
2026-05-31days on market $76,000 Active 87 DOM
-
2026-05-31days on market $76,000 Active 86 DOM
-
2026-03-05$76,000 Active 228-char remark
Show marketing remark (228 chars)
INVESTMENT OPPORTUNITY! Home is currently being used as a rental property with a long-term tenant who pays $725 per month and all utilities. Lease is current until 7/2026 Additional properties available to purchase as a package.
-
2021-08-30soldstatus $41,000 Closed 290-char remark
Show marketing remark (290 chars)
INVESTORS SPECIAL. Great opportunity to purchase this home currently being used as a rental property. Newer kitchen, bath, and flooring. Current rent is $675 a month with tenant paying all utilities. Additional properties available to purchase as a package. Contact us for more information.
-
2021-07-21status Pending 290-char remark
Show marketing remark (290 chars)
INVESTORS SPECIAL. Great opportunity to purchase this home currently being used as a rental property. Newer kitchen, bath, and flooring. Current rent is $675 a month with tenant paying all utilities. Additional properties available to purchase as a package. Contact us for more information.
-
2021-07-14$39,999 Active 290-char remark
Show marketing remark (290 chars)
INVESTORS SPECIAL. Great opportunity to purchase this home currently being used as a rental property. Newer kitchen, bath, and flooring. Current rent is $675 a month with tenant paying all utilities. Additional properties available to purchase as a package. Contact us for more information.
-
2003-12-24historical
-
2003-06-24$54,900
-
2001-12-12soldstatus $46,000
-
2001-10-25$53,900
ⓘ Source: listings_history table (triggers on properties + properties_extension) + one-shot
backfill from property_details.listing_events for pre-trigger history.
Tax reassessment forecast OH · Partial reset (capped growth)
- Current annual tax
- $1,169 · $97/mo
- Projected year-2 tax
- $1,177 · $98/mo
- Expected delta
- +$8/yr (+$1/mo · 0.7%)
ⓘ Screening estimate from a state-policy table — verify with the county assessor before closing.
Climate risk First Street
- Flood 1/10 Low FEMA zone X (unshaded) · 0% chance over 30 yrs
- Wildfire 1/10 Low
- Heat 3/10 Moderate 7 d/yr ≥96°F today · 17 d/yr by 30 yrs out
- Wind 1/10 Low
- Air quality 2/10 Low 1 unhealthy d/yr today · 2 by 30 yrs out
Nearby sold comps map
Loading sold comps map…
Walkable amenities ~0.75 mi
Loading nearby amenities…
Taxation est. · year 1
- Rental income
- $11,934
- − Mortgage interest
- −$4,257
- − Property taxes
- −$1,169
- − Insurance
- −$380
- − Repairs & maintenance
- −$955
- − Management
- −$955
- − Depreciation
- −$2,211
- Taxable income
- $2,007
- Est. tax owed @ 24.0%
- −$482
- After-tax cash flow
- $2,614/yr
For passive investors: Depreciation is non-cash, so a rental often shows a tax loss while cash-flowing — sheltering income. Rental losses are passive: they offset passive income freely, and up to $25,000/yr can offset ordinary (W-2) income if you actively participate and your MAGI is under $100k (phasing out to $0 by $150k); unused losses carry forward. On sale, claimed depreciation is recaptured at up to 25%, and gains may owe capital-gains tax (a 1031 exchange can defer both). Figures are a year-1 estimate at your 24.0% rate — not tax advice; consult a CPA.
Schools (NCES district)
- District
- Akron City
- NCES district ID
- 3904348
- Math proficiency
- 22% ▼ -17.00%
- Reading proficiency
- 30% ▼ -12.00%
- Median HH income
- $33,811
- Composite
- 21.31/100
- National rank
- #8383
- State rank
- #602 of 656 in OH
Livability — Akron
- Score
- 81/100
- State rank
- #104
- US rank
- #1591
Category grades
Schools grade is shown separately in the Schools card above.
Census & demographics
- Census place
- Akron, OH
- County
- Summit County · 440,783 people
- City population
- 174,375
- Metro
- Akron, OH
- Population (ZIP)
- 20,905
- Household income
- $41,688
- Rent vs Own
- Severe rent burden
- 1251.0
Population outlook (Summit County) Hauer SSP2
- Today (2025)
- 546,583 people
- By 2030
- 544,028 · -0.5%
- By 2040
- 531,363 · -2.8%
- By 2050
- 514,923 · -5.8%
- By 2075
- 481,765 · -11.9%
- By 2100
- 432,265 · -20.9%
Race, ethnicity, and origin ACS 2023
- Neighborhood character
- Diverse neighborhood (Simpson 0.62)
- Race & ethnicity
- White 48% Black 38% Two or more races 8% Hispanic / Latino 3% Asian 2%
- Common ancestry
- Lithuanian 2% Iranian 1% Scotch-Irish 1%
- Foreign-born
- 4% · Vietnam, Canada, Philippines
- Languages at home
- 94% English-only · Spanish 2% Other Asian/Pacific 1% Vietnamese 1%
Political lean MEDSL · Summit
- 2024 margin
- Lean D (+7.0) · D 53.0% · R 46.0%
- 2008→2024 swing
- -9.6pp toward R · 2008: 16.6pp · 2024: 7.0pp
- All cycles
- 2024: D+7.0 2020: D+9.6 2016: D+8.2 2012: D+14.8 2008: D+16.6
Not yet ingested
- Civics
- —
Market trends
- HPI YoY
- ▼ -101.46%
- Current HPI
- 132.768
- Rent YoY
- ▲ 7.63%
- Metro
- Akron, OH
- State GDP YoY
- ▲ 1.98%
- F500 in state
- 48
Industry mix (Fortune 500 HQ in OH)
| Industry | F500 HQs | Revenue |
|---|---|---|
| Insurance | 3 | $145B |
|
||
| Industrial Machinery | 3 | $49B |
|
||
| Financial Services | 3 | $24B |
|
||
| Consumer Goods | 2 | $93B |
|
||
| Aerospace / Defense | 2 | $47B |
|
||
| Utilities | 2 | $33B |
|
||
Price history
+41.0% since first listed8 events — show timeline
- 2026-03-05 Listed $76,000 MLSNOW
- 2021-08-30 Sold (MLS) $41,000 MLSNOW
- 2021-07-21 Pending — MLSNOW
- 2021-07-14 Listed $39,999 MLSNOW
- 2003-12-24 Listing Removed — MLSNOW
- 2003-06-24 Listed $54,900 MLSNOW
- 2001-12-12 Sold (Public Records) $46,000 Public Records
- 2001-10-25 Listed $53,900 MLSNOW
Property tax history
+2.6%/yrLatest (2025): $1,169 · +0.1% YoY. Source: county tax records.
Cash-flow waterfall
monthlySold comps — $/sqft
last 12 mo · ≤1 miLoading sold comps…