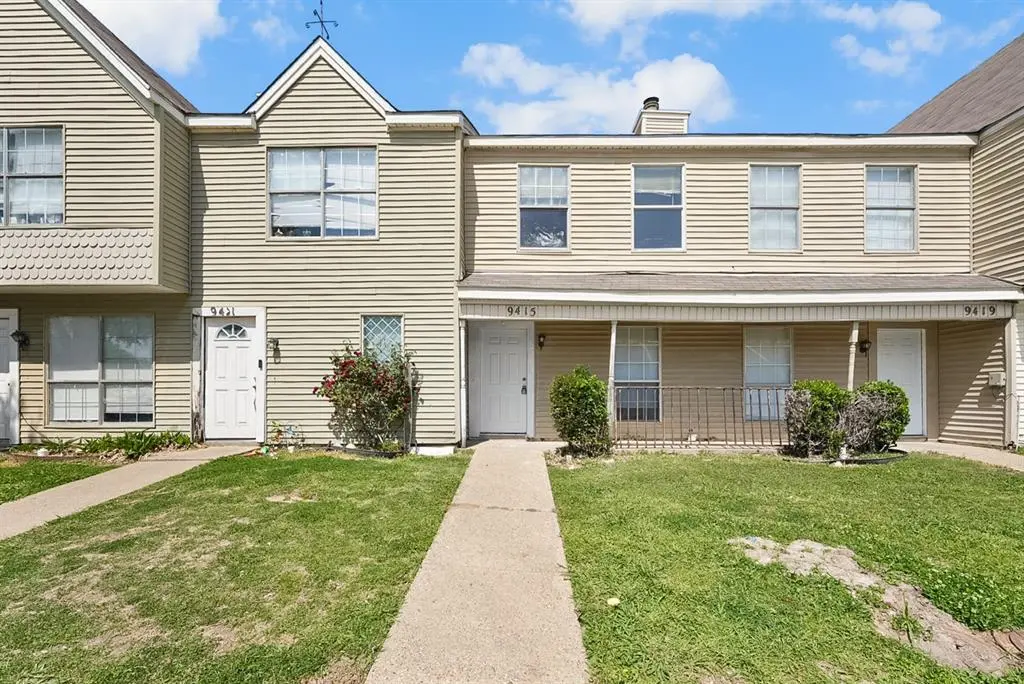
9415 Olde Towne Row · Dallas, TX
Flood risk 1/10 · Minimal
- FEMA flood zone
- X (unshaded)
- Chance of flooding over 30 yrs
- 0.0%
- Est. flood insurance / yr
- $507 – $1,088
Fire risk 1/10 · Minimal
- Est. fire insurance / yr
- $1,222 – $2,270
Heat risk 7/10 · Major
- Hot days now (above 110°F)
- 7 days/yr
- Hot days in 30 yrs
- 24 days/yr
Wind risk 6/10 · Moderate
- Chance of severe wind over 30 yrs
- 27.0%
Air-quality risk 2/10 · Minimal
- Unhealthy air days now
- 2 days/yr
- Unhealthy air days in 30 yrs
- 2 days/yr
Risk factors via First Street. Map © Google.
Why this score? — see what drove the B grade
The composite is a weighted blend of 9 inputs, each scored 0–100. Each bar is that input's sub-score; the figure is the points it added to the 100-point composite (weight × sub-score).
- Cash flow +28.0/30.0
- ARV discount +15.0/15.0
- 1% rule +10.0/10.0
- DSCR +9.9/10.0
- Livability +4.0/5.0
- Schools +2.8/10.0
- Condition / age +2.5/5.0
- Rent growth +2.4/5.0
- Appreciation +0.0/10.0
$84,990
🖨 Deal sheet (PDF) 📄 Offer letter ✓ Due diligence
Listing remarks MLS
415 Olde Towne in Dallas, TX offers a great opportunity for buyers or investors. This property does need some updates, making it ideal for those looking to customize and add value. It features a newly installed backyard fence for added privacy and outdoor enjoyment, along with two dedicated parking spaces for convenience, the property benefits from convenient access to Dallas Area Rapid Transit (DART), providing direct connections to Downtown Dallas and surrounding employment hubs. With easy access to major highways, shopping, dining, and public transportation and walking distance to elementary school, this location supports both daily commuting and long-term investment potential. This townhome is a smart investment or a great place to create your own personalized space.
Key facts
- $162 HOA
- Built 1983
- Listed 82 days
Neighborhood map
What this means for you Summary
Snapshot
- This is a 2-bed/2.5-bath townhouse listed at $85k.
Deal economics
- At list price, monthly cash flow is $264 ($3k/yr) — positive.
- The deal already cash-flows at list — no discount required.
- Meets the 1% rule at list price ($1k rent vs $85k).
- Recommended offer: $80k (6.0% below list) — sets the bar for market timing.
- Cap rate 10.0% vs local median 2.3% in Dallas — top-decile yield for the area; either an underpriced asset or a hidden risk that comps aren't pricing in. Stress-test before assuming the spread holds.
Location & tenants
- Location reads 81/100 on livability (#24 in TX, #1,380 nationally) — a professional / high-income tenant draw. Strengths: amenities A+, commute A+, housing A+; Watch: schools C-, crime F.
- Dallas ISD (urban): math 31% / reading 36% proficiency, ranked #559 of 826 in TX (top 68%) — families likely to look elsewhere, expect single-tenant / working-renter base with shorter leases; 83% free/reduced lunch — lower-income household profile, screen leases tightly.
- Market conditions: Rents soft (-0.4%/yr); 181 active listings in the ZIP; 40 comparable units currently listed for rent nearby; rentals at typical pace (median 26d on market — plan ~3-4 weeks tenant-placement turnaround); 45% of comp listings sitting > 30 days — soft ceiling on asking rent; 12,577 units permitted in Dallas County in 2024 (6,829 in 5+ unit buildings).
Forward outlook
- Local home prices are declining (-3.0%/yr); year-one equity from $588 of loan paydown is wiped out by about $3k of value loss. Plan a longer hold.
- Dallas County population projected at +35% by 2050 — long-run rental-demand tailwind backs the buy-and-hold thesis.
Negotiation context
- It's been on market 83 days — a 6% lower offer ($80k) is reasonable based on typical stale-listing flexibility.
Risks & watch-outs
- Watch-outs: property tax is 3.1% of price.
- Climate carrying-cost: major wind risk, 27% chance of damaging wind over 30y; extreme-heat days projected 7→24/yr by 2055 (HVAC capex compounding) — expect insurance premiums to compound above CPI over the hold.
Questions for the listing agent
- It's been on market 83 days. Have you received any prior offers? Is the seller open to a 6% concession, seller financing, or rate buy-down credit?
- Property tax is high relative to price — has the assessment been appealed recently, and will the sale trigger a re-assessment?
- What does the HOA fee cover, when was the last increase, and are there any pending special assessments or reserve-fund shortfalls?
- Why hasn't it sold? Are there any deal-killer items the seller is aware of (foundation, flood, title, zoning, code violations)?
- Is there a deadline driving the sale (1031 exchange, divorce, estate, relocation)? That informs how much negotiation room exists.
- Crime grade is F in this area — have there been break-ins, vandalism, or insurance claims at this property in the last 3 years? What carrier currently insures it and at what premium?
- What's the average days-on-market for RENTAL listings here right now (not sales)? A rising rental-DOM trend means longer vacancies and softer asking-rent achievability than the comps imply.
- What's the recent tenant-quality profile in this submarket — average credit score on applications, eviction rate, late-payment / NSF rate, and stable-employment percentage? A property-management company in the area should have these aggregated.
- How much new for-sale + rental construction is in the pipeline within 1–3 miles? Heavy new supply typically softens prices + rents 12–24 months out; constrained supply supports both.
Investment metrics
- 1% rule
- 1.67% ✓
- Cap rate
- 10.02%
- Cash-on-cash
- 13.31%
- DSCR
- 1.59
- GRM
- 5.0
CMA / ARV
- ARV (median comp)
- $102,722
- List price
- $84,990
- Delta
- -17.26%
- Verdict
- UNDERPRICED
- Comps
- 20 within 1.0 mi
Show comp detail 12 sales within ~0.75 mi
| Address | Dist | Beds/Ba | Sqft | Sold | Price | $/sf | Match |
|---|---|---|---|---|---|---|---|
| 9510 Olde Towne Row | 0.09mi | 2/1.5 | 1,110 (-3%) | 1mo | $115,000 | $104 | 87 |
| 9434 Olde Village Ct | 0.08mi | 2/1.5 | 1,110 (-3%) | 1mo | $126,900 | $114 | 87 |
| 9438 Olde Towne Row | 0.04mi | 2/2.5 | 1,140 (0%) | 15mo | $98,900 | $87 | 86 |
| 9483 Olde Towne Row | 0.06mi | 2/2.5 | 1,140 (0%) | 16mo | $130,000 | $114 | 84 |
| 9435 Olde Towne Row | 0.01mi | 2/2.5 | 1,140 (0%) | 19mo | $135,000 | $118 | 83 |
| 9499 Olde Village Ct | 0.07mi | 2/1.5 | 1,110 (-3%) | 10mo | $100,000 | $90 | 80 |
| 2261 Aspen Dr | 0.04mi | 2/2.5 | 1,140 (0%) | 23mo | $145,000 | $127 | 79 |
| 2240 Aspen Dr | 0.05mi | 2/1.5 | 1,110 (-3%) | 12mo | $125,000 | $113 | 79 |
| 2165 Aspen Dr | 0.15mi | 2/1.5 | 1,110 (-3%) | 8mo | $109,900 | $99 | 78 |
| 2131 Aspen Dr | 0.18mi | 2/1.5 | 1,110 (-3%) | 8mo | $138,000 | $124 | 76 |
| 2193 Aspen St | 0.12mi | 2/1.5 | 1,140 (0%) | 20mo | $115,000 | $101 | 74 |
| 2144 Aspen Dr | 0.18mi | 2/1.5 | 1,110 (-3%) | 17mo | $115,000 | $104 | 70 |
Match score weights: distance 35% · size 25% · config 20% · recency 20%. Top-matched comps best support the ARV.
Projected returns pro-forma
-3.0% appreciation · 0.0% rent growth · sell at horizon
- IRR
- -1.1%
- Equity multiple
- 0.96×
- Total profit
- $-942
- Equity at exit
- $12,672
- IRR
- 3.9%
- Equity multiple
- 1.23×
- Total profit
- $5,484
- Equity at exit
- $7,348
Cash invested: $23,797 (down + closing). Projections, not guarantees.
Landlord ↔ Tenant lean methodology
- Overall (STATE)
- 87 Strongly Landlord-Friendly
- State Texas
- 87 Strongly Landlord-Friendly · R+5
- County
- — inherits STATE
- City
- — inherits STATE
ZIP-level market 75227
- Home prices YoY
- -30.9%
- Rents YoY
- -0.4%
- Active inventory
- 181
- Price-to-rent
- 5.0×
Monthly cashflow live
- Estimated rent
- $1,422 high interval (Pro) →
- Mortgage (P&I)
- −$446
- Tax from tax record
- −$216 /mo · $2,597/yr
- Insurance
- −$35
- HOA
- −$162
- Vacancy / Maint / Mgmt
- −$299
- Net cashflow
- $264
Break-even live
Sensitivity live
| Price | -10% $312 | -5% $288 | +0% $264 | +5% $240 | +10% $216 |
|---|---|---|---|---|---|
| Rent | -10% $152 | -5% $208 | +0% $264 | +5% $320 | +10% $376 |
| Rate | -1.0pp $307 | -0.5pp $286 | base $264 | +0.5pp $242 | +1.0pp $219 |
UW: 25.0% down · 7.5% · 30yr · 1.5% tax · 5.0% vac · 8.0% maint · 8.0% mgmt
Financing live
Cash to close
- Down payment
- $21,248
- Closing costs
- $2,550
- Reserves months
- —
- Total cash needed
- —
Loan-product check · same deal, 3 products live
Conventional
25% down · 7.5% · 30yr
- Down + closing
- —
- Monthly P&I
- —
- Monthly cashflow
- —
- DSCR
- —
- Eligible?
- —
Personal DTI + credit; lowest rate.
DSCR
20% down · 8.5% · 30yr
- Down + closing
- —
- Monthly P&I
- —
- Monthly cashflow
- —
- DSCR
- —
- Eligible?
- —
No personal income docs; deal must DSCR.
Hard money
10% down · 12.0% · 12mo
- Down + closing
- —
- Monthly P&I
- —
- Monthly cashflow
- —
- DSCR
- —
- Eligible?
- —
Short-term bridge; refi at stabilization.
Rent comps 40 comps
| Address | Beds | Baths | Sqft | Rent | $/sqft | DOM | Units | Dist |
|---|---|---|---|---|---|---|---|---|
| 9467 Olde Towne Row Dallas, TX | 2.0 | 1.5 | 1110 | $975 | $0.88 | 45d | 1 | 0.06mi |
| 9503 Olde Towne Row Dallas, TX | 2.0 | 2.5 | 1140 | $1,350 | $1.18 | 45d | 1 | 0.09mi |
| 2198 Aspen Dr Dallas, TX | 2.0 | 1.5 | 1110 | $1,300 | $1.17 | 0d | 1 | 0.12mi |
| 2198 Aspen Dr Dallas, TX | 2.0 | 1.5 | 1110 | $1,300 | $1.17 | 5d | 1 | 0.12mi |
| 2194 Aspen Dr Dallas, TX | 2.0 | 1.5 | 1110 | $1,200 | $1.08 | 9d | 1 | 0.12mi |
| 9415 Bruton Rd Dallas, TX | 1.0–3.0 | 1.0–2.0 | 885 | $924 | $1.04 | 45d | 1 | 0.20mi |
| 1937 Red Cloud Dr Dallas, TX | 3.0 | 2.0 | 1196 | $1,695 | $1.42 | 45d | 1 | 0.55mi |
| 9645 Limestone Dr Dallas, TX | 3.0 | 2.0 | 1178 | $2,000 | $1.70 | 45d | 1 | 0.55mi |
| 9921 Cedar Mountain Cir Dallas, TX | 3.0 | 2.0 | 1202 | $1,895 | $1.58 | 45d | 1 | 0.61mi |
| 1939 Naira Dr Dallas, TX | 3.0 | 2.0 | 1415 | $1,850 | $1.31 | 45d | 1 | 0.68mi |
| 9666 Scyene Rd Dallas, TX | 1.0–2.0 | 1.0–2.0 | 753 | $1,286 | $1.71 | 0d | 20 | 0.70mi |
| 10216 Blackjack Oaks Dr Dallas, TX | 3.0 | 2.0 | 1453 | $1,860 | $1.28 | 0d | 1 | 0.77mi |
| 8840 Milverton Dr Dallas, TX | 3.0 | 1.5 | 1016 | $1,599 | $1.57 | 45d | 1 | 0.78mi |
| 10212 Hillhouse Ln Dallas, TX | 2.0 | 1.0 | 1183 | $1,499 | $1.27 | 9d | 1 | 0.79mi |
| 2255 Nantucket Village Dr Dallas, TX | 3.0 | 2.0 | 1037 | $1,625 | $1.57 | 45d | 1 | 0.79mi |
| 2041 New Haven Dr Dallas, TX | 3.0 | 1.5 | 1362 | $1,720 | $1.26 | 18d | 1 | 0.81mi |
| 10236 Hillhouse Ln Dallas, TX | 3.0 | 2.0 | 1323 | $1,600 | $1.21 | 45d | 1 | 0.83mi |
| 10320 Nantucket Village Ct Dallas, TX | 3.0 | 2.0 | 1037 | $1,645 | $1.59 | 45d | 1 | 0.88mi |
| 10315 Limestone Dr Dallas, TX | 2.0 | 2.0 | 1068 | $1,450 | $1.36 | 45d | 1 | 0.89mi |
| 9456 Culberson St Dallas, TX | 3.0 | 2.0 | 1170 | $1,800 | $1.54 | 45d | 1 | 0.90mi |
| 10340 Blackjack Oaks Dr Dallas, TX | 3.0 | 2.0 | 1182 | $1,650 | $1.40 | 0d | 1 | 0.91mi |
| 10328 Chelmsford Dr Dallas, TX | 3.0 | 1.0 | 1061 | $1,300 | $1.23 | 45d | 1 | 0.92mi |
| 10206 Shayna Dr Dallas, TX | 3.0 | 2.0 | 1253 | $1,850 | $1.48 | 15d | 1 | 0.93mi |
| 2315 Summit Ln Dallas, TX | 3.0 | 2.0 | 1200 | $1,800 | $1.50 | 9d | 1 | 0.95mi |
| 10348 Wood Heights Dr Dallas, TX | 3.0 | 2.5 | 1358 | $2,000 | $1.47 | 45d | 1 | 1.00mi |
| 8323 Lapanto Ln Unit B Dallas, TX | 3.0 | 1.5 | 968 | $1,375 | $1.42 | 45d | 1 | 1.00mi |
| 2708 Briarbank Cir Dallas, TX | 3.0 | 2.0 | 1349 | $1,840 | $1.36 | 4d | 1 | 1.00mi |
| 1705 Allentown Dr Dallas, TX | 3.0 | 2.0 | 1195 | $1,725 | $1.44 | 25d | 1 | 1.05mi |
| 9740 Stonewood Dr Dallas, TX | 3.0 | 2.0 | 1250 | $1,961 | $1.57 | 7d | 1 | 1.05mi |
| 8534 Bearden Ln Dallas, TX | 3.0 | 2.0 | 1332 | $1,600 | $1.20 | 25d | 1 | 1.05mi |
| 9575 Gonzales Dr Dallas, TX | 2.0 | 2.0 | 1259 | $1,450 | $1.15 | 15d | 1 | 1.05mi |
| 9911 Crystal Valley Way Dallas, TX | 3.0 | 2.0 | 1192 | $1,750 | $1.47 | 25d | 1 | 1.06mi |
| 2540 Winter Oak St Dallas, TX | 3.0 | 2.0 | 994 | $1,750 | $1.76 | 22d | 1 | 1.09mi |
| 10503 Leroy Ct Dallas, TX | 3.0 | 2.0 | 1253 | $1,941 | $1.55 | 9d | 1 | 1.09mi |
| 2603 Winter Oak St Dallas, TX | 3.0 | 2.0 | 1004 | $1,921 | $1.91 | 45d | 1 | 1.10mi |
| 10611 Woodleaf Dr Dallas, TX | 2.0 | 2.0 | 959 | $1,695 | $1.77 | 18d | 1 | 1.12mi |
| 10611 Woodleaf Dr Dallas, TX | 2.0 | 2.0 | 959 | $1,650 | $1.72 | 9d | 1 | 1.12mi |
| 10121 Muskogee Dr Dallas, TX | 3.0 | 2.0 | 1381 | $1,900 | $1.38 | 25d | 1 | 1.12mi |
| 2423 Lolita Dr Dallas, TX | 3.0 | 2.0 | 1040 | $1,650 | $1.59 | 4d | 1 | 1.19mi |
| 1415 Amity Ln Dallas, TX | 3.0 | 2.0 | 1364 | $1,780 | $1.30 | 45d | 1 | 1.35mi |
HOA detail
- Monthly dues
- $162 · $1,944/yr
Listing history 17 events
-
2026-06-21days on market $84,990 Active 83 DOM
-
2026-06-18days on market $84,990 Active 80 DOM
-
2026-06-17days on market $84,990 Active 79 DOM
-
2026-06-16days on market $84,990 Active 78 DOM
-
2026-06-15days on market $84,990 Active 77 DOM
-
2026-06-13days on market $84,990 Active 75 DOM
-
2026-06-09days on market $84,990 Active 71 DOM
-
2026-06-08days on market $84,990 Active 70 DOM
-
2026-06-07days on market $84,990 Active 69 DOM
-
2026-06-04days on market $84,990 Active 66 DOM
-
2026-06-03days on market $84,990 Active 65 DOM
-
2026-06-02days on market $84,990 Active 64 DOM
-
2026-06-01days on market $84,990 Active 63 DOM
-
2026-05-31days on market $84,990 Active 62 DOM
-
2026-03-30$90,000 Active 783-char remark
Show marketing remark (783 chars)
415 Olde Towne in Dallas, TX offers a great opportunity for buyers or investors. This property does need some updates, making it ideal for those looking to customize and add value. It features a newly installed backyard fence for added privacy and outdoor enjoyment, along with two dedicated parking spaces for convenience, the property benefits from convenient access to Dallas Area Rapid Transit (DART), providing direct connections to Downtown Dallas and surrounding employment hubs. With easy access to major highways, shopping, dining, and public transportation and walking distance to elementary school, this location supports both daily commuting and long-term investment potential. This townhome is a smart investment or a great place to create your own personalized space.
-
2001-09-27soldstatus
-
1986-07-07soldstatus
ⓘ Source: listings_history table (triggers on properties + properties_extension) + one-shot
backfill from property_details.listing_events for pre-trigger history.
Tax reassessment forecast TX · Resets to sale price
- Current annual tax
- $2,597 · $216/mo
- Projected year-2 tax
- $2,597 · $216/mo
- Expected delta
- $0/yr ($0/mo · 0.0%)
ⓘ Screening estimate from a state-policy table — verify with the county assessor before closing.
Climate risk First Street
- Flood 1/10 Low FEMA zone X (unshaded) · 0% chance over 30 yrs
- Wildfire 1/10 Low
- Heat 7/10 Severe 7 d/yr ≥110°F today · 24 d/yr by 30 yrs out
- Wind 6/10 Major 27% chance of damaging wind over 30 yrs
- Air quality 2/10 Low 2 unhealthy d/yr today · 2 by 30 yrs out
Nearby sold comps map
Loading sold comps map…
Walkable amenities ~0.75 mi
Loading nearby amenities…
Taxation est. · year 1
- Rental income
- $17,065
- − Mortgage interest
- −$4,761
- − Property taxes
- −$2,597
- − Insurance
- −$425
- − Repairs & maintenance
- −$1,365
- − Management
- −$1,365
- − HOA
- −$1,944
- − Depreciation
- −$2,472
- Taxable income
- $2,135
- Est. tax owed @ 24.0%
- −$512
- After-tax cash flow
- $2,654/yr
For passive investors: Depreciation is non-cash, so a rental often shows a tax loss while cash-flowing — sheltering income. Rental losses are passive: they offset passive income freely, and up to $25,000/yr can offset ordinary (W-2) income if you actively participate and your MAGI is under $100k (phasing out to $0 by $150k); unused losses carry forward. On sale, claimed depreciation is recaptured at up to 25%, and gains may owe capital-gains tax (a 1031 exchange can defer both). Figures are a year-1 estimate at your 24.0% rate — not tax advice; consult a CPA.
Schools (NCES district)
- District
- Dallas ISD
- NCES district ID
- 4816230
- Math proficiency
- 31% ▼ -16.00%
- Reading proficiency
- 36% ▼ -4.00%
- Median HH income
- $42,881
- Composite
- 28.41/100
- National rank
- #6763
- State rank
- #559 of 826 in TX
Livability — Dallas
- Score
- 81/100
- State rank
- #24
- US rank
- #1380
Category grades
Schools grade is shown separately in the Schools card above.
Census & demographics
- Census place
- Dallas, TX
- County
- Dallas County · 2,612,404 people
- City population
- 1,168,437
- Metro
- Dallas-Fort Worth-Arlington, TX
- Population (ZIP)
- 58,319
- Household income
- $64,008
- Rent vs Own
- Severe rent burden
- 1679.0
Population outlook (Dallas County) Hauer SSP2
- Today (2025)
- 2,979,839 people
- By 2030
- 3,191,823 · +7.1%
- By 2040
- 3,619,611 · +21.5%
- By 2050
- 4,026,915 · +35.1%
- By 2075
- 4,957,073 · +66.4%
- By 2100
- 5,508,725 · +84.9%
Race, ethnicity, and origin ACS 2023
- Neighborhood character
- Majority Hispanic (62%)
- Race & ethnicity
- Hispanic / Latino 62% Two or more races 35% Black 28% White 8%
- Hispanic origin (detail)
- Mexican 56%
- Foreign-born
- 27% · Canada, Vietnam
- Languages at home
- 44% English-only · Spanish 55%
Political lean MEDSL · Dallas
- 2024 margin
- Strong D (+22.2) · D 60.2% · R 38.0% · Other 1.8%
- 2008→2024 swing
- +6.9pp toward D · 2008: 15.3pp · 2024: 22.2pp
- All cycles
- 2024: D+22.2 2020: D+31.6 2016: D+26.2 2012: D+15.4 2008: D+15.3
Not yet ingested
- Civics
- —
Market trends
- HPI YoY
- ▼ -148.56%
- Current HPI
- 332.3303
- Rent YoY
- ▼ -0.36%
- Metro
- Dallas-Fort Worth-Arlington, TX
- State GDP YoY
- ▲ 3.95%
- F500 in state
- 110
Industry mix (Fortune 500 HQ in TX)
| Industry | F500 HQs | Revenue |
|---|---|---|
| Energy | 16 | $1,198B |
|
||
| Technology | 5 | $198B |
|
||
| Engineering / Construction | 4 | $72B |
|
||
| Energy Services | 3 | $60B |
|
||
| Utilities | 3 | $41B |
|
||
| Healthcare | 2 | $330B |
|
||
Price history
3 events — show timeline
- 2026-03-30 Listed $90,000 NTREIS
- 2001-09-27 Sold (Public Records) — Public Records
- 1986-07-07 Sold (Public Records) — Public Records
Property tax history
+9.7%/yrLatest (2025): $2,597 · +12.9% YoY. Source: county tax records.
Cash-flow waterfall
monthlySold comps — $/sqft
last 12 mo · ≤1 miLoading sold comps…