1306 N Raucon St · Roma, TX
Flood risk 8/10 · Major
- FEMA flood zone
- A
- Chance of flooding over 30 yrs
- 0.99%
- Est. flood insurance / yr
- $1,009 – $1,996
Fire risk 8/10 · Major
- Est. fire insurance / yr
- $1,222 – $2,270
Heat risk 9/10 · Severe
- Hot days now (above 113°F)
- 7 days/yr
- Hot days in 30 yrs
- 22 days/yr
Wind risk 8/10 · Major
- Chance of severe wind over 30 yrs
- 80.0%
Air-quality risk 1/10 · Minimal
- Unhealthy air days now
- 0 days/yr
- Unhealthy air days in 30 yrs
- 0 days/yr
Risk factors via First Street. Map © Google.
Why this score? — see what drove the B grade
The composite is a weighted blend of 9 inputs, each scored 0–100. Each bar is that input's sub-score; the figure is the points it added to the 100-point composite (weight × sub-score).
- Cash flow +30.0/30.0
- 1% rule +10.0/10.0
- DSCR +10.0/10.0
- ARV discount +7.5/15.0
- Appreciation +5.0/10.0
- Livability +3.2/5.0
- Schools +2.9/10.0
- Rent growth +2.5/5.0
- Condition / age +2.5/5.0
$60,000
🖨 Deal sheet 📄 Offer letter ✓ Due diligence
Listing remarks MLS
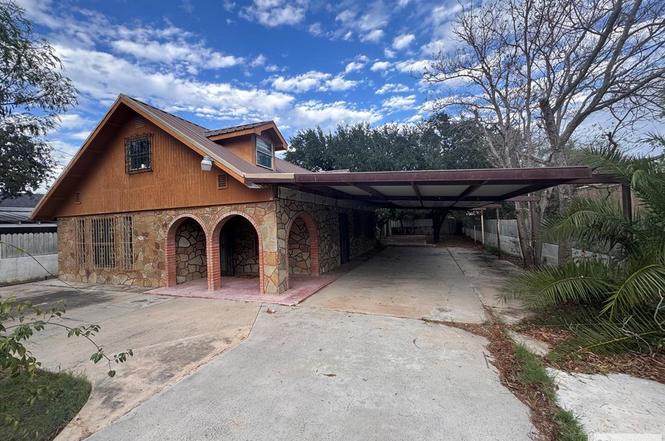
U. S. Department of HUD Opportunity! HUD homes are sold As Is. Case #514-272372. This property qualifies for the FHA $100 Down Program. Priority is given to Owner Occupants during the initial bid period. Home features a 3-bedroom, 2-bath, approximately 1,720 sq ft block home situated on a 7,200 sq ft lot, built in 1985. Additional improvements include a detached structure toward the rear, a carport accommodating 4+ vehicles, and a slab foundation. Visit HUDHomeStore. gov for disclosures, availability, and additional property information.
Key facts
- Slab foundation
- Detached structure
- 7,200 sq ft lot
Tags
Neighborhood map
What this means for you Summary
Snapshot
- This is a 3-bed/1.0-bath single-family listed at $60k.
Deal economics
- At list price, monthly cash flow is $568 ($7k/yr) — positive.
- The deal already cash-flows at list — no discount required.
- Meets the 1% rule at list price ($1k rent vs $60k).
- Recommended offer: $59k (1.5% below list) — sets the bar for market timing.
Location & tenants
- Location reads 63/100 on livability (#861 in TX) — a middle-class / working-renter tenant base. Strengths: cost of living A+, crime B+, housing B+; Watch: amenities F, commute F, employment F.
- Roma ISD (rural): math 30% / reading 42% proficiency, ranked #557 of 826 in TX (top 67%) — families likely to look elsewhere, expect single-tenant / working-renter base with shorter leases.
- Zoned schools: Roma Middle (math 17% / reading 22%, grade F, #1,445 of 1,662 statewide, top 88%, 779 students, 87% FRL); Roma H S (math 20% / reading 40%, grade F, #1,096 of 1,632 statewide, top 68%, 1,773 students, 80% FRL) — zoned schools average 83% FRL vs 46% district-wide (38 pts higher); higher-poverty schools than district average — tighter screening recommended.
- Market conditions: 78 active listings in the ZIP.
Forward outlook
- In year one you build about $2k of equity ($415 loan paydown + $2k appreciation (3.0% local appreciation)).
- Starr County population projected at +9% by 2050 — modest demand growth; plan on rents tracking national, not racing it.
- At projected returns (3.0% appreciation + 3.0% rent growth), your $17k cash investment doubles in ~2 years — after that, you're playing with house money.
Negotiation context
- It's been on market 30 days — a 2% lower offer ($59k) is reasonable based on typical stale-listing flexibility.
- 2 sale attempts with the ask held roughly flat each time — persistent listings suggest the price (not the market) is what's stuck; bring a comps-based counter.
Risks & watch-outs
- Watch-outs: flood insurance adds $125/mo.
- Climate carrying-cost: in FEMA flood zone A (mandatory federal flood insurance); severe wind risk, 80% chance of damaging wind over 30y; severe wildfire risk; extreme-heat days projected 7→22/yr by 2055 (HVAC capex compounding) — expect insurance premiums to compound above CPI over the hold.
Questions for the listing agent
- What's the actual annual flood-insurance premium (NFIP or private), and is the property in a SFHA with mandatory coverage?
- Is there a deadline driving the sale (1031 exchange, divorce, estate, relocation)? That informs how much negotiation room exists.
- Schools are D-rated, which usually means shorter tenancies and higher turnover. Who's the typical renter profile here, and what's been the actual vacancy rate?
- What's the average days-on-market for RENTAL listings here right now (not sales)? A rising rental-DOM trend means longer vacancies and softer asking-rent achievability than the comps imply.
- What's the recent tenant-quality profile in this submarket — average credit score on applications, eviction rate, late-payment / NSF rate, and stable-employment percentage? A property-management company in the area should have these aggregated.
- How much new for-sale + rental construction is in the pipeline within 1–3 miles? Heavy new supply typically softens prices + rents 12–24 months out; constrained supply supports both.
Investment metrics
- 1% rule
- 2.34% ✓
- Cap rate
- 20.16%
- Cash-on-cash
- 49.54%
- DSCR
- 3.20
- GRM
- 3.6
CMA / ARV
- ARV (on-the-fly)
- $164,952
- Comps found
- 3
Show comp detail 3 sales within ~0.75 mi
| Address | Dist | Beds/Ba | Sqft | Sold | Price | $/sf | Match |
|---|---|---|---|---|---|---|---|
| 1306 N Raucon St | 0.00mi | 3/2.0 | 1,720 (-9%) | 0mo | $60,000 | $35 | 80 |
| 1702 Garcia St | 0.27mi | 3/2.0 | 1,825 (-4%) | 24mo | $159,500 | $87 | 57 |
| 62 E Dolphin St | 0.58mi | 3/2.0 | 1,673 (-12%) | 19mo | $230,000 | $137 | 34 |
Match score weights: distance 35% · size 25% · config 20% · recency 20%. Top-matched comps best support the ARV.
Projected returns pro-forma
3.0% appreciation · 3.0% rent growth · sell at horizon
- IRR
- 46.1%
- Equity multiple
- 3.59×
- Total profit
- $43,527
- Equity at exit
- $26,979
- IRR
- 45.9%
- Equity multiple
- 7.21×
- Total profit
- $104,362
- Equity at exit
- $41,577
Cash invested: $16,800 (down + closing). Projections, not guarantees.
Landlord ↔ Tenant lean methodology
- Overall (STATE)
- 87 Strongly Landlord-Friendly
- State Texas
- 87 Strongly Landlord-Friendly · R+5
- County
- — inherits STATE
- City
- — inherits STATE
ZIP-level market 78584
- Active inventory
- 78
- Price-to-rent
- 3.6×
Monthly cashflow live
- Estimated rent
- $1,403 medium interval (Pro) →
- Mortgage (P&I)
- −$315
- Tax est. 1.5%
- −$75 /mo · $900/yr
- Insurance
- −$25
- Flood insurance flood zone
- −$125 /mo · $1,502/yr
- HOA
- −$0
- Vacancy / Maint / Mgmt
- −$295
- Net cashflow
- $568
Break-even live
UW: 25.0% down · 7.5% · 30yr · 1.5% tax · 5.0% vac · 8.0% maint · 8.0% mgmt
Financing live
Cash to close
- Down payment
- $15,000
- Closing costs
- $1,800
- Reserves months
- —
- Total cash needed
- —
Loan-product check · same deal, 3 products live
Conventional
25% down · 7.5% · 30yr
- Down + closing
- —
- Monthly P&I
- —
- Monthly cashflow
- —
- DSCR
- —
- Eligible?
- —
Personal DTI + credit; lowest rate.
DSCR
20% down · 8.5% · 30yr
- Down + closing
- —
- Monthly P&I
- —
- Monthly cashflow
- —
- DSCR
- —
- Eligible?
- —
No personal income docs; deal must DSCR.
Hard money
10% down · 12.0% · 12mo
- Down + closing
- —
- Monthly P&I
- —
- Monthly cashflow
- —
- DSCR
- —
- Eligible?
- —
Short-term bridge; refi at stabilization.
Listing history 6 events
-
2026-01-20status Pending 543-char remark
Show marketing remark (543 chars)
U. S. Department of HUD Opportunity! HUD homes are sold As Is. Case #514-272372. This property qualifies for the FHA $100 Down Program. Priority is given to Owner Occupants during the initial bid period. Home features a 3-bedroom, 2-bath, approximately 1,720 sq ft block home situated on a 7,200 sq ft lot, built in 1985. Additional improvements include a detached structure toward the rear, a carport accommodating 4+ vehicles, and a slab foundation. Visit HUDHomeStore. gov for disclosures, availability, and additional property information.
-
2026-01-16status Pending
-
2025-12-15$60,000 Active
-
2025-12-10$60,000 Active 543-char remark
Show marketing remark (543 chars)
U. S. Department of HUD Opportunity! HUD homes are sold As Is. Case #514-272372. This property qualifies for the FHA $100 Down Program. Priority is given to Owner Occupants during the initial bid period. Home features a 3-bedroom, 2-bath, approximately 1,720 sq ft block home situated on a 7,200 sq ft lot, built in 1985. Additional improvements include a detached structure toward the rear, a carport accommodating 4+ vehicles, and a slab foundation. Visit HUDHomeStore. gov for disclosures, availability, and additional property information.
-
2025-09-10soldstatus
-
2021-03-15soldstatus
ⓘ Source: listings_history table (triggers on properties + properties_extension) + one-shot
backfill from property_details.listing_events for pre-trigger history.
Climate risk First Street
- Flood 8/10 Severe FEMA zone A · 99% chance over 30 yrs
- Wildfire 8/10 Severe
- Heat 9/10 Extreme 7 d/yr ≥113°F today · 22 d/yr by 30 yrs out
- Wind 8/10 Severe 80% chance of damaging wind over 30 yrs
- Air quality 1/10 Low 0 unhealthy d/yr today · 0 by 30 yrs out
Nearby sold comps map
Loading sold comps map…
Walkable amenities ~0.75 mi
Loading nearby amenities…
Taxation est. · year 1
- Rental income
- $16,834
- − Mortgage interest
- −$3,361
- − Property taxes
- −$900
- − Insurance
- −$1,802
- − Repairs & maintenance
- −$1,347
- − Management
- −$1,347
- − Depreciation
- −$1,745
- Taxable income
- $6,332
- Est. tax owed @ 24.0%
- −$1,520
- After-tax cash flow
- $5,301/yr
For passive investors: Depreciation is non-cash, so a rental often shows a tax loss while cash-flowing — sheltering income. Rental losses are passive: they offset passive income freely, and up to $25,000/yr can offset ordinary (W-2) income if you actively participate and your MAGI is under $100k (phasing out to $0 by $150k); unused losses carry forward. On sale, claimed depreciation is recaptured at up to 25%, and gains may owe capital-gains tax (a 1031 exchange can defer both). Figures are a year-1 estimate at your 24.0% rate — not tax advice; consult a CPA.
Schools (NCES district)
- District
- Roma ISD
- NCES district ID
- 4837740
- Math proficiency
- 30% ▼ -31.00%
- Reading proficiency
- 42% ▼ -5.00%
- Median HH income
- $22,991
- Composite
- 28.55/100
- National rank
- #6731
- State rank
- #557 of 826 in TX
Livability — Roma
- Score
- 63/100
- State rank
- #861
- US rank
- #15502
Category grades
Schools grade is shown separately in the Schools card above.
Census & demographics
- Census place
- Roma, TX
- Population (ZIP)
- 17,823
Population outlook (Starr County) Hauer SSP2
- Today (2025)
- 67,298 people
- By 2030
- 68,782 · +2.2%
- By 2040
- 71,608 · +6.4%
- By 2050
- 73,585 · +9.3%
- By 2075
- 75,095 · +11.6%
- By 2100
- 67,730 · +0.6%
Race, ethnicity, and origin ACS 2023
- Neighborhood character
- Predominantly Hispanic (98%)
- Race & ethnicity
- Hispanic / Latino 98% Two or more races 46% White 2%
- Hispanic origin (detail)
- Mexican 93%
- Foreign-born
- 33% · Canada
- Languages at home
- 6% English-only · Spanish 94%
Political lean MEDSL · Starr
- 2024 margin
- R (+16.0) · D 41.8% · R 57.8%
- 2008→2024 swing
- -85.2pp toward R · 2008: 69.3pp · 2024: -16.0pp
- All cycles
- 2024: R+16.0 2020: D+5.0 2016: D+60.1 2012: D+73.4 2008: D+69.3
Not yet ingested
- Civics
- —
Market trends
- HPI YoY
- —
- Current HPI
- —
- Rent YoY
- —
- Metro
- —
- State GDP YoY
- ▲ 3.95%
- F500 in state
- 110
Industry mix (Fortune 500 HQ in TX)
| Industry | F500 HQs | Revenue |
|---|---|---|
| Energy | 16 | $1,198B |
|
||
| Technology | 5 | $198B |
|
||
| Engineering / Construction | 4 | $72B |
|
||
| Energy Services | 3 | $60B |
|
||
| Utilities | 3 | $41B |
|
||
| Healthcare | 2 | $330B |
|
||
Price history
+0.0% since first listed6 events — show timeline
- 2026-01-20 Pending — RGVMLS
- 2026-01-16 Pending — MCALLENMLS
- 2025-12-15 Listed $60,000 MCALLENMLS
- 2025-12-10 Listed $60,000 RGVMLS
- 2025-09-10 Sold (Public Records) — Public Records
- 2021-03-15 Sold (Public Records) — Public Records
Property tax history
+9.1%/yrLatest (2025): $3,605 · +29.5% YoY. Source: county tax records.
Cash-flow waterfall
monthlySold comps — $/sqft
last 12 mo · ≤1 miLoading sold comps…