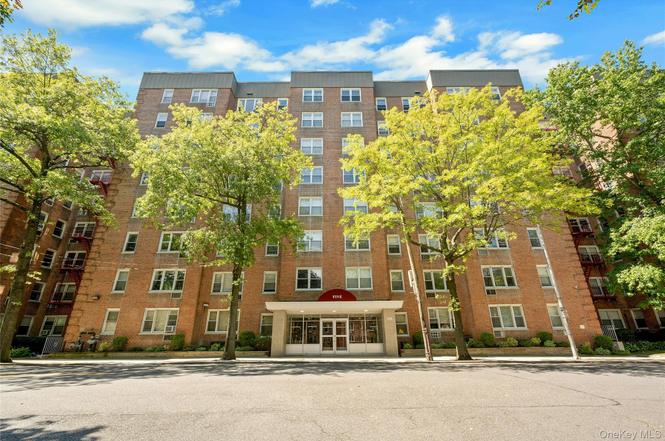
5 Sadore Ln Unit 3S · Yonkers, NY
Flood risk 1/10 · Minimal
- FEMA flood zone
- X (unshaded)
- Chance of flooding over 30 yrs
- 0.0%
- Est. flood insurance / yr
- $507 – $1,088
Fire risk 3/10 · Minor
- Est. fire insurance / yr
- $691 – $1,283
Heat risk 6/10 · Moderate
- Hot days now (above 99°F)
- 7 days/yr
- Hot days in 30 yrs
- 15 days/yr
Wind risk 6/10 · Moderate
- Chance of severe wind over 30 yrs
- 27.0%
Air-quality risk 4/10 · Minor
- Unhealthy air days now
- 3 days/yr
- Unhealthy air days in 30 yrs
- 5 days/yr
Risk factors via First Street. Map © Google.
Why this score? — see what drove the B- grade
The composite is a weighted blend of 9 inputs, each scored 0–100. Each bar is that input's sub-score; the figure is the points it added to the 100-point composite (weight × sub-score).
- Cash flow +30.0/30.0
- DSCR +10.0/10.0
- 1% rule +9.9/10.0
- ARV discount +7.5/15.0
- Schools +4.1/10.0
- Livability +3.4/5.0
- Rent growth +2.5/5.0
- Condition / age +2.5/5.0
- Appreciation +0.0/10.0
$160,000
🖨 Deal sheet 📄 Offer letter ✓ Due diligence
Listing remarks
Prime Commuter Location! * * A well-maintained unit yet a perfect blank slate, Unleash your creativity in this spacious one-bedroom unit ready for your personal touch. Enjoy exceptional amenities including on-site parking and a sparkling pool. * * Property Highlights: * * - * * Prime Location: * * Walking distance to shopping, high school, Central Avenue, Tuckahoe Rd. , and Carlo's Pizza. - * * Commuter's Dream: * * Just 30 minutes to NYC and a short drive to Metro North for a quick ride to Grand Central. - * * Affordable Living: * * Enjoy super affordable maintenance charges, making this an incredibly budget-friendly opportunity. - * * Terrific Building: * * E
Key facts
- Sought-after area
- On-site parking
- Parking
Tags
Neighborhood map
What this means for you Summary
Snapshot
- This is a 1-bed/1.0-bath condo listed at $160k.
Deal economics
- At list price, monthly cash flow is $781 ($9k/yr) — positive.
- The deal already cash-flows at list — no discount required.
- Meets the 1% rule at list price ($2k rent vs $160k).
- Recommended offer: $141k (12.0% below list) — sets the bar for market timing.
- Cap rate 12.1% vs local median 5.3% in Yonkers — top-decile yield for the area; either an underpriced asset or a hidden risk that comps aren't pricing in. Stress-test before assuming the spread holds.
Location & tenants
- Location reads 68/100 on livability (#528 in NY) — a middle-class / working-renter tenant base. Strengths: employment A, commute B; Watch: amenities F, cost of living F.
- Yonkers City School District (suburban): math 41% / reading 54% proficiency, ranked #413 of 590 in NY (top 70%) — families likely to look elsewhere, expect single-tenant / working-renter base with shorter leases; 64% free/reduced lunch — lower-income household profile, screen leases tightly.
- Zoned schools: Yonkers Early Childhood Academy (327 students, 72% FRL); Yonkers Middle School (math 17% / reading 37%, grade F, #587 of 729 statewide, top 81%, 601 students, 88% FRL); Roosevelt High School - Early College Studies (math 77% / reading 87%, grade A, #452 of 1,100 statewide, top 44%, 1,041 students, 85% FRL) — zoned schools average 82% FRL vs 64% district-wide (18 pts higher); higher-poverty schools than district average — tighter screening recommended.
- Market conditions: 163 active listings in the ZIP; 26 comparable units currently listed for rent nearby; rentals at typical pace (median 17d on market — plan ~3-4 weeks tenant-placement turnaround); solid renter incomes; 954 units permitted in Westchester County in 2024 (649 in 5+ unit buildings).
Forward outlook
- Local home prices are declining (-3.0%/yr); year-one equity from $1k of loan paydown is wiped out by about $5k of value loss. Plan a longer hold.
- Westchester County population projected at +10% by 2050 — modest demand growth; plan on rents tracking national, not racing it.
- At projected returns (-3.0% appreciation + 3.0% rent growth), your $45k cash investment doubles in ~6 years — after that, you're playing with house money.
Negotiation context
- It's been on market 126 days — a 12% lower offer ($141k) is reasonable based on typical stale-listing flexibility.
- 4 sale attempts; this cycle's ask has dropped $15k (9%) from the opening price — seller is motivated, your offer sets the floor, not the list.
Risks & watch-outs
- Watch-outs: built in 1958 — expect roof / HVAC / electrical / plumbing capex.
- Climate carrying-cost: major wind risk, 27% chance of damaging wind over 30y; extreme-heat days projected 7→15/yr by 2055 (HVAC capex compounding) — expect insurance premiums to compound above CPI over the hold.
Questions for the listing agent
- It's been on market 126 days. Have you received any prior offers? Is the seller open to a 12% concession, seller financing, or rate buy-down credit?
- Built in 1958 — when were the roof, HVAC, electrical panel, plumbing, and water heater last replaced?
- Any open or pending special assessments — roof, HVAC, plumbing, elevator, façade? What's the per-unit balance and payoff schedule, and is the seller paying it off at close or rolling it to the buyer?
- Why hasn't it sold? Are there any deal-killer items the seller is aware of (foundation, flood, title, zoning, code violations)?
- Is there a deadline driving the sale (1031 exchange, divorce, estate, relocation)? That informs how much negotiation room exists.
- What's the average days-on-market for RENTAL listings here right now (not sales)? A rising rental-DOM trend means longer vacancies and softer asking-rent achievability than the comps imply.
- What's the recent tenant-quality profile in this submarket — average credit score on applications, eviction rate, late-payment / NSF rate, and stable-employment percentage? A property-management company in the area should have these aggregated.
- How much new apartment / multifamily construction is in the pipeline within 1–3 miles? Heavy new supply (>2% of stock underway) typically softens rents 12–24 months out; light construction supports rent growth.
Investment metrics
- 1% rule
- 1.49% ✓
- Cap rate
- 12.15%
- Cash-on-cash
- 20.91%
- DSCR
- 1.93
- GRM
- 5.6
CMA / ARV
No comps found within radius.
Projected returns pro-forma
-3.0% appreciation · 3.0% rent growth · sell at horizon
- IRR
- 13.3%
- Equity multiple
- 1.53×
- Total profit
- $23,835
- Equity at exit
- $23,857
- IRR
- 22.2%
- Equity multiple
- 2.90×
- Total profit
- $84,932
- Equity at exit
- $13,834
Cash invested: $44,800 (down + closing). Projections, not guarantees.
Landlord ↔ Tenant lean methodology
- Overall (CITY)
- 5 Strongly Tenant-Friendly
- State New York
- 15 Strongly Tenant-Friendly · D+10
- County
- — inherits STATE
- City Yonkers
- 5 Strongly Tenant-Friendly · D+20
ZIP-level market 10710
- Active inventory
- 163
- Price-to-rent
- 5.6×
Monthly cashflow live
- Estimated rent
- $2,388 high interval (Pro) →
- Mortgage (P&I)
- −$839
- Tax est. 1.5%
- −$200 /mo · $2,400/yr
- Insurance
- −$67
- HOA
- −$0
- Vacancy / Maint / Mgmt
- −$501
- Net cashflow
- $781
Break-even live
UW: 25.0% down · 7.5% · 30yr · 1.5% tax · 5.0% vac · 8.0% maint · 8.0% mgmt
Financing live
Cash to close
- Down payment
- $40,000
- Closing costs
- $4,800
- Reserves months
- —
- Total cash needed
- —
Loan-product check · same deal, 3 products live
Conventional
25% down · 7.5% · 30yr
- Down + closing
- —
- Monthly P&I
- —
- Monthly cashflow
- —
- DSCR
- —
- Eligible?
- —
Personal DTI + credit; lowest rate.
DSCR
20% down · 8.5% · 30yr
- Down + closing
- —
- Monthly P&I
- —
- Monthly cashflow
- —
- DSCR
- —
- Eligible?
- —
No personal income docs; deal must DSCR.
Hard money
10% down · 12.0% · 12mo
- Down + closing
- —
- Monthly P&I
- —
- Monthly cashflow
- —
- DSCR
- —
- Eligible?
- —
Short-term bridge; refi at stabilization.
Rent comps 26 comps
| Address | Beds | Baths | Sqft | Rent | $/sqft | DOM | Units | Dist |
|---|---|---|---|---|---|---|---|---|
| 4 Sadore Ln Unit 2W Yonkers, NY | 1.0 | 1.0 | 800 | $2,000 | $2.50 | 17d | 1 | 0.09mi |
| 1549 Central Park Ave Yonkers, NY | 2.0 | 1.0 | 850 | $2,400 | $2.82 | 43d | 1 | 0.26mi |
| 12 Wainwright Ave Apt 1B Yonkers, NY | 1.0 | 1.0 | 700 | $1,950 | $2.79 | 43d | 1 | 0.29mi |
| 8 Wainwright Ave Unit 2A Yonkers, NY | — | 1.0 | 700 | $1,600 | $2.29 | 7d | 1 | 0.32mi |
| 717 Tuckahoe Rd Unit 16A Yonkers, NY | 1.0 | 1.0 | 650 | $2,495 | $3.84 | 4d | 1 | 0.35mi |
| 42 Winchester Ave Unit 2A Yonkers, NY | 1.0 | 1.0 | 700 | $2,100 | $3.00 | 13d | 1 | 0.43mi |
| 128 Colonial Pkwy Unit 3B Yonkers, NY | 1.0 | 1.0 | 871 | $2,750 | $3.16 | 43d | 1 | 0.63mi |
| 601 Ridge Hill Blvd Yonkers, NY | 2.0 | 1.0–2.0 | 819 | $3,500 | $4.27 | 7d | 14 | 0.79mi |
| 1 Elm St Unit 3B Tuckahoe, NY | 2.0 | 1.0 | 1100 | $3,200 | $2.91 | 7d | 1 | 0.81mi |
| 1 Elm St Unit 3B Tuckahoe, NY | 2.0 | 1.0 | 1100 | $3,200 | $2.91 | 10d | 1 | 0.81mi |
| 70 Roundhill Dr Yonkers, NY | 2.0 | 1.0 | 775 | $3,200 | $4.13 | 43d | 1 | 0.82mi |
| 21 Scarsdale Rd Yonkers, NY | 2.0 | 1.0 | 835 | $3,795 | $4.54 | 1d | 21 | 0.85mi |
| 28 Kenilworth Rd Unit The Cottage Yonkers, NY | 1.0 | 1.0 | 600 | $1,950 | $3.25 | 14d | 1 | 0.85mi |
| 111 Kensington Rd Unit 8 Bronxville, NY | 1.0 | 1.0 | 825 | $2,650 | $3.21 | 13d | 1 | 0.91mi |
| 64 Kensington Rd Apt 1A Bronxville, NY | 1.0 | 1.0 | 800 | $2,895 | $3.62 | 11d | 1 | 0.94mi |
| 64 Sagamore Rd Unit A6 Bronxville, NY | 1.0 | 1.0 | 850 | $2,900 | $3.41 | 4d | 1 | 1.03mi |
| 50 Columbus Ave Unit 817 Tuckahoe, NY | 1.0 | 1.0 | 750 | $3,000 | $4.00 | 22d | 1 | 1.07mi |
| 2 Consulate Dr Unit 1J Tuckahoe, NY | 1.0 | 1.0 | 750 | $2,700 | $3.60 | 11d | 1 | 1.11mi |
| 278 Mile Square Rd Yonkers, NY | 2.0 | 1.0 | 1000 | $2,650 | $2.65 | 43d | 1 | 1.12mi |
| 23 Belknap Ave Yonkers, NY | 1.0 | 1.0 | 700 | $2,300 | $3.29 | 24d | 1 | 1.14mi |
| 39 Maynard St Unit 2E Tuckahoe, NY | 2.0 | 1.0 | 875 | $2,650 | $3.03 | 43d | 1 | 1.14mi |
| 51 Parkway Rd Apt 3 Bronxville, NY | 1.0 | 1.0 | 1100 | $3,100 | $2.82 | 24d | 1 | 1.31mi |
| 300 Columbus Ave Tuckahoe, NY | — | 1.0 | 766 | $3,100 | $4.05 | 18d | 5 | 1.33mi |
| 212 Alpine Pl Tuckahoe, NY | 1.0 | 1.0 | 700 | $2,700 | $3.86 | 19d | 1 | 1.35mi |
| 40 Jackson Ave Eastchester, NY | 1.0 | 1.0 | 725 | $2,950 | $4.07 | 14d | 1 | 1.35mi |
| 47 Morgan St Eastchester, NY | 2.0 | 1.0 | 1000 | $4,000 | $4.00 | 43d | 1 | 1.43mi |
HOA detail condo
- Monthly dues
- $0 · $0/yr
- Likely covers
- pool
- Assessments
- None detected in remarks — confirm with the listing agent.
Listing history 12 events
-
2025-12-24status Pending
-
2025-09-10price $160,000
-
2025-08-18$175,000 Active
-
2025-08-15historical
-
2025-07-23status Active
-
2025-07-23historical
-
2025-07-22status Active
-
2025-05-13status Pending
-
2025-03-18price $159,999
-
2025-02-28price $163,999
-
2025-02-03price $169,999
-
2025-01-21$179,900 Active
ⓘ Source: listings_history table (triggers on properties + properties_extension) + one-shot
backfill from property_details.listing_events for pre-trigger history.
Climate risk First Street
- Flood 1/10 Low FEMA zone X (unshaded) · 0% chance over 30 yrs
- Wildfire 3/10 Moderate
- Heat 6/10 Major 7 d/yr ≥99°F today · 15 d/yr by 30 yrs out
- Wind 6/10 Major 27% chance of damaging wind over 30 yrs
- Air quality 4/10 Moderate 3 unhealthy d/yr today · 5 by 30 yrs out
Nearby sold comps map
Loading sold comps map…
Walkable amenities ~0.75 mi
Loading nearby amenities…
Taxation est. · year 1
- Rental income
- $28,655
- − Mortgage interest
- −$8,962
- − Property taxes
- −$2,400
- − Insurance
- −$800
- − Repairs & maintenance
- −$2,292
- − Management
- −$2,292
- − Depreciation
- −$4,655
- Taxable income
- $7,253
- Est. tax owed @ 24.0%
- −$1,741
- After-tax cash flow
- $7,628/yr
For passive investors: Depreciation is non-cash, so a rental often shows a tax loss while cash-flowing — sheltering income. Rental losses are passive: they offset passive income freely, and up to $25,000/yr can offset ordinary (W-2) income if you actively participate and your MAGI is under $100k (phasing out to $0 by $150k); unused losses carry forward. On sale, claimed depreciation is recaptured at up to 25%, and gains may owe capital-gains tax (a 1031 exchange can defer both). Figures are a year-1 estimate at your 24.0% rate — not tax advice; consult a CPA.
Schools (NCES district)
- District
- Yonkers City School District
- NCES district ID
- 3631920
- Math proficiency
- 41% ▼ -1.00%
- Reading proficiency
- 54% ▲ 14.00%
- Median HH income
- $58,042
- Composite
- 41.43/100
- National rank
- #3471
- State rank
- #413 of 590 in NY
Livability — Yonkers
- Score
- 68/100
- State rank
- #528
- US rank
- #9394
Category grades
Schools grade is shown separately in the Schools card above.
Census & demographics
- Census place
- Yonkers, NY
- County
- Westchester County · 709,332 people
- City population
- 212,407
- Metro
- New York-Newark-Jersey City, NY-NJ-PA
- Population (ZIP)
- 25,855
- Household income
- $108,845
- Rent vs Own
- Severe rent burden
- 920.0
Population outlook (Westchester County) Hauer SSP2
- Today (2025)
- 1,028,035 people
- By 2030
- 1,051,636 · +2.3%
- By 2040
- 1,098,520 · +6.9%
- By 2050
- 1,136,044 · +10.5%
- By 2075
- 1,196,925 · +16.4%
- By 2100
- 1,175,147 · +14.3%
Race, ethnicity, and origin ACS 2023
- Neighborhood character
- Highly diverse neighborhood (Simpson 0.72)
- Race & ethnicity
- White 39% Hispanic / Latino 30% Black 14% Two or more races 12% Asian 11% Native American 2%
- Hispanic origin (detail)
- Mexican 1% Puerto Rican 9% Dominican 9%
- Common ancestry
- Romanian 2% Scotch-Irish 1% Hispanic 1%
- Foreign-born
- 26% · Canada, Jamaica, China
- Languages at home
- 64% English-only · Spanish 18% Other Indo-European 6% Other Asian/Pacific 5%
Political lean MEDSL · Westchester
- 2024 margin
- Strong D (+26.3) · D 63.1% · R 36.9%
- 2008→2024 swing
- -1.3pp toward R · 2008: 27.6pp · 2024: 26.3pp
- All cycles
- 2024: D+26.3 2020: D+36.3 2016: D+32.8 2012: D+22.2 2008: D+27.6
Not yet ingested
- Civics
- —
Market trends
- HPI YoY
- ▼ -622.30%
- Current HPI
- 297.1704
- Rent YoY
- —
- Metro
- New York-Newark-Jersey City, NY-NJ-PA
- State GDP YoY
- ▲ 2.60%
- F500 in state
- 92
Industry mix (Fortune 500 HQ in NY)
| Industry | F500 HQs | Revenue |
|---|---|---|
| Financial Services | 10 | $950B |
|
||
| Consumer Goods | 9 | $162B |
|
||
| Insurance | 4 | $225B |
|
||
| Telecommunications | 2 | $144B |
|
||
| Pharmaceuticals | 2 | $112B |
|
||
| Media / Entertainment | 2 | $69B |
|
||
Price history
-11.1% since first listed12 events — show timeline
- 2025-12-24 Pending — OneKey® MLS as Distributed by MLS Grid
- 2025-09-10 Price Changed $160,000 OneKey® MLS as Distributed by MLS Grid
- 2025-08-18 Listed $175,000 OneKey® MLS as Distributed by MLS Grid
- 2025-08-15 Listing Removed — OneKey® MLS as Distributed by MLS Grid
- 2025-07-23 Relisted — OneKey® MLS as Distributed by MLS Grid
- 2025-07-23 Listing Removed — OneKey® MLS as Distributed by MLS Grid
- 2025-07-22 Relisted — OneKey® MLS as Distributed by MLS Grid
- 2025-05-13 Pending — OneKey® MLS as Distributed by MLS Grid
- 2025-03-18 Price Changed $159,999 OneKey® MLS as Distributed by MLS Grid
- 2025-02-28 Price Changed $163,999 OneKey® MLS as Distributed by MLS Grid
- 2025-02-03 Price Changed $169,999 OneKey® MLS as Distributed by MLS Grid
- 2025-01-21 Listed $179,900 OneKey® MLS as Distributed by MLS Grid
Cash-flow waterfall
monthlySold comps — $/sqft
last 12 mo · ≤1 miLoading sold comps…