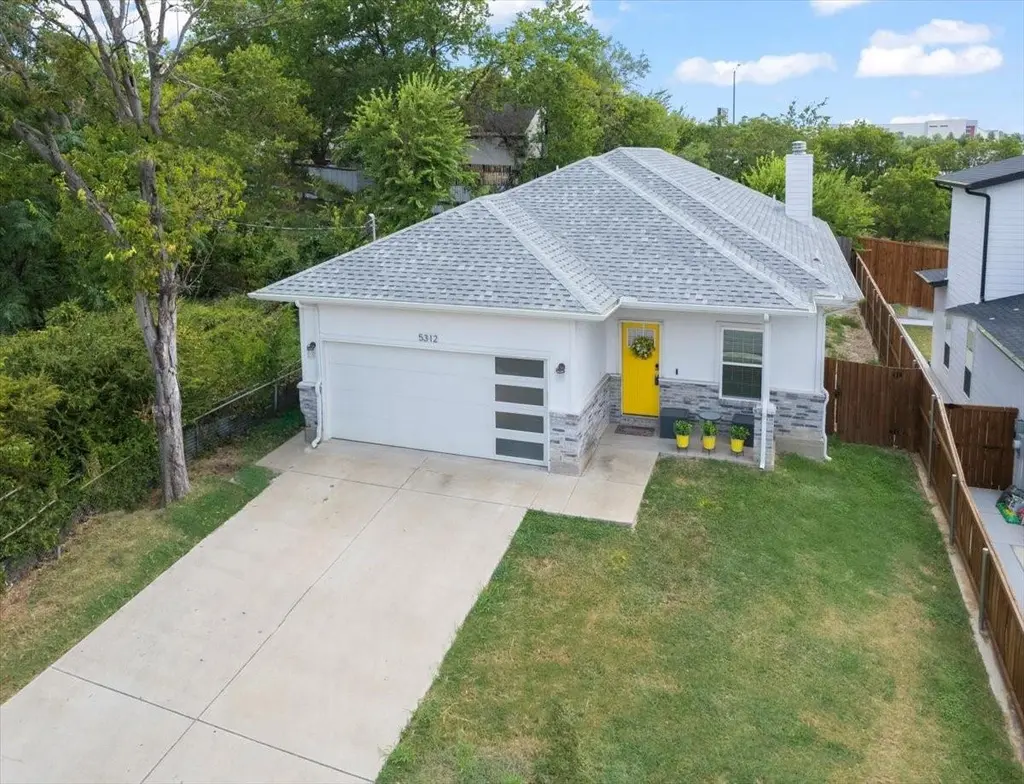
5312 Black Hawk St · Dallas, TX
Flood risk 1/10 · Minimal
- FEMA flood zone
- X (unshaded)
- Chance of flooding over 30 yrs
- 0.0%
- Est. flood insurance / yr
- $507 – $1,088
Fire risk 1/10 · Minimal
- Est. fire insurance / yr
- $1,222 – $2,270
Heat risk 7/10 · Major
- Hot days now (above 109°F)
- 7 days/yr
- Hot days in 30 yrs
- 23 days/yr
Wind risk 6/10 · Moderate
- Chance of severe wind over 30 yrs
- 27.0%
Air-quality risk 3/10 · Minor
- Unhealthy air days now
- 3 days/yr
- Unhealthy air days in 30 yrs
- 4 days/yr
Risk factors via First Street. Map © Google.
Why this score? — see what drove the D- grade
The composite is a weighted blend of 9 inputs, each scored 0–100. Each bar is that input's sub-score; the figure is the points it added to the 100-point composite (weight × sub-score).
- Appreciation +10.0/10.0
- ARV discount +7.5/15.0
- Cash flow +7.2/30.0
- Livability +4.0/5.0
- Schools +2.8/10.0
- 1% rule +2.6/10.0
- Condition / age +2.5/5.0
- DSCR +1.4/10.0
- Rent growth +1.4/5.0
$317,500
🖨 Deal sheet (PDF) 📄 Offer letter ✓ Due diligence
Listing remarks MLS
Imagine enjoying. a nice dinner in Downtown Dallas, heading West to a community of new and newer homes, modern, peaceful and best of all 11 minutes away. You are greeted with a 4BR, 2BA Dallas home where modern design meets everyday comfort. The open layout highlights stylish finishes and natural light throughout, while a unique hidden office—accessible through the garage—offers the perfect private workspace or retreat. With its unbeatable combination of location, price, and features, this home is an exceptional find for today’s market. Homes of this value, in this area to do not come to market everyday.
Key facts
- Natural light
- Open layout
- Hidden office
Tags
Neighborhood map
What this means for you Summary
Snapshot
- This is a 4-bed/2.0-bath single-family listed at $318k.
Deal economics
- At list price, monthly cash flow is $-434 ($-5k/yr) — negative.
- To cash-flow at today's rent, offer at most $241k (24.2% below list).
- To meet the 1% rule (rent ≥ 1% of price), the offer needs to be $242k (23.8% below list).
- Recommended offer: $241k (24.2% below list) — sets the bar for cash-flow.
- Cap rate 4.7% vs local median 2.3% in Dallas — top-decile yield for the area; either an underpriced asset or a hidden risk that comps aren't pricing in. Stress-test before assuming the spread holds.
Location & tenants
- Location reads 81/100 on livability (#24 in TX, #1,380 nationally) — a professional / high-income tenant draw. Strengths: amenities A+, commute A+, housing A+; Watch: crime F.
- Dallas ISD (urban): math 31% / reading 36% proficiency, ranked #559 of 826 in TX (top 68%) — families likely to look elsewhere, expect single-tenant / working-renter base with shorter leases; 83% free/reduced lunch — lower-income household profile, screen leases tightly.
- Zoned schools: Eladio R Martinez Learning Center (math 25% / reading 21%, grade F, #3,277 of 4,322 statewide, top 77%, 536 students, 97% FRL); D A Hulcy Steam Middle (math 33% / reading 32%, grade F, #947 of 1,662 statewide, top 58%, 423 students, 88% FRL); L G Pinkston H S (math 10% / reading 21%, grade F, #1,505 of 1,632 statewide, top 92%, 1,139 students, 92% FRL).
- Market conditions: Rents falling (-4.2%/yr); 249 active listings in the ZIP; 4 comparable units currently listed for rent nearby; rentals leasing fast (median 1d on market — plan ~1-2 weeks tenant-placement turnaround); 12,577 units permitted in Dallas County in 2024 (6,829 in 5+ unit buildings).
- At $2,420/mo this rent would consume 49% of the median local household income ($60k/yr) (locally 892% of renters already pay >50% of income on rent) — very limited rent-growth headroom before tenants either downsize or default.
Forward outlook
- In year one you build about $34k of equity ($2k loan paydown + $32k appreciation (10.0% local appreciation)).
- Dallas County population projected at +35% by 2050 — long-run rental-demand tailwind backs the buy-and-hold thesis.
- By year 2, paydown + projected appreciation supports a ~$55k cash-out refi (75% LTV) — recoverable capital for the next deal without selling this one.
Negotiation context
- It's been on market 275 days — a 12% lower offer ($279k) is reasonable based on typical stale-listing flexibility.
- 8 sale attempts since 8y ago with the ask held roughly flat each time — persistent listings suggest the price (not the market) is what's stuck; bring a comps-based counter.
Risks & watch-outs
- Climate carrying-cost: major wind risk, 27% chance of damaging wind over 30y; extreme-heat days projected 7→23/yr by 2055 (HVAC capex compounding) — expect insurance premiums to compound above CPI over the hold.
Questions for the listing agent
- What do current leases actually rent for vs. the listed asking? Can we see a recent rent roll and the last 12 months of T-12 income?
- It's been on market 275 days. Have you received any prior offers? Is the seller open to a 24% concession, seller financing, or rate buy-down credit?
- Why hasn't it sold? Are there any deal-killer items the seller is aware of (foundation, flood, title, zoning, code violations)?
- Is there a deadline driving the sale (1031 exchange, divorce, estate, relocation)? That informs how much negotiation room exists.
- Crime grade is F in this area — have there been break-ins, vandalism, or insurance claims at this property in the last 3 years? What carrier currently insures it and at what premium?
- The area grade is low — what's the realistic commute time and amenity access for the typical tenant pool here? Any planned neighborhood developments (good or bad) we should know about?
- What's the average days-on-market for RENTAL listings here right now (not sales)? A rising rental-DOM trend means longer vacancies and softer asking-rent achievability than the comps imply.
- What's the recent tenant-quality profile in this submarket — average credit score on applications, eviction rate, late-payment / NSF rate, and stable-employment percentage? A property-management company in the area should have these aggregated.
- How much new for-sale + rental construction is in the pipeline within 1–3 miles? Heavy new supply typically softens prices + rents 12–24 months out; constrained supply supports both.
Investment metrics
- 1% rule
- 0.76% ✗
- Cap rate
- 4.65%
- Cash-on-cash
- -5.86%
- DSCR
- 0.74
- GRM
- 10.9
CMA / ARV
- ARV (median comp)
- $317,551
- List price
- $317,500
- Delta
- -0.02%
- Verdict
- FAIR
- Comps
- 20 within 1.0 mi
Show comp detail 5 sales within ~0.75 mi
| Address | Dist | Beds/Ba | Sqft | Sold | Price | $/sf | Match |
|---|---|---|---|---|---|---|---|
| 5308 Chippewa Dr | 0.07mi | 4/2.5 | 1,658 (-0%) | 5mo | $459,000 | $277 | 90 |
| 2411 Clymer St | 0.36mi | 4/2.0 | 1,520 (-9%) | 9mo | $325,000 | $214 | 62 |
| 2615 Ingersoll | 0.56mi | 3/2.0 (-1) | 1,500 (-10%) | 6mo | $330,000 | $220 | 48 |
| 2537 Kenesaw Dr | 0.49mi | 4/2.0 | 1,882 (+13%) | 18mo | $450,000 | $239 | 40 |
| 2820 Lapsley St | 0.72mi | 3/2.5 (-1) | 1,818 (+9%) | 14mo | $369,900 | $203 | 32 |
Match score weights: distance 35% · size 25% · config 20% · recency 20%. Top-matched comps best support the ARV.
Projected returns pro-forma
10.0% appreciation · 0.0% rent growth · sell at horizon
- IRR
- 19.3%
- Equity multiple
- 2.56×
- Total profit
- $138,294
- Equity at exit
- $286,029
- IRR
- 17.2%
- Equity multiple
- 5.69×
- Total profit
- $416,564
- Equity at exit
- $616,833
Cash invested: $88,900 (down + closing). Projections, not guarantees.
Landlord ↔ Tenant lean methodology
- Overall (STATE)
- 87 Strongly Landlord-Friendly
- State Texas
- 87 Strongly Landlord-Friendly · R+5
- County
- — inherits STATE
- City
- — inherits STATE
ZIP-level market 75212
- Rents YoY
- -4.2%
- Active inventory
- 249
- Price-to-rent
- 10.9×
Monthly cashflow live
- Estimated rent
- $2,420 medium interval (Pro) →
- Mortgage (P&I)
- −$1,665
- Tax from tax record
- −$549 /mo · $6,589/yr
- Insurance
- −$132
- HOA
- −$0
- Vacancy / Maint / Mgmt
- −$508
- Net cashflow
- $-434
Break-even live
Sensitivity live
| Price | -10% $-255 | -5% $-344 | +0% $-434 | +5% $-524 | +10% $-614 |
|---|---|---|---|---|---|
| Rent | -10% $-626 | -5% $-530 | +0% $-434 | +5% $-339 | +10% $-243 |
| Rate | -1.0pp $-274 | -0.5pp $-354 | base $-434 | +0.5pp $-517 | +1.0pp $-600 |
UW: 25.0% down · 7.5% · 30yr · 1.5% tax · 5.0% vac · 8.0% maint · 8.0% mgmt
Financing live
Cash to close
- Down payment
- $79,375
- Closing costs
- $9,525
- Reserves months
- —
- Total cash needed
- —
Loan-product check · same deal, 3 products live
Conventional
25% down · 7.5% · 30yr
- Down + closing
- —
- Monthly P&I
- —
- Monthly cashflow
- —
- DSCR
- —
- Eligible?
- —
Personal DTI + credit; lowest rate.
DSCR
20% down · 8.5% · 30yr
- Down + closing
- —
- Monthly P&I
- —
- Monthly cashflow
- —
- DSCR
- —
- Eligible?
- —
No personal income docs; deal must DSCR.
Hard money
10% down · 12.0% · 12mo
- Down + closing
- —
- Monthly P&I
- —
- Monthly cashflow
- —
- DSCR
- —
- Eligible?
- —
Short-term bridge; refi at stabilization.
Rent comps 4 comps
| Address | Beds | Baths | Sqft | Rent | $/sqft | DOM | Units | Dist |
|---|---|---|---|---|---|---|---|---|
| 2518 Kenesaw Dr Dallas, TX | 4.0 | 3.0 | 1878 | $2,600 | $1.38 | 20d | 1 | 0.46mi |
| 4599 W Davis St Dallas, TX | 1.0–3.0 | 1.0–2.0 | 930 | $1,785 | $1.92 | 0d | 50 | 1.11mi |
| 1210 N Cockrell Hill Rd Dallas, TX | 3.0 | 1.0–2.0 | 908 | $2,355 | $2.59 | 0d | 24 | 1.18mi |
| 1310 N Cockrell Hill Rd Dallas, TX | 3.0 | 1.0–2.0 | 875 | $2,357 | $2.69 | 0d | 36 | 1.18mi |
Listing history 30 events
-
2026-06-21days on market $317,500 Active 275 DOM
-
2026-06-18days on market $317,500 Active 272 DOM
-
2026-06-17days on market $317,500 Active 271 DOM
-
2026-06-16days on market $317,500 Active 270 DOM
-
2026-06-15days on market $317,500 Active 269 DOM
-
2026-06-13days on market $317,500 Active 267 DOM
-
2026-06-09days on market $317,500 Active 263 DOM
-
2026-06-08days on market $317,500 Active 262 DOM
-
2026-06-07days on market $317,500 Active 261 DOM
-
2026-06-04pricedays on market $317,500 Active 258 DOM
-
2026-06-03days on market $320,000 Active 257 DOM
-
2026-06-02days on market $320,000 Active 256 DOM
-
2026-06-02days on market $320,000 Active 255 DOM
-
2026-05-31days on market $320,000 Active 254 DOM
-
2026-04-17historical
-
2025-12-19status Active 629-char remark
Show marketing remark (629 chars)
Imagine enjoying. a nice dinner in Downtown Dallas, heading West to a community of new and newer homes, modern, peaceful and best of all 11 minutes away. You are greeted with a 4BR, 2BA Dallas home where modern design meets everyday comfort. The open layout highlights stylish finishes and natural light throughout, while a unique hidden office—accessible through the garage—offers the perfect private workspace or retreat. With its unbeatable combination of location, price, and features, this home is an exceptional find for today’s market. Homes of this value, in this area to do not come to market everyday.
-
2025-12-10historical Active Option Contract 629-char remark
Show marketing remark (629 chars)
Imagine enjoying. a nice dinner in Downtown Dallas, heading West to a community of new and newer homes, modern, peaceful and best of all 11 minutes away. You are greeted with a 4BR, 2BA Dallas home where modern design meets everyday comfort. The open layout highlights stylish finishes and natural light throughout, while a unique hidden office—accessible through the garage—offers the perfect private workspace or retreat. With its unbeatable combination of location, price, and features, this home is an exceptional find for today’s market. Homes of this value, in this area to do not come to market everyday.
-
2025-09-19$320,000 Active
Show marketing remark (629 chars)
Imagine enjoying. a nice dinner in Downtown Dallas, heading West to a community of new and newer homes, modern, peaceful and best of all 11 minutes away. You are greeted with a 4BR, 2BA Dallas home where modern design meets everyday comfort. The open layout highlights stylish finishes and natural light throughout, while a unique hidden office—accessible through the garage—offers the perfect private workspace or retreat. With its unbeatable combination of location, price, and features, this home is an exceptional find for today’s market. Homes of this value, in this area to do not come to market everyday.
-
2025-09-19$320,000 Active 629-char remark
Show marketing remark (629 chars)
Imagine enjoying. a nice dinner in Downtown Dallas, heading West to a community of new and newer homes, modern, peaceful and best of all 11 minutes away. You are greeted with a 4BR, 2BA Dallas home where modern design meets everyday comfort. The open layout highlights stylish finishes and natural light throughout, while a unique hidden office—accessible through the garage—offers the perfect private workspace or retreat. With its unbeatable combination of location, price, and features, this home is an exceptional find for today’s market. Homes of this value, in this area to do not come to market everyday.
-
2025-09-19$320,000 Active
Show marketing remark (629 chars)
Imagine enjoying. a nice dinner in Downtown Dallas, heading West to a community of new and newer homes, modern, peaceful and best of all 11 minutes away. You are greeted with a 4BR, 2BA Dallas home where modern design meets everyday comfort. The open layout highlights stylish finishes and natural light throughout, while a unique hidden office—accessible through the garage—offers the perfect private workspace or retreat. With its unbeatable combination of location, price, and features, this home is an exceptional find for today’s market. Homes of this value, in this area to do not come to market everyday.
-
2023-11-13soldstatus
-
2021-01-19historical Active Option Contract
-
2021-01-13historical
-
2021-01-01$259,900 Active
-
2020-12-31historical
-
2020-09-01$259,900 Active
-
2019-08-31historical
-
2018-09-28$259,990 Active
-
2018-06-14soldstatus
ⓘ Source: listings_history table (triggers on properties + properties_extension) + one-shot
backfill from property_details.listing_events for pre-trigger history.
Tax reassessment forecast TX · Resets to sale price
- Current annual tax
- $6,589 · $549/mo
- Projected year-2 tax
- $6,589 · $549/mo
- Expected delta
- $0/yr ($0/mo · 0.0%)
ⓘ Screening estimate from a state-policy table — verify with the county assessor before closing.
Climate risk First Street
- Flood 1/10 Low FEMA zone X (unshaded) · 0% chance over 30 yrs
- Wildfire 1/10 Low
- Heat 7/10 Severe 7 d/yr ≥109°F today · 23 d/yr by 30 yrs out
- Wind 6/10 Major 27% chance of damaging wind over 30 yrs
- Air quality 3/10 Moderate 3 unhealthy d/yr today · 4 by 30 yrs out
Nearby sold comps map
Loading sold comps map…
Walkable amenities ~0.75 mi
Loading nearby amenities…
Taxation est. · year 1
- Rental income
- $29,043
- − Mortgage interest
- −$17,785
- − Property taxes
- −$6,589
- − Insurance
- −$1,588
- − Repairs & maintenance
- −$2,323
- − Management
- −$2,323
- − Depreciation
- −$9,236
- Taxable loss
- −$10,801
- Est. tax savings @ 24.0%
- +$2,592
- After-tax cash flow
- $-2,620/yr
For passive investors: Depreciation is non-cash, so a rental often shows a tax loss while cash-flowing — sheltering income. Rental losses are passive: they offset passive income freely, and up to $25,000/yr can offset ordinary (W-2) income if you actively participate and your MAGI is under $100k (phasing out to $0 by $150k); unused losses carry forward. On sale, claimed depreciation is recaptured at up to 25%, and gains may owe capital-gains tax (a 1031 exchange can defer both). Figures are a year-1 estimate at your 24.0% rate — not tax advice; consult a CPA.
Schools (NCES district)
- District
- Dallas ISD
- NCES district ID
- 4816230
- Math proficiency
- 31% ▼ -16.00%
- Reading proficiency
- 36% ▼ -4.00%
- Median HH income
- $42,881
- Composite
- 28.41/100
- National rank
- #6763
- State rank
- #559 of 826 in TX
Livability — Dallas
- Score
- 81/100
- State rank
- #24
- US rank
- #1380
Category grades
Schools grade is shown separately in the Schools card above.
Census & demographics
- Census place
- Dallas, TX
- County
- Dallas County · 2,612,404 people
- City population
- 1,168,437
- Metro
- Dallas-Fort Worth-Arlington, TX
- Population (ZIP)
- 28,259
- Household income
- $59,750
- Rent vs Own
- Severe rent burden
- 892.0
Population outlook (Dallas County) Hauer SSP2
- Today (2025)
- 2,979,839 people
- By 2030
- 3,191,823 · +7.1%
- By 2040
- 3,619,611 · +21.5%
- By 2050
- 4,026,915 · +35.1%
- By 2075
- 4,957,073 · +66.4%
- By 2100
- 5,508,725 · +84.9%
Race, ethnicity, and origin ACS 2023
- Neighborhood character
- Predominantly Hispanic (67%)
- Race & ethnicity
- Hispanic / Latino 67% Two or more races 26% Black 23% White 6% Asian 2%
- Hispanic origin (detail)
- Mexican 55%
- Common ancestry
- Slovak 1%
- Foreign-born
- 27% · Canada, Vietnam, Jamaica
- Languages at home
- 42% English-only · Spanish 52% Vietnamese 1%
Political lean MEDSL · Dallas
- 2024 margin
- Strong D (+22.2) · D 60.2% · R 38.0% · Other 1.8%
- 2008→2024 swing
- +6.9pp toward D · 2008: 15.3pp · 2024: 22.2pp
- All cycles
- 2024: D+22.2 2020: D+31.6 2016: D+26.2 2012: D+15.4 2008: D+15.3
Not yet ingested
- Civics
- —
Market trends
- HPI YoY
- ▲ 138.69%
- Current HPI
- 477.2035
- Rent YoY
- ▼ -4.21%
- Metro
- Dallas-Fort Worth-Arlington, TX
- State GDP YoY
- ▲ 3.95%
- F500 in state
- 110
Industry mix (Fortune 500 HQ in TX)
| Industry | F500 HQs | Revenue |
|---|---|---|
| Energy | 16 | $1,198B |
|
||
| Technology | 5 | $198B |
|
||
| Engineering / Construction | 4 | $72B |
|
||
| Energy Services | 3 | $60B |
|
||
| Utilities | 3 | $41B |
|
||
| Healthcare | 2 | $330B |
|
||
Price history
+23.1% since first listed16 events — show timeline
- 2026-04-17 Listing Removed — HARMLS
- 2025-12-19 Relisted — NTREIS
- 2025-12-10 Contingent — NTREIS
- 2025-09-19 Listed $320,000 Unlock MLS
- 2025-09-19 Listed $320,000 CTXMLS
- 2025-09-19 Listed $320,000 NTREIS
- 2025-09-19 Listed $320,000 HARMLS
- 2023-11-13 Sold (Public Records) — Public Records
- 2021-01-19 Contingent — NTREIS
- 2021-01-13 Listing Removed — NTREIS
- 2021-01-01 Listed $259,900 NTREIS
- 2020-12-31 Listing Removed — NTREIS
- 2020-09-01 Listed $259,900 NTREIS
- 2019-08-31 Listing Removed — NTREIS
- 2018-09-28 Listed $259,990 NTREIS
- 2018-06-14 Sold (Public Records) — Public Records
Property tax history
+30.4%/yrLatest (2025): $6,589 · -0.4% YoY. Source: county tax records.
Cash-flow waterfall
monthlySold comps — $/sqft
last 12 mo · ≤1 miLoading sold comps…