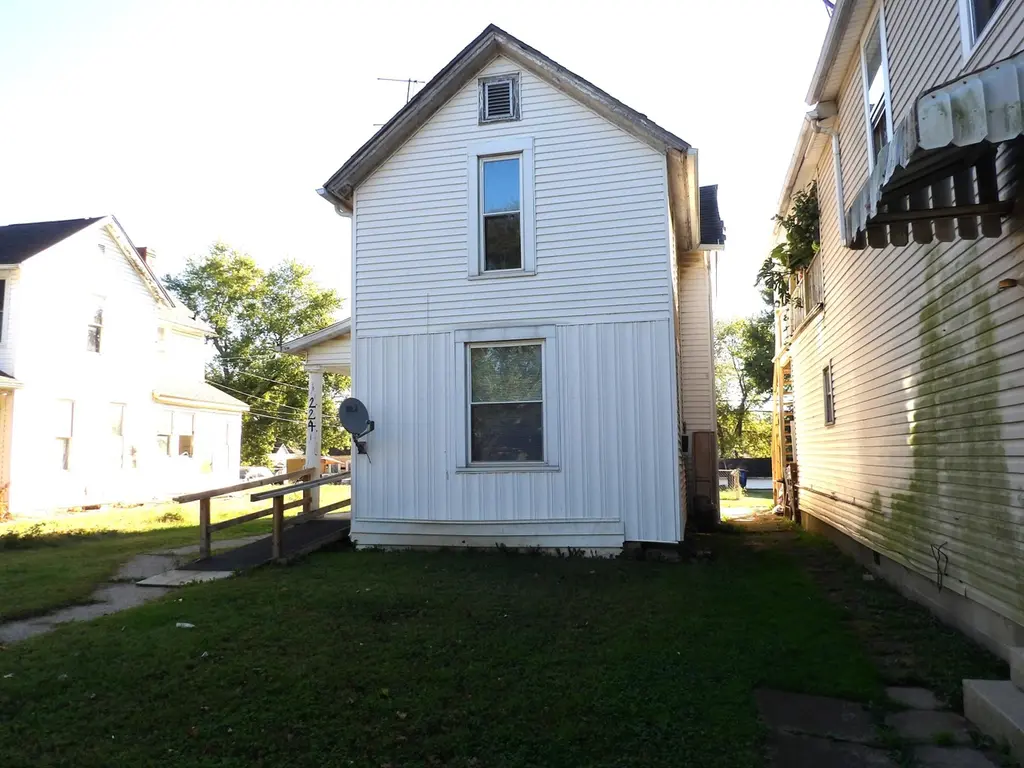
224 Harrison Ave · Lancaster, OH
Flood risk 1/10 · Minimal
- FEMA flood zone
- X (unshaded)
- Chance of flooding over 30 yrs
- 0.0%
- Est. flood insurance / yr
- $507 – $1,088
Fire risk 1/10 · Minimal
- Est. fire insurance / yr
- $713 – $1,323
Heat risk 4/10 · Minor
- Hot days now (above 99°F)
- 7 days/yr
- Hot days in 30 yrs
- 19 days/yr
Wind risk 2/10 · Minimal
- Chance of severe wind over 30 yrs
- 1.0%
Air-quality risk 2/10 · Minimal
- Unhealthy air days now
- 1 days/yr
- Unhealthy air days in 30 yrs
- 2 days/yr
Risk factors via First Street. Map © Google.
Why this score? — see what drove the B+ grade
The composite is a weighted blend of 9 inputs, each scored 0–100. Each bar is that input's sub-score; the figure is the points it added to the 100-point composite (weight × sub-score).
- Cash flow +30.0/30.0
- ARV discount +15.0/15.0
- 1% rule +10.0/10.0
- DSCR +10.0/10.0
- Livability +4.3/5.0
- Rent growth +3.8/5.0
- Schools +3.7/10.0
- Condition / age +2.5/5.0
- Appreciation +0.0/10.0
$90,000
🖨 Deal sheet 📄 Offer letter ✓ Due diligence
Listing remarks MLS
Attention investors! 3 bedroom, 1 bath, 2 story home. Convenient to shopping and restaurants.
Key facts
- 5,227 sq ft lot
- Built 1900
- Listed 29 days
Property features AI
Exterior
- Utilities: Public water; Public sewer
- Home design: Single-family residence; Two levels; Built in 1900; No shared/common walls
- Construction: Block foundation noted; Originally built in 1900
- Exterior features: Block foundation; Lot approximately 0.12 acre
Interior
- Bedrooms: One main-level bedroom
- Bathrooms: One full bathroom
- Heating & cooling: Forced air heating
- Interior features: Walk-up access, partial cellar, and crawl space basement
Neighborhood map
What this means for you Summary
Snapshot
- This is a 3-bed/1.0-bath single-family listed at $90k.
Deal economics
- At list price, monthly cash flow is $806 ($10k/yr) — positive.
- The deal already cash-flows at list — no discount required.
- Meets the 1% rule at list price ($2k rent vs $90k).
- Recommended offer: $89k (1.5% below list) — sets the bar for market timing.
- Cap rate 17.0% vs local median 4.0% in Lancaster — top-decile yield for the area; either an underpriced asset or a hidden risk that comps aren't pricing in. Stress-test before assuming the spread holds.
Location & tenants
- Location reads 86/100 on livability (#41 in OH, #423 nationally) — a professional / high-income tenant draw. Strengths: amenities A+, cost of living A+, housing A+; Watch: crime D, employment D.
- Lancaster City (town): math 38% / reading 51% proficiency, ranked #504 of 656 in OH (top 77%) — families likely to look elsewhere, expect single-tenant / working-renter base with shorter leases.
- Market conditions: Rents rising fast (+5.2%/yr); 204 active listings in the ZIP; 8 comparable units currently listed for rent nearby; rentals lingering (median 44d on market — plan ~5-8 weeks vacancy on turnover, expect pricing pressure); 50% of comp listings sitting > 30 days — soft ceiling on asking rent; 475 units permitted in Fairfield County in 2024 (0 in 5+ unit buildings).
Forward outlook
- Local home prices are declining (-3.0%/yr); year-one equity from $622 of loan paydown is wiped out by about $3k of value loss. Plan a longer hold.
- Fairfield County population projected at +8% by 2050 — modest demand growth; plan on rents tracking national, not racing it.
- At projected returns (-3.0% appreciation + 5.2% rent growth), your $25k cash investment doubles in ~3 years — after that, you're playing with house money.
Negotiation context
- It's been on market 29 days — a 2% lower offer ($89k) is reasonable based on typical stale-listing flexibility.
- 3 sale attempts with the ask held roughly flat each time — persistent listings suggest the price (not the market) is what's stuck; bring a comps-based counter.
Risks & watch-outs
- Watch-outs: built in 1900 — expect roof / HVAC / electrical / plumbing capex.
Questions for the listing agent
- Built in 1900 — when were the roof, HVAC, electrical panel, plumbing, and water heater last replaced?
- Is there a deadline driving the sale (1031 exchange, divorce, estate, relocation)? That informs how much negotiation room exists.
- Crime grade is D in this area — have there been break-ins, vandalism, or insurance claims at this property in the last 3 years? What carrier currently insures it and at what premium?
- What's the average days-on-market for RENTAL listings here right now (not sales)? A rising rental-DOM trend means longer vacancies and softer asking-rent achievability than the comps imply.
- What's the recent tenant-quality profile in this submarket — average credit score on applications, eviction rate, late-payment / NSF rate, and stable-employment percentage? A property-management company in the area should have these aggregated.
- How much new for-sale + rental construction is in the pipeline within 1–3 miles? Heavy new supply typically softens prices + rents 12–24 months out; constrained supply supports both.
Investment metrics
- 1% rule
- 1.92% ✓
- Cap rate
- 17.04%
- Cash-on-cash
- 38.37%
- DSCR
- 2.71
- GRM
- 4.3
CMA / ARV
- ARV (median comp)
- $143,950
- List price
- $90,000
- Delta
- -37.48%
- Verdict
- UNDERPRICED
- Comps
- 20 within 1.0 mi
Show comp detail 12 sales within ~0.75 mi
| Address | Dist | Beds/Ba | Sqft | Sold | Price | $/sf | Match |
|---|---|---|---|---|---|---|---|
| 215 Harrison Ave | 0.03mi | 2/1.0 (-1) | 1,300 (-1%) | 7mo | $145,000 | $112 | 86 |
| 520 W Wheeling St | 0.17mi | 3/1.0 | 1,288 (-2%) | 4mo | $110,000 | $85 | 86 |
| 404 Miller Ave | 0.40mi | 3/2.0 | 1,320 (+0%) | 4mo | $143,000 | $108 | 73 |
| 233 Union St | 0.51mi | 3/1.0 | 1,250 (-5%) | 3mo | $190,000 | $152 | 65 |
| 628 Harrison Ave | 0.35mi | 3/1.0 | 1,144 (-13%) | 6mo | $107,000 | $94 | 57 |
| 701 Washington Ave | 0.40mi | 4/1.5 (+1) | 1,176 (-11%) | 4mo | $227,500 | $193 | 54 |
| 334 Eagle Ave | 0.60mi | 3/1.0 | 1,512 (+15%) | 4mo | $50,000 | $33 | 43 |
| 526 N Columbus St | 0.65mi | 2/2.0 (-1) | 1,444 (+10%) | 2mo | $206,000 | $143 | 43 |
| 1715 W Walnut St | 0.65mi | 3/1.0 | 1,128 (-14%) | 6mo | $185,000 | $164 | 40 |
| 1223 W Fair Ave | 0.66mi | 3/2.0 | 1,168 (-11%) | 8mo | $193,000 | $165 | 40 |
| 1643 W Mulberry St | 0.63mi | 2/1.0 (-1) | 1,140 (-13%) | 8mo | $194,000 | $170 | 37 |
| 452 Westview Dr | 0.74mi | 3/2.0 | 1,484 (+13%) | 8mo | $224,750 | $151 | 34 |
Match score weights: distance 35% · size 25% · config 20% · recency 20%. Top-matched comps best support the ARV.
Projected returns pro-forma
-3.0% appreciation · 5.22% rent growth · sell at horizon
- IRR
- 36.9%
- Equity multiple
- 2.61×
- Total profit
- $40,676
- Equity at exit
- $13,419
- IRR
- 44.6%
- Equity multiple
- 5.70×
- Total profit
- $118,415
- Equity at exit
- $7,782
Cash invested: $25,200 (down + closing). Projections, not guarantees.
Landlord ↔ Tenant lean methodology
- Overall (STATE)
- 73 Landlord-Friendly
- State Ohio
- 73 Landlord-Friendly · R+6
- County
- — inherits STATE
- City
- — inherits STATE
ZIP-level market 43130
- Rents YoY
- 5.2%
- Active inventory
- 204
- Price-to-rent
- 4.3×
Monthly cashflow live
- Estimated rent
- $1,729 high interval (Pro) →
- Mortgage (P&I)
- −$472
- Tax from tax record
- −$51 /mo · $610/yr
- Insurance
- −$38
- HOA
- −$0
- Vacancy / Maint / Mgmt
- −$363
- Net cashflow
- $806
Break-even live
UW: 25.0% down · 7.5% · 30yr · 1.5% tax · 5.0% vac · 8.0% maint · 8.0% mgmt
Financing live
Cash to close
- Down payment
- $22,500
- Closing costs
- $2,700
- Reserves months
- —
- Total cash needed
- —
Loan-product check · same deal, 3 products live
Conventional
25% down · 7.5% · 30yr
- Down + closing
- —
- Monthly P&I
- —
- Monthly cashflow
- —
- DSCR
- —
- Eligible?
- —
Personal DTI + credit; lowest rate.
DSCR
20% down · 8.5% · 30yr
- Down + closing
- —
- Monthly P&I
- —
- Monthly cashflow
- —
- DSCR
- —
- Eligible?
- —
No personal income docs; deal must DSCR.
Hard money
10% down · 12.0% · 12mo
- Down + closing
- —
- Monthly P&I
- —
- Monthly cashflow
- —
- DSCR
- —
- Eligible?
- —
Short-term bridge; refi at stabilization.
Rent comps 8 comps
| Address | Beds | Baths | Sqft | Rent | $/sqft | DOM | Units | Dist |
|---|---|---|---|---|---|---|---|---|
| 421 Washington Ave Lancaster, OH | 4.0 | 1.0 | 1296 | $1,650 | $1.27 | 12d | 1 | 0.20mi |
| 219 N Columbus St Unit 231 Lancaster, OH | 2.0 | 2.0 | 975 | $1,735 | $1.78 | 44d | 1 | 0.53mi |
| 219 N Columbus St Unit 205 Lancaster, OH | 2.0 | 2.0 | 1103 | $1,875 | $1.70 | 44d | 1 | 0.53mi |
| 219 N Columbus St Lancaster, OH | 1.0–2.0 | 1.0–2.0 | 1184 | $1,895 | $1.60 | 2d | 31 | 0.53mi |
| 532 N Columbus St Unit A Lancaster, OH | 2.0 | 1.0 | 1300 | $1,550 | $1.19 | 44d | 1 | 0.64mi |
| 1508 Greyfield ST Lancaster, OH | 1.0–3.0 | 1.0–2.0 | 953 | $1,869 | $1.96 | 2d | 1 | 0.73mi |
| 635 N High St Lancaster, OH | 3.0 | 2.0 | 1608 | $2,200 | $1.37 | 44d | 1 | 0.95mi |
| 1733 Bellmeadow Dr Lancaster, OH | 1.0–3.0 | 1.0–2.5 | 993 | $1,855 | $1.87 | 2d | 10 | 1.16mi |
Listing history 12 events
-
2026-06-03days on market $90,000 Active 29 DOM
-
2026-06-02days on market $90,000 Active 28 DOM
-
2026-06-01days on market $90,000 Active 27 DOM
-
2026-05-31days on market $90,000 Active 26 DOM
-
2026-05-05$90,000 Active 169-char remark
-
2025-11-02historical
-
2025-10-01$90,000 Active
-
2025-08-01soldstatus $79,000
-
2025-07-23soldstatus $79,000 Closed
Show marketing remark (93 chars)
Attention investors! 3 bedroom, 1 bath, 2 story home. Convenient to shopping and restaurants.
-
2025-07-09status Pending
Show marketing remark (93 chars)
Attention investors! 3 bedroom, 1 bath, 2 story home. Convenient to shopping and restaurants.
-
2025-07-07$87,000 Active
Show marketing remark (93 chars)
Attention investors! 3 bedroom, 1 bath, 2 story home. Convenient to shopping and restaurants.
-
1997-05-29soldstatus $17,093
ⓘ Source: listings_history table (triggers on properties + properties_extension) + one-shot
backfill from property_details.listing_events for pre-trigger history.
Tax reassessment forecast OH · Partial reset (capped growth)
- Current annual tax
- $610 · $51/mo
- Projected year-2 tax
- $1,007 · $84/mo
- Expected delta
- +$397/yr (+$33/mo · 65.0%)
ⓘ Screening estimate from a state-policy table — verify with the county assessor before closing.
Climate risk First Street
- Flood 1/10 Low FEMA zone X (unshaded) · 0% chance over 30 yrs
- Wildfire 1/10 Low
- Heat 4/10 Moderate 7 d/yr ≥99°F today · 19 d/yr by 30 yrs out
- Wind 2/10 Low 100% chance of damaging wind over 30 yrs
- Air quality 2/10 Low 1 unhealthy d/yr today · 2 by 30 yrs out
Nearby sold comps map
Loading sold comps map…
Walkable amenities ~0.75 mi
Loading nearby amenities…
Taxation est. · year 1
- Rental income
- $20,752
- − Mortgage interest
- −$5,041
- − Property taxes
- −$610
- − Insurance
- −$450
- − Repairs & maintenance
- −$1,660
- − Management
- −$1,660
- − Depreciation
- −$2,618
- Taxable income
- $8,712
- Est. tax owed @ 24.0%
- −$2,091
- After-tax cash flow
- $7,579/yr
For passive investors: Depreciation is non-cash, so a rental often shows a tax loss while cash-flowing — sheltering income. Rental losses are passive: they offset passive income freely, and up to $25,000/yr can offset ordinary (W-2) income if you actively participate and your MAGI is under $100k (phasing out to $0 by $150k); unused losses carry forward. On sale, claimed depreciation is recaptured at up to 25%, and gains may owe capital-gains tax (a 1031 exchange can defer both). Figures are a year-1 estimate at your 24.0% rate — not tax advice; consult a CPA.
Schools (NCES district)
- District
- Lancaster City
- NCES district ID
- 3904420
- Math proficiency
- 38% ▼ -21.00%
- Reading proficiency
- 51% ▼ -11.00%
- Median HH income
- $41,696
- Composite
- 37.39/100
- National rank
- #4427
- State rank
- #504 of 656 in OH
Livability — Lancaster
- Score
- 86/100
- State rank
- #41
- US rank
- #423
Category grades
Schools grade is shown separately in the Schools card above.
Census & demographics
- Census place
- Lancaster, OH
- County
- Fairfield County · 109,896 people
- City population
- 62,933
- Metro
- Columbus, OH
- Population (ZIP)
- 62,933
- Household income
- $72,153
- Rent vs Own
- Severe rent burden
- 1400.0
Population outlook (Fairfield County) Hauer SSP2
- Today (2025)
- 162,442 people
- By 2030
- 166,796 · +2.7%
- By 2040
- 172,835 · +6.4%
- By 2050
- 174,822 · +7.6%
- By 2075
- 174,938 · +7.7%
- By 2100
- 160,988 · -0.9%
Race, ethnicity, and origin ACS 2023
- Neighborhood character
- Predominantly White (91%)
- Race & ethnicity
- White 91% Two or more races 4% Hispanic / Latino 2% Black 2%
- Common ancestry
- Slovak 2% Italian 1% Iranian 1%
- Foreign-born
- 1% · Canada
- Languages at home
- 98% English-only · Spanish 1%
Political lean MEDSL · Fairfield
- 2024 margin
- Strong R (+24.1) · D 37.5% · R 61.6%
- 2008→2024 swing
- -6.9pp toward R · 2008: -17.1pp · 2024: -24.1pp
- All cycles
- 2024: R+24.1 2020: R+23.5 2016: R+27.0 2012: R+16.1 2008: R+17.1
Not yet ingested
- Civics
- —
Market trends
- HPI YoY
- ▼ -298.81%
- Current HPI
- 239.6352
- Rent YoY
- ▲ 5.22%
- Metro
- Columbus, OH
- State GDP YoY
- ▲ 1.98%
- F500 in state
- 48
Industry mix (Fortune 500 HQ in OH)
| Industry | F500 HQs | Revenue |
|---|---|---|
| Insurance | 3 | $145B |
|
||
| Industrial Machinery | 3 | $49B |
|
||
| Financial Services | 3 | $24B |
|
||
| Consumer Goods | 2 | $93B |
|
||
| Aerospace / Defense | 2 | $47B |
|
||
| Utilities | 2 | $33B |
|
||
Price history
+409.0% since first listed10 events — show timeline
- 2026-06-06 Listing Removed — CBRMLS
- 2026-06-04 Price Changed $87,000 CBRMLS
- 2026-05-05 Listed $90,000 CBRMLS
- 2025-11-02 Listing Removed — CBRMLS
- 2025-10-01 Listed $90,000 CBRMLS
- 2025-08-01 Sold (Public Records) $79,000 Public Records
- 2025-07-23 Sold (MLS) $79,000 CBRMLS
- 2025-07-09 Pending — CBRMLS
- 2025-07-07 Listed $87,000 CBRMLS
- 1997-05-29 Sold (Public Records) $17,093 Public Records
Property tax history
-3.4%/yrLatest (2025): $610 · -8.1% YoY. Source: county tax records.
Cash-flow waterfall
monthlySold comps — $/sqft
last 12 mo · ≤1 miLoading sold comps…