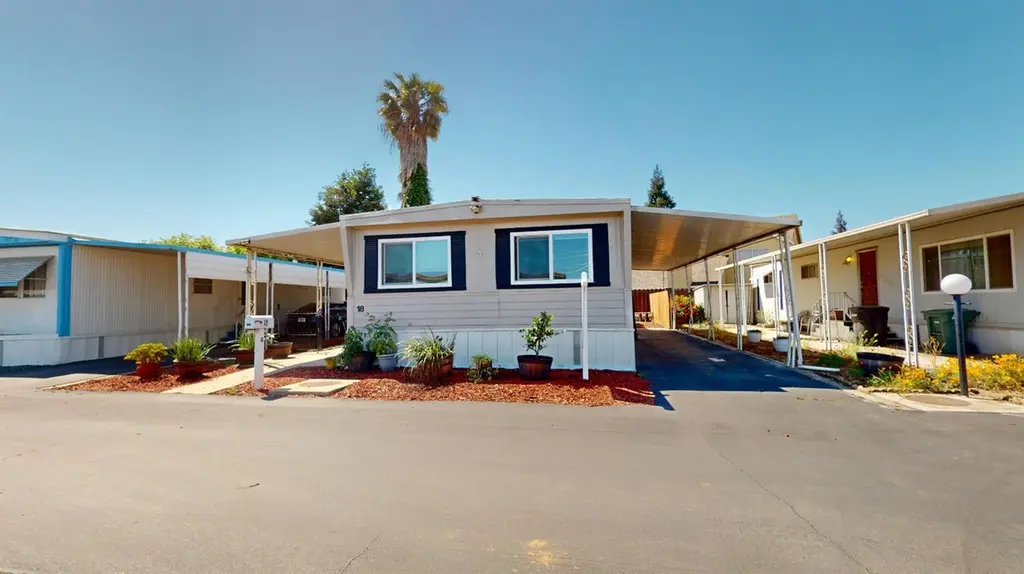
4125 Mchenry Ave #18 · Modesto, CA
Flood risk 1/10 · Minimal
- FEMA flood zone
- X (unshaded)
- Chance of flooding over 30 yrs
- 0.0%
- Est. flood insurance / yr
- $507 – $1,088
Fire risk 5/10 · Moderate
- Est. fire insurance / yr
- $659 – $1,223
Heat risk 6/10 · Moderate
- Hot days now (above 102°F)
- 6 days/yr
- Hot days in 30 yrs
- 13 days/yr
Wind risk 1/10 · Minimal
- Chance of severe wind over 30 yrs
- —
Air-quality risk 10/10 · Severe
- Unhealthy air days now
- 28 days/yr
- Unhealthy air days in 30 yrs
- 32 days/yr
Risk factors via First Street. Map © Google.
Why this score? — see what drove the C+ grade
The composite is a weighted blend of 9 inputs, each scored 0–100. Each bar is that input's sub-score; the figure is the points it added to the 100-point composite (weight × sub-score).
- Cash flow +29.5/30.0
- DSCR +10.0/10.0
- 1% rule +8.3/10.0
- Schools +4.4/10.0
- Livability +3.2/5.0
- Rent growth +2.5/5.0
- Condition / age +2.5/5.0
- ARV discount +1.7/15.0
- Appreciation +0.0/10.0
$117,000
🖨 Deal sheet (PDF) 📄 Offer letter ✓ Due diligence
Listing remarks
Welcome to this charming home in a highly desirable gated 55+ community in the Modesto area! The living room is filled with natural light from expansive windows, creating a warm and welcoming space for relaxing or entertaining. The kitchen offers ample cabinetry, stylish countertops, and stainless steel appliances, making everyday cooking easy and functional. Additional features include dual-pane windows, newer A/C for added comfort, and a convenient storage shed. Enjoy community amenities including a pool, clubhouse, and social events, all ideally located near shopping, dining, and the movie theaterdon't miss this one!
Key facts
- Gated community
- Ample cabinetry
- Dual-pane windows
Tags
Property features AI
Finance
- Other: Located at 4125 McHenry Ave #18, Modesto, CA 95356; Use GPS for directions
- HOA & community: No homeowners association; Located in a senior community; Land lease: No (land lease amount listed separately)
Exterior
- Parking: Attached covered parking
- Utilities: Electric: Other; Public sewer; Public water
- Home design: Manufactured home located in a park; Double-wide; Built in 1973
- Construction: Metal roof; Manufactured home (Van Dyke make)
- Exterior features: Metal skirting; Other lot features; Porch
Interior
- Kitchen: Free-standing gas range; Range hood; Dishwasher; Garbage disposal
- Bedrooms: 2 bedrooms
- Flooring: Carpet; Tile; Linoleum
- Bathrooms: 2 full bathrooms; Tub with shower over; Shower stall(s)
- Heating & cooling: Central heating; Central cooling; Wall-mounted A/C units; Window A/C units
- Interior features: Dual-pane full windows; Porch with steps and railing; Covered patio/porch; Pets allowed
- Laundry & utility: Washer and dryer included; Laundry inside the home (inside room/area)
Neighborhood map
What this means for you Summary
Snapshot
- This is a 2-bed/2.0-bath manufactured listed at $117k.
Deal economics
- At list price, monthly cash flow is $420 ($5k/yr) — positive.
- The deal already cash-flows at list — no discount required.
- Meets the 1% rule at list price ($2k rent vs $117k).
- Recommended offer: $113k (3.0% below list) — sets the bar for market timing.
- Cap rate 10.6% vs local median 3.2% in Modesto — top-decile yield for the area; either an underpriced asset or a hidden risk that comps aren't pricing in. Stress-test before assuming the spread holds.
Location & tenants
- Location reads 63/100 on livability (#451 in CA) — a middle-class / working-renter tenant base. Strengths: housing A+; Watch: amenities C-, schools D+, health & safety D+.
- Sylvan Union Elementary (urban): math 44% / reading 52% proficiency, ranked #457 of 1,400 in CA (top 33%) — families likely to look elsewhere, expect single-tenant / working-renter base with shorter leases.
- Market conditions: Rents soft (-0.1%/yr); 146 active listings in the ZIP; 14 comparable units currently listed for rent nearby; rentals at typical pace (median 16d on market — plan ~3-4 weeks tenant-placement turnaround); solid renter incomes; 923 units permitted in Stanislaus County in 2024 (63 in 5+ unit buildings).
Forward outlook
- Local home prices are declining (-3.0%/yr); year-one equity from $809 of loan paydown is wiped out by about $4k of value loss. Plan a longer hold.
- Stanislaus County population projected at +14% by 2050 — modest demand growth; plan on rents tracking national, not racing it.
Negotiation context
- It's been on market 41 days — a 3% lower offer ($113k) is reasonable based on typical stale-listing flexibility.
Risks & watch-outs
- Climate carrying-cost: moderate wildfire risk; extreme-heat days projected 6→13/yr by 2055 (HVAC capex compounding) — expect insurance premiums to compound above CPI over the hold.
Questions for the listing agent
- It's been on market 41 days. Have you received any prior offers? Is the seller open to a 3% concession, seller financing, or rate buy-down credit?
- Built in 1973 — when were the roof, HVAC, electrical panel, plumbing, and water heater last replaced?
- Is there a deadline driving the sale (1031 exchange, divorce, estate, relocation)? That informs how much negotiation room exists.
- Schools are D-rated, which usually means shorter tenancies and higher turnover. Who's the typical renter profile here, and what's been the actual vacancy rate?
- Crime grade is F in this area — have there been break-ins, vandalism, or insurance claims at this property in the last 3 years? What carrier currently insures it and at what premium?
- What's the average days-on-market for RENTAL listings here right now (not sales)? A rising rental-DOM trend means longer vacancies and softer asking-rent achievability than the comps imply.
- What's the recent tenant-quality profile in this submarket — average credit score on applications, eviction rate, late-payment / NSF rate, and stable-employment percentage? A property-management company in the area should have these aggregated.
- How much new for-sale + rental construction is in the pipeline within 1–3 miles? Heavy new supply typically softens prices + rents 12–24 months out; constrained supply supports both.
Investment metrics
- 1% rule
- 1.33% ✓
- Cap rate
- 10.60%
- Cash-on-cash
- 15.39%
- DSCR
- 1.68
- GRM
- 6.3
CMA / ARV
- ARV (on-the-fly)
- $103,680
- Comps found
- 12
Show comp detail 12 sales within ~0.75 mi
| Address | Dist | Beds/Ba | Sqft | Sold | Price | $/sf | Match |
|---|---|---|---|---|---|---|---|
| 4125 Mchenry Ave #134 | 0.04mi | 2/2.0 | 1,100 (+2%) | 2mo | $115,000 | $105 | 93 |
| 4125 Mchenry Ave #43 | 0.00mi | 2/2.0 | 1,120 (+4%) | 3mo | $65,000 | $58 | 91 |
| 4125 Mchenry Ave | 0.02mi | 2/2.0 | 1,120 (+4%) | 7mo | $135,000 | $121 | 87 |
| 4125 Mchenry Ave #30 | 0.03mi | 2/2.0 | 1,080 (0%) | 15mo | $70,000 | $65 | 87 |
| 4125 Mchenry Ave #55 | 0.04mi | 2/2.0 | 1,120 (+4%) | 7mo | $135,000 | $121 | 86 |
| 4125 Mchenry Ave #92 | 0.04mi | 2/2.0 | 1,120 (+4%) | 9mo | $45,000 | $40 | 84 |
| 4125 McHenry Ave #93 | 0.04mi | 2/2.0 | 940 (-13%) | 2mo | $56,000 | $60 | 75 |
| 4125 Mchenry Ave #71 | 0.04mi | 2/2.0 | 1,200 (+11%) | 9mo | $84,000 | $70 | 72 |
| 4024 Mchenry Ave #26 | 0.24mi | 3/2.0 (+1) | 940 (-13%) | 2mo | $90,000 | $96 | 61 |
| 48 Clipper Ln | 0.56mi | 2/2.0 | 1,160 (+7%) | 2mo | $129,000 | $111 | 60 |
| 70 Clipper Ln | 0.44mi | 3/2.0 (+1) | 1,056 (-2%) | 16mo | $120,000 | $114 | 58 |
| 165 Clipper Ln | 0.58mi | 2/2.0 | 1,200 (+11%) | 13mo | $105,000 | $88 | 44 |
Match score weights: distance 35% · size 25% · config 20% · recency 20%. Top-matched comps best support the ARV.
Projected returns pro-forma
-3.0% appreciation · 0.0% rent growth · sell at horizon
- IRR
- 2.7%
- Equity multiple
- 1.10×
- Total profit
- $3,258
- Equity at exit
- $17,445
- IRR
- 9.1%
- Equity multiple
- 1.60×
- Total profit
- $19,766
- Equity at exit
- $10,116
Cash invested: $32,760 (down + closing). Projections, not guarantees.
Landlord ↔ Tenant lean methodology
- Overall (STATE)
- 18 Strongly Tenant-Friendly
- State California
- 18 Strongly Tenant-Friendly · D+13
- County
- — inherits STATE
- City
- — inherits STATE
ZIP-level market 95356
- Rents YoY
- -0.1%
- Active inventory
- 146
- Price-to-rent
- 6.3×
Monthly cashflow live
- Estimated rent
- $1,555 high interval (Pro) →
- Mortgage (P&I)
- −$614
- Tax est. 1.5%
- −$146 /mo · $1,755/yr
- Insurance
- −$49
- HOA
- −$0
- Lot rent leased land?
- −$0
- Vacancy / Maint / Mgmt
- −$327
- Net cashflow
- $420
Break-even live
Sensitivity live
| Price | -10% $501 | -5% $460 | +0% $420 | +5% $380 | +10% $339 |
|---|---|---|---|---|---|
| Rent | -10% $297 | -5% $359 | +0% $420 | +5% $481 | +10% $543 |
| Rate | -1.0pp $479 | -0.5pp $450 | base $420 | +0.5pp $390 | +1.0pp $359 |
UW: 25.0% down · 7.5% · 30yr · 1.5% tax · 5.0% vac · 8.0% maint · 8.0% mgmt
Financing live
Cash to close
- Down payment
- $29,250
- Closing costs
- $3,510
- Reserves months
- —
- Total cash needed
- —
Loan-product check · same deal, 3 products live
Conventional
25% down · 7.5% · 30yr
- Down + closing
- —
- Monthly P&I
- —
- Monthly cashflow
- —
- DSCR
- —
- Eligible?
- —
Personal DTI + credit; lowest rate.
DSCR
20% down · 8.5% · 30yr
- Down + closing
- —
- Monthly P&I
- —
- Monthly cashflow
- —
- DSCR
- —
- Eligible?
- —
No personal income docs; deal must DSCR.
Hard money
10% down · 12.0% · 12mo
- Down + closing
- —
- Monthly P&I
- —
- Monthly cashflow
- —
- DSCR
- —
- Eligible?
- —
Short-term bridge; refi at stabilization.
Rent comps 14 comps
| Address | Beds | Baths | Sqft | Rent | $/sqft | DOM | Units | Dist |
|---|---|---|---|---|---|---|---|---|
| 204 Warren Way Modesto, CA | 1.0–2.0 | 1.0 | 725 | $1,825 | $2.52 | 16d | 4 | 0.49mi |
| 3701 Colonial Dr #154 Modesto, CA | 2.0 | 1.5 | 978 | $1,950 | $1.99 | 16d | 1 | 0.78mi |
| 3509 Dragoo Park Dr Unit 3511 Modesto, CA | 3.0 | 2.0 | 1335 | $1,899 | $1.42 | 25d | 1 | 0.82mi |
| 3445 Colonial Dr Modesto, CA | 1.0–2.0 | 1.0 | 918 | $2,295 | $2.50 | 16d | 10 | 0.90mi |
| 3104 Sherwood Ave Modesto, CA | 2.0 | 1.0 | 820 | $2,071 | $2.53 | 16d | 10 | 1.01mi |
| 939 Claremont Ct Modesto, CA | 3.0 | 2.5 | 1406 | $2,100 | $1.49 | 16d | 1 | 1.01mi |
| 3401 Tully Rd Modesto, CA | 2.0 | 2.0 | 1024 | $2,095 | $2.05 | 16d | 2 | 1.09mi |
| 204 Emerson Ave Unit A Modesto, CA | 3.0 | 1.0 | 1252 | $2,150 | $1.72 | 25d | 1 | 1.15mi |
| 3904 Monteview Dr Unit 1 Modesto, CA | 3.0 | 2.0 | 1100 | $1,995 | $1.81 | 23d | 1 | 1.20mi |
| 2700 Macdougal St #12 Modesto, CA | 2.0 | 1.0 | 858 | $1,625 | $1.89 | 23d | 1 | 1.24mi |
| 1305 Sylvan Meadows Dr Unit C Modesto, CA | 2.0 | 1.5 | 1037 | $2,150 | $2.07 | 16d | 1 | 1.24mi |
| 3400 Coffee Rd Modesto, CA | 2.0 | 2.0 | 951 | $1,945 | $2.05 | 23d | 1 | 1.37mi |
| 3400 Coffee Rd Modesto, CA | 1.0 | 1.0 | 707 | $1,645 | $2.33 | 16d | 1 | 1.37mi |
| 200 Sheila Ct Modesto, CA | 1.0–2.0 | 1.0–1.5 | 841 | $1,725 | $2.05 | 16d | 1 | 1.42mi |
Listing history 11 events
-
2026-06-10days on market $117,000 Active 41 DOM
-
2026-06-09days on market $117,000 Active 40 DOM
-
2026-06-08days on market $117,000 Active 39 DOM
-
2026-06-07days on market $117,000 Active 38 DOM
-
2026-06-05pricedays on market $117,000 Active 35 DOM
-
2026-06-03days on market $119,000 Active 34 DOM
-
2026-06-03price $119,000 Active 33 DOM
-
2026-06-02days on market $119,900 Active 33 DOM
-
2026-06-01days on market $119,900 Active 32 DOM
-
2026-05-31days on market $119,900 Active 31 DOM
-
2026-05-30days on market $119,900 Active 30 DOM
ⓘ Source: listings_history table (triggers on properties + properties_extension) + one-shot
backfill from property_details.listing_events for pre-trigger history.
Climate risk First Street
- Flood 1/10 Low FEMA zone X (unshaded) · 0% chance over 30 yrs
- Wildfire 5/10 Major
- Heat 6/10 Major 6 d/yr ≥102°F today · 13 d/yr by 30 yrs out
- Wind 1/10 Low
- Air quality 10/10 Extreme 28 unhealthy d/yr today · 32 by 30 yrs out
Nearby sold comps map
Loading sold comps map…
Walkable amenities ~0.75 mi
Loading nearby amenities…
Taxation est. · year 1
- Rental income
- $18,662
- − Mortgage interest
- −$6,554
- − Property taxes
- −$1,755
- − Insurance
- −$585
- − Repairs & maintenance
- −$1,493
- − Management
- −$1,493
- − Depreciation
- −$3,404
- Taxable income
- $3,379
- Est. tax owed @ 24.0%
- −$811
- After-tax cash flow
- $4,229/yr
For passive investors: Depreciation is non-cash, so a rental often shows a tax loss while cash-flowing — sheltering income. Rental losses are passive: they offset passive income freely, and up to $25,000/yr can offset ordinary (W-2) income if you actively participate and your MAGI is under $100k (phasing out to $0 by $150k); unused losses carry forward. On sale, claimed depreciation is recaptured at up to 25%, and gains may owe capital-gains tax (a 1031 exchange can defer both). Figures are a year-1 estimate at your 24.0% rate — not tax advice; consult a CPA.
Schools (NCES district)
- District
- Sylvan Union Elementary
- NCES district ID
- 0638670
- Math proficiency
- 44% ▲ 2.00%
- Reading proficiency
- 52% ▬ 0.00%
- Median HH income
- $61,181
- Composite
- 44.28/100
- National rank
- #6167
- State rank
- #457 of 1400 in CA
Livability — Modesto
- Score
- 63/100
- State rank
- #451
- US rank
- #15229
Category grades
Schools grade is shown separately in the Schools card above.
Census & demographics
- County
- Stanislaus County · 445,786 people
- City population
- 225,261
- Metro
- Modesto, CA
- Population (ZIP)
- 33,233
- Household income
- $96,886
- Rent vs Own
- Severe rent burden
- 847.0
Population outlook (Stanislaus County) Hauer SSP2
- Today (2025)
- 579,493 people
- By 2030
- 598,000 · +3.2%
- By 2040
- 630,930 · +8.9%
- By 2050
- 658,300 · +13.6%
- By 2075
- 712,363 · +22.9%
- By 2100
- 719,805 · +24.2%
Race, ethnicity, and origin ACS 2023
- Neighborhood character
- Diverse neighborhood (Simpson 0.64)
- Race & ethnicity
- White 50% Hispanic / Latino 32% Two or more races 16% Asian 9% Pacific Islander 2% Black 2% Native American 1%
- Hispanic origin (detail)
- Mexican 28%
- Common ancestry
- Russian 4% Italian 2% Iranian 2%
- Foreign-born
- 17% · Canada, China, Vietnam
- Languages at home
- 69% English-only · Spanish 15% Other Indo-European 6% Russian/Polish/Slavic 2%
Political lean MEDSL · Stanislaus
- 2024 margin
- R (+11.0) · D 43.2% · R 54.2% · Other 2.6%
- 2008→2024 swing
- -12.7pp toward R · 2008: 1.7pp · 2024: -11.0pp
- All cycles
- 2024: R+11.0 2020: D+0.8 2016: D+0.6 2012: D+0.7 2008: D+1.7
Not yet ingested
- Civics
- —
Market trends
- HPI YoY
- ▼ -374.73%
- Current HPI
- 270.6957
- Rent YoY
- ▼ -0.12%
- Metro
- Modesto, CA
- State GDP YoY
- ▲ 3.21%
- F500 in state
- 116
Industry mix (Fortune 500 HQ in CA)
| Industry | F500 HQs | Revenue |
|---|---|---|
| Technology | 27 | $1,492B |
|
||
| Financial Services | 3 | $174B |
|
||
| Retail | 3 | $44B |
|
||
| Insurance | 3 | $26B |
|
||
| Media / Entertainment | 2 | $115B |
|
||
| Pharmaceuticals / Biotech | 2 | $62B |
|
||
Cash-flow waterfall
monthlySold comps — $/sqft
last 12 mo · ≤1 miLoading sold comps…