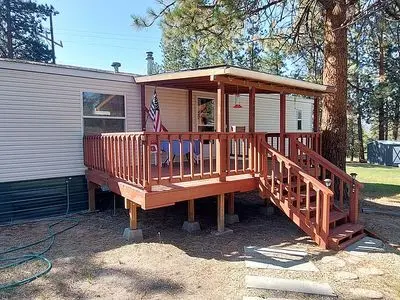
109 Laura Ln · Stevensville, MT
Flood risk 1/10 · Minimal
- FEMA flood zone
- X (unshaded)
- Chance of flooding over 30 yrs
- 0.0%
- Est. flood insurance / yr
- $507 – $1,088
Fire risk 5/10 · Moderate
- Est. fire insurance / yr
- $918 – $1,706
Heat risk 3/10 · Minor
- Hot days now (above 93°F)
- 7 days/yr
- Hot days in 30 yrs
- 16 days/yr
Wind risk 1/10 · Minimal
- Chance of severe wind over 30 yrs
- —
Air-quality risk 10/10 · Severe
- Unhealthy air days now
- 29 days/yr
- Unhealthy air days in 30 yrs
- 35 days/yr
Risk factors via First Street. Map © Google.
Why this score? — see what drove the B- grade
The composite is a weighted blend of 9 inputs, each scored 0–100. Each bar is that input's sub-score; the figure is the points it added to the 100-point composite (weight × sub-score).
- Cash flow +30.0/30.0
- DSCR +10.0/10.0
- 1% rule +9.7/10.0
- ARV discount +7.5/15.0
- Schools +4.9/10.0
- Livability +3.5/5.0
- Rent growth +2.5/5.0
- Condition / age +1.0/5.0
- Appreciation +0.0/10.0
$129,900
🖨 Deal sheet 📄 Offer letter ✓ Due diligence
Key facts
- Covered decks
- Carport
- Storage barn
Tags
Neighborhood map
What this means for you Summary
Snapshot
- This is a 3-bed/2.0-bath other listed at $130k. Condition is rated poor.
Deal economics
- At list price, monthly cash flow is $608 ($7k/yr) — positive.
- The deal already cash-flows at list — no discount required.
- Meets the 1% rule at list price ($2k rent vs $130k).
- Recommended offer: $126k (3.0% below list) — sets the bar for market timing.
- Cap rate 11.9% vs local median 1.3% in Stevensville — top-decile yield for the area; either an underpriced asset or a hidden risk that comps aren't pricing in. Stress-test before assuming the spread holds.
Location & tenants
- Location reads 70/100 on livability (#71 in MT) — a middle-class / working-renter tenant base. Strengths: crime A+, cost of living A+, housing B+; Watch: amenities F, commute F, employment F.
- Lone Rock Elementary (rural): math 50% / reading 60% proficiency, ranked #43 of 339 in MT (top 13%) — acceptable for families but not a draw, mixed tenant base, ~2y average lease.
- Market conditions: 145 active listings in the ZIP; 27 units permitted in Ravalli County in 2024 (0 in 5+ unit buildings).
Forward outlook
- Local home prices are declining (-3.0%/yr); year-one equity from $898 of loan paydown is wiped out by about $4k of value loss. Plan a longer hold.
- At projected returns (-3.0% appreciation + 3.0% rent growth), your $36k cash investment doubles in ~7 years — after that, you're playing with house money.
Negotiation context
- It's been on market 35 days — a 3% lower offer ($126k) is reasonable based on typical stale-listing flexibility.
Risks & watch-outs
- Climate carrying-cost: moderate wildfire risk — expect insurance premiums to compound above CPI over the hold.
Questions for the listing agent
- It's been on market 35 days. Have you received any prior offers? Is the seller open to a 3% concession, seller financing, or rate buy-down credit?
- Have any recent inspections been done? Can we get a copy of the seller's disclosures and any deferred-maintenance estimates?
- Is there a deadline driving the sale (1031 exchange, divorce, estate, relocation)? That informs how much negotiation room exists.
- What's the average days-on-market for RENTAL listings here right now (not sales)? A rising rental-DOM trend means longer vacancies and softer asking-rent achievability than the comps imply.
- What's the recent tenant-quality profile in this submarket — average credit score on applications, eviction rate, late-payment / NSF rate, and stable-employment percentage? A property-management company in the area should have these aggregated.
- How much new for-sale + rental construction is in the pipeline within 1–3 miles? Heavy new supply typically softens prices + rents 12–24 months out; constrained supply supports both.
Investment metrics
- 1% rule
- 1.47% ✓
- Cap rate
- 11.91%
- Cash-on-cash
- 20.05%
- DSCR
- 1.89
- GRM
- 5.7
CMA / ARV
No comps found within radius.
Projected returns pro-forma
-3.0% appreciation · 3.0% rent growth · sell at horizon
- IRR
- 12.2%
- Equity multiple
- 1.49×
- Total profit
- $17,678
- Equity at exit
- $19,369
- IRR
- 21.2%
- Equity multiple
- 2.80×
- Total profit
- $65,342
- Equity at exit
- $11,231
Cash invested: $36,372 (down + closing). Projections, not guarantees.
Landlord ↔ Tenant lean methodology
- Overall (STATE)
- 82 Strongly Landlord-Friendly
- State Montana
- 82 Strongly Landlord-Friendly · R+11
- County
- — inherits STATE
- City
- — inherits STATE
ZIP-level market 59870
- Active inventory
- 145
- Price-to-rent
- 5.7×
Monthly cashflow live
- Estimated rent
- $1,905 medium interval (Pro) →
- Mortgage (P&I)
- −$681
- Tax est. 1.5%
- −$162 /mo · $1,948/yr
- Insurance
- −$54
- HOA
- −$0
- Vacancy / Maint / Mgmt
- −$400
- Net cashflow
- $608
Break-even live
UW: 25.0% down · 7.5% · 30yr · 1.5% tax · 5.0% vac · 8.0% maint · 8.0% mgmt
Financing live
Cash to close
- Down payment
- $32,475
- Closing costs
- $3,897
- Reserves months
- —
- Total cash needed
- —
Loan-product check · same deal, 3 products live
Conventional
25% down · 7.5% · 30yr
- Down + closing
- —
- Monthly P&I
- —
- Monthly cashflow
- —
- DSCR
- —
- Eligible?
- —
Personal DTI + credit; lowest rate.
DSCR
20% down · 8.5% · 30yr
- Down + closing
- —
- Monthly P&I
- —
- Monthly cashflow
- —
- DSCR
- —
- Eligible?
- —
No personal income docs; deal must DSCR.
Hard money
10% down · 12.0% · 12mo
- Down + closing
- —
- Monthly P&I
- —
- Monthly cashflow
- —
- DSCR
- —
- Eligible?
- —
Short-term bridge; refi at stabilization.
Listing history 14 events
-
2026-06-16days on market $129,900 Active 35 DOM
-
2026-06-15days on market $129,900 Active 34 DOM
-
2026-06-13days on market $129,900 Active 32 DOM
-
2026-06-12days on market $129,900 Active 31 DOM
-
2026-06-09days on market $129,900 Active 28 DOM
-
2026-06-08days on market $129,900 Active 27 DOM
-
2026-06-07days on market $129,900 Active 26 DOM
-
2026-06-05days on market $129,900 Active 24 DOM
-
2026-06-04days on market $129,900 Active 22 DOM
-
2026-06-02days on market $129,900 Active 21 DOM
-
2026-06-01days on market $129,900 Active 20 DOM
-
2026-05-31days on market $129,900 Active 19 DOM
-
2026-05-13price $129,900
-
2026-05-12$139,900 Active
ⓘ Source: listings_history table (triggers on properties + properties_extension) + one-shot
backfill from property_details.listing_events for pre-trigger history.
Climate risk First Street
- Flood 1/10 Low FEMA zone X (unshaded) · 0% chance over 30 yrs
- Wildfire 5/10 Major
- Heat 3/10 Moderate 7 d/yr ≥93°F today · 16 d/yr by 30 yrs out
- Wind 1/10 Low
- Air quality 10/10 Extreme 29 unhealthy d/yr today · 35 by 30 yrs out
Nearby sold comps map
Loading sold comps map…
Walkable amenities ~0.75 mi
Loading nearby amenities…
Taxation est. · year 1
- Rental income
- $22,866
- − Mortgage interest
- −$7,276
- − Property taxes
- −$1,948
- − Insurance
- −$650
- − Repairs & maintenance
- −$1,829
- − Management
- −$1,829
- − Depreciation
- −$3,779
- Taxable income
- $5,554
- Est. tax owed @ 24.0%
- −$1,333
- After-tax cash flow
- $5,958/yr
For passive investors: Depreciation is non-cash, so a rental often shows a tax loss while cash-flowing — sheltering income. Rental losses are passive: they offset passive income freely, and up to $25,000/yr can offset ordinary (W-2) income if you actively participate and your MAGI is under $100k (phasing out to $0 by $150k); unused losses carry forward. On sale, claimed depreciation is recaptured at up to 25%, and gains may owe capital-gains tax (a 1031 exchange can defer both). Figures are a year-1 estimate at your 24.0% rate — not tax advice; consult a CPA.
Condition & rehab AI · 1 photo
The property requires extensive repairs and updates to its roof, exterior, flooring, interior walls, and systems, significantly impacting its current condition and value.
Repairs flagged
- Major roof — No visible roof in the satellite image.
- Major exterior — No visible exterior in the satellite image.
- Major flooring — No visible interior or exterior flooring in the satellite image.
- Major interior walls/paint — No visible interior walls or paint in the satellite image.
- Major systems — No visible systems in the satellite image.
Value-add opportunities
- Both roof replacement — A new roof would significantly improve the home's appearance and value.
- Both exterior painting/staining — A fresh coat of paint or staining would enhance curb appeal and value.
- Both flooring replacement — New flooring would improve the home's condition and appeal.
- Both interior painting — Fresh paint would improve the home's condition and appeal.
- Both system upgrades — Upgrading systems would improve the home's functionality and value.
Renovation cost estimate screening
| Repair item | Severity | Est. cost |
|---|---|---|
| roof · No visible roof in the satellite image. | Major | $15,000–50,000 |
| exterior · No visible exterior in the satellite image. | Major | $15,000–50,000 |
| flooring · No visible interior or exterior flooring in the satellite image. | Major | $15,000–50,000 |
| interior walls/paint · No visible interior walls or paint in the satellite image. | Major | $15,000–50,000 |
| systems · No visible systems in the satellite image. | Major | $15,000–50,000 |
| Total estimated repair cost · 5 items | $75,000–250,000 |
Value-add ROI direction
- Both roof replacement — A new roof would significantly improve the home's appearance and value. ↑
- Both exterior painting/staining — A fresh coat of paint or staining would enhance curb appeal and value. ↑
- Both flooring replacement — New flooring would improve the home's condition and appeal. ↑
- Both interior painting — Fresh paint would improve the home's condition and appeal. ↑
- Both system upgrades — Upgrading systems would improve the home's functionality and value. ↑
ⓘ Cost ranges are severity-bucket heuristics (US national rule-of-thumb). Get contractor quotes + a written scope before underwriting a rehab budget.
Schools (NCES district)
- District
- Lone Rock Elementary
- NCES district ID
- 3017190
- Math proficiency
- 50% ▲ 5.00%
- Reading proficiency
- 60% ▲ 5.00%
- Median HH income
- $48,839
- Composite
- 48.61/100
- National rank
- #4589
- State rank
- #43 of 339 in MT
Livability — Stevensville
- Score
- 70/100
- State rank
- #71
- US rank
- #7455
Category grades
Schools grade is shown separately in the Schools card above.
Census & demographics
- Population (ZIP)
- 12,247
Population outlook (Ravalli County) Hauer SSP2
- Today (2025)
- 43,584 people
- By 2030
- 44,336 · +1.7%
- By 2040
- 44,760 · +2.7%
- By 2050
- 44,193 · +1.4%
- By 2075
- 42,538 · -2.4%
- By 2100
- 39,079 · -10.3%
Race, ethnicity, and origin ACS 2023
- Neighborhood character
- Predominantly White (90%)
- Race & ethnicity
- White 90% Two or more races 5% Hispanic / Latino 3%
- Common ancestry
- Lithuanian 6% Portuguese 5% Italian 3%
- Foreign-born
- 2% · Canada
- Languages at home
- 97% English-only · Spanish 1% German/W. Germanic 1%
Political lean MEDSL · Ravalli
- 2024 margin
- Solid R (+40.6) · D 28.4% · R 68.9% · Other 2.7%
- 2008→2024 swing
- -19.7pp toward R · 2008: -20.8pp · 2024: -40.6pp
- All cycles
- 2024: R+40.6 2020: R+36.3 2016: R+38.6 2012: R+32.1 2008: R+20.8
Not yet ingested
- Civics
- —
Market trends
- HPI YoY
- ▼ -162.24%
- Current HPI
- 287.3688
- Rent YoY
- —
- Metro
- —
- State GDP YoY
- ▲ 3.41%
- F500 in state
- 2
Industry mix (Fortune 500 HQ in MT)
| Industry | F500 HQs | Revenue |
|---|---|---|
| Technology / Analytics | 1 | $2B |
|
||
Price history
-7.1% since first listed2 events — show timeline
- 2026-05-13 Price Changed $129,900 FSBO.com
- 2026-05-12 Listed $139,900 FSBO.com
Cash-flow waterfall
monthlySold comps — $/sqft
last 12 mo · ≤1 miLoading sold comps…