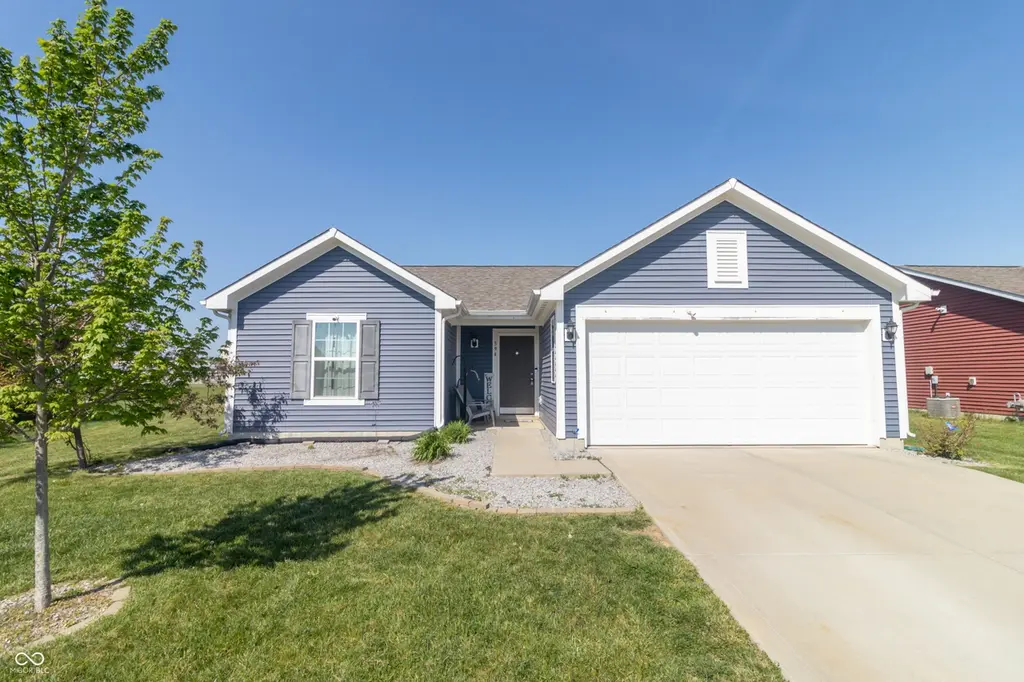
394 Gondola Run · Greenfield, IN
Flood risk 1/10 · Minimal
- FEMA flood zone
- X (unshaded)
- Chance of flooding over 30 yrs
- 0.0%
- Est. flood insurance / yr
- $507 – $1,088
Fire risk 1/10 · Minimal
- Est. fire insurance / yr
- $717 – $1,331
Heat risk 3/10 · Minor
- Hot days now (above 102°F)
- 7 days/yr
- Hot days in 30 yrs
- 18 days/yr
Wind risk 2/10 · Minimal
- Chance of severe wind over 30 yrs
- 1.0%
Air-quality risk 2/10 · Minimal
- Unhealthy air days now
- 1 days/yr
- Unhealthy air days in 30 yrs
- 2 days/yr
Risk factors via First Street. Map © Google.
Why this score? — see what drove the F grade
The composite is a weighted blend of 9 inputs, each scored 0–100. Each bar is that input's sub-score; the figure is the points it added to the 100-point composite (weight × sub-score).
- Cash flow +12.1/30.0
- Schools +4.0/10.0
- Livability +3.7/5.0
- DSCR +3.6/10.0
- Rent growth +3.2/5.0
- 1% rule +2.7/10.0
- Condition / age +2.5/5.0
- ARV discount +0.7/15.0
- Appreciation +0.0/10.0
$235,000
🖨 Deal sheet (PDF) 📄 Offer letter ✓ Due diligence
Listing remarks MLS
New Build 3-bedrooms 2-full baths. 1200 sq ft.
Key facts
- Extra storage
- Quarter acre lot
- Finished garage
Tags
Property features AI
Finance
- Other: Lot size approximately 0.24 acres; Low maintenance lifestyle: No
- HOA & community: Homeowners association with annual fee; HOA fee $400 annually; HOA includes entrance common areas and park/playground; Community amenities include playground and pool; HOA governed by covenants and restrictions
Exterior
- Parking: Attached garage; 2-car garage
- Security: Security system (owned)
- Utilities: Public water; Municipal sewer connected; 200+ amp electrical service; Cable available; Electricity connected; Natural gas connected; Sewer connected; Water connected
- Home design: Single family residence; One level (single-story); Mandatory-fee ownership
- Construction: Vinyl siding; Slab foundation; Built by Arbor Homes
- Exterior features: Curbs and street lights; Small trees (under 20 ft); Wedge-shaped lot
Interior
- Kitchen: Electric oven; Dishwasher; Refrigerator; Disposal
- Bedrooms: Primary bedroom with walk-in closet; Three bedrooms on the main level
- Bathrooms: Two full bathrooms; Primary bathroom with full shower stall
- Heating & cooling: Natural gas heating; Central air conditioning
- Interior features: Water softener (owned); Disposal; Water heater; Security system (owned)
- Laundry & utility: Washer and dryer included; Laundry room with full connections
Neighborhood map
What this means for you Summary
Snapshot
- This is a 3-bed/2.0-bath single-family listed at $235k.
Deal economics
- At list price, monthly cash flow is $-53 ($-642/yr) — negative.
- To cash-flow at today's rent, offer at most $226k (4.0% below list).
- To meet the 1% rule (rent ≥ 1% of price), the offer needs to be $182k (22.7% below list).
- Recommended offer: $182k (22.7% below list) — sets the bar for 1% rule.
- Cap rate 6.0% vs local median 4.7% in Greenfield — meaningfully above typical; check what's discounted (condition, days-on-market, listing class) to confirm the premium yield is real.
Location & tenants
- Location reads 73/100 on livability (#88 in IN) — a middle-class / working-renter tenant base. Strengths: cost of living A+, housing A+; Watch: amenities F, commute F.
- Greenfield-Central Community Schools (other): math 47% / reading 45% proficiency, ranked #83 of 301 in IN (top 28%) — families likely to look elsewhere, expect single-tenant / working-renter base with shorter leases.
- Zoned schools: Jb Stephens Elementary School (math 57% / reading 47%, grade C-, #237 of 994 statewide, top 26%, 561 students, 43% FRL); Greenfield Central Junior High Sch (math 38% / reading 42%, grade F, #120 of 330 statewide, top 37%, 675 students, 45% FRL); Greenfield-Central High School (math 37% / reading 65%, grade D+, #115 of 369 statewide, top 31%, 1,462 students, 35% FRL).
- Market conditions: Rents rising (+2.9%/yr); 481 active listings in the ZIP; 5 comparable units currently listed for rent nearby; rentals leasing fast (median 0d on market — plan ~1-2 weeks tenant-placement turnaround); solid renter incomes; 1,091 units permitted in Hancock County in 2024 (0 in 5+ unit buildings).
Forward outlook
- Local home prices are declining (-3.0%/yr); year-one equity from $2k of loan paydown is wiped out by about $7k of value loss. Plan a longer hold.
- Hancock County population projected at +7% by 2050 — modest demand growth; plan on rents tracking national, not racing it.
Negotiation context
- It's been on market 37 days — a 3% lower offer ($228k) is reasonable based on typical stale-listing flexibility.
- 3 sale attempts since 8y ago with the ask held roughly flat each time — persistent listings suggest the price (not the market) is what's stuck; bring a comps-based counter.
- Current owner paid $135k; list at $235k implies a 74% gain — meaningful room to come down on a strong offer.
Questions for the listing agent
- What do current leases actually rent for vs. the listed asking? Can we see a recent rent roll and the last 12 months of T-12 income?
- It's been on market 37 days. Have you received any prior offers? Is the seller open to a 23% concession, seller financing, or rate buy-down credit?
- What does the HOA fee cover, when was the last increase, and are there any pending special assessments or reserve-fund shortfalls?
- Is there a deadline driving the sale (1031 exchange, divorce, estate, relocation)? That informs how much negotiation room exists.
- Schools are B-rated — typically a magnet for longer-tenancy family renters. What's the average tenant stay here, and is there a school-zone premium baked into asking?
- The area grade is low — what's the realistic commute time and amenity access for the typical tenant pool here? Any planned neighborhood developments (good or bad) we should know about?
- What's the average days-on-market for RENTAL listings here right now (not sales)? A rising rental-DOM trend means longer vacancies and softer asking-rent achievability than the comps imply.
- What's the recent tenant-quality profile in this submarket — average credit score on applications, eviction rate, late-payment / NSF rate, and stable-employment percentage? A property-management company in the area should have these aggregated.
- How much new for-sale + rental construction is in the pipeline within 1–3 miles? Heavy new supply typically softens prices + rents 12–24 months out; constrained supply supports both.
Investment metrics
- 1% rule
- 0.77% ✗
- Cap rate
- 6.02%
- Cash-on-cash
- -0.98%
- DSCR
- 0.96
- GRM
- 10.8
CMA / ARV
- ARV (on-the-fly)
- $204,193
- Comps found
- 7
Show comp detail 7 sales within ~0.75 mi
| Address | Dist | Beds/Ba | Sqft | Sold | Price | $/sf | Match |
|---|---|---|---|---|---|---|---|
| 1652 Sweetwater Ln | 0.49mi | 2/2.0 (-1) | 1,022 (+5%) | 10mo | $200,000 | $196 | 56 |
| 685 Gondola Run | 0.33mi | 3/2.0 | 1,058 (+8%) | 21mo | $212,500 | $201 | 53 |
| 1616 Sweetwater Ln | 0.52mi | 3/2.0 | 1,110 (+14%) | 1mo | $235,000 | $212 | 52 |
| 319 Brookstone Dr | 0.55mi | 3/2.0 | 1,110 (+14%) | 2mo | $237,500 | $214 | 50 |
| 1647 Sweetwater Ln | 0.49mi | 3/2.0 | 1,110 (+14%) | 6mo | $229,900 | $207 | 49 |
| 1696 Carlton Dr | 0.45mi | 3/2.0 | 1,110 (+14%) | 13mo | $236,000 | $213 | 45 |
| 1683 Sweetwater Ln | 0.46mi | 3/2.0 | 1,110 (+14%) | 13mo | $232,000 | $209 | 45 |
Match score weights: distance 35% · size 25% · config 20% · recency 20%. Top-matched comps best support the ARV.
Projected returns pro-forma
-3.0% appreciation · 2.88% rent growth · sell at horizon
- IRR
- -18.1%
- Equity multiple
- 0.37×
- Total profit
- $-41,762
- Equity at exit
- $35,039
- IRR
- -10.6%
- Equity multiple
- 0.36×
- Total profit
- $-41,877
- Equity at exit
- $20,319
Cash invested: $65,800 (down + closing). Projections, not guarantees.
Landlord ↔ Tenant lean methodology
- Overall (STATE)
- 90 Strongly Landlord-Friendly
- State Indiana
- 90 Strongly Landlord-Friendly · R+11
- County
- — inherits STATE
- City
- — inherits STATE
ZIP-level market 46140
- Rents YoY
- 2.9%
- Active inventory
- 481
- Price-to-rent
- 10.8×
Monthly cashflow live
- Estimated rent
- $1,816 high interval (Pro) →
- Mortgage (P&I)
- −$1,232
- Tax from tax record
- −$124 /mo · $1,494/yr
- Insurance
- −$98
- HOA
- −$33
- Vacancy / Maint / Mgmt
- −$381
- Net cashflow
- $-53
Break-even live
Sensitivity live
| Price | -10% $80 | -5% $13 | +0% $-53 | +5% $-120 | +10% $-187 |
|---|---|---|---|---|---|
| Rent | -10% $-197 | -5% $-125 | +0% $-53 | +5% $18 | +10% $90 |
| Rate | -1.0pp $65 | -0.5pp $6 | base $-53 | +0.5pp $-114 | +1.0pp $-176 |
UW: 25.0% down · 7.5% · 30yr · 1.5% tax · 5.0% vac · 8.0% maint · 8.0% mgmt
Financing live
Cash to close
- Down payment
- $58,750
- Closing costs
- $7,050
- Reserves months
- —
- Total cash needed
- —
Loan-product check · same deal, 3 products live
Conventional
25% down · 7.5% · 30yr
- Down + closing
- —
- Monthly P&I
- —
- Monthly cashflow
- —
- DSCR
- —
- Eligible?
- —
Personal DTI + credit; lowest rate.
DSCR
20% down · 8.5% · 30yr
- Down + closing
- —
- Monthly P&I
- —
- Monthly cashflow
- —
- DSCR
- —
- Eligible?
- —
No personal income docs; deal must DSCR.
Hard money
10% down · 12.0% · 12mo
- Down + closing
- —
- Monthly P&I
- —
- Monthly cashflow
- —
- DSCR
- —
- Eligible?
- —
Short-term bridge; refi at stabilization.
Rent comps 5 comps
| Address | Beds | Baths | Sqft | Rent | $/sqft | DOM | Units | Dist |
|---|---|---|---|---|---|---|---|---|
| 685 Gondola Run Greenfield, IN | 3.0 | 2.0 | 1058 | $1,750 | $1.65 | 0d | 1 | 0.31mi |
| 502 Ginny Trce Greenfield, IN | 1.0–3.0 | 1.0–2.5 | 978 | $1,934 | $1.98 | 0d | 23 | 0.69mi |
| 210 Flagstone Dr Greenfield, IN | 1.0–3.0 | 1.0–2.5 | 1084 | $1,786 | $1.65 | 0d | 16 | 0.82mi |
| 917 E McKenzie Rd Greenfield, IN | 1.0–2.0 | 1.0–1.5 | 918 | $1,199 | $1.31 | 0d | 4 | 1.34mi |
| 432 Baldwin St Greenfield, IN | 2.0 | 1.0 | 788 | $1,425 | $1.81 | 25d | 1 | 1.49mi |
HOA detail
- Monthly dues
- $33 · $396/yr
Listing history 8 events
-
2026-06-01status $235,000 Pending 37 DOM
-
2026-05-31days on market $235,000 Active 37 DOM
-
2026-03-03$235,000 Active
-
2018-10-29soldstatus $135,000 Sold 46-char remark
Show marketing remark (46 chars)
New Build 3-bedrooms 2-full baths. 1200 sq ft.
-
2018-09-20status Pending 46-char remark
Show marketing remark (46 chars)
New Build 3-bedrooms 2-full baths. 1200 sq ft.
-
2018-09-20status Active 46-char remark
Show marketing remark (46 chars)
New Build 3-bedrooms 2-full baths. 1200 sq ft.
-
2018-05-12status Pending 46-char remark
Show marketing remark (46 chars)
New Build 3-bedrooms 2-full baths. 1200 sq ft.
-
2018-05-11$145,000 Active 46-char remark
Show marketing remark (46 chars)
New Build 3-bedrooms 2-full baths. 1200 sq ft.
ⓘ Source: listings_history table (triggers on properties + properties_extension) + one-shot
backfill from property_details.listing_events for pre-trigger history.
Tax reassessment forecast IN · Partial reset (capped growth)
- Current annual tax
- $1,494 · $124/mo
- Projected year-2 tax
- $1,746 · $145/mo
- Expected delta
- +$252/yr (+$21/mo · 16.9%)
ⓘ Screening estimate from a state-policy table — verify with the county assessor before closing.
Climate risk First Street
- Flood 1/10 Low FEMA zone X (unshaded) · 0% chance over 30 yrs
- Wildfire 1/10 Low
- Heat 3/10 Moderate 7 d/yr ≥102°F today · 18 d/yr by 30 yrs out
- Wind 2/10 Low 100% chance of damaging wind over 30 yrs
- Air quality 2/10 Low 1 unhealthy d/yr today · 2 by 30 yrs out
Nearby sold comps map
Loading sold comps map…
Walkable amenities ~0.75 mi
Loading nearby amenities…
Taxation est. · year 1
- Rental income
- $21,786
- − Mortgage interest
- −$13,164
- − Property taxes
- −$1,494
- − Insurance
- −$1,175
- − Repairs & maintenance
- −$1,743
- − Management
- −$1,743
- − HOA
- −$396
- − Depreciation
- −$6,836
- Taxable loss
- −$4,764
- Est. tax savings @ 24.0%
- +$1,143
- After-tax cash flow
- $502/yr
For passive investors: Depreciation is non-cash, so a rental often shows a tax loss while cash-flowing — sheltering income. Rental losses are passive: they offset passive income freely, and up to $25,000/yr can offset ordinary (W-2) income if you actively participate and your MAGI is under $100k (phasing out to $0 by $150k); unused losses carry forward. On sale, claimed depreciation is recaptured at up to 25%, and gains may owe capital-gains tax (a 1031 exchange can defer both). Figures are a year-1 estimate at your 24.0% rate — not tax advice; consult a CPA.
Schools (NCES district)
- District
- Greenfield-Central Community Schools
- NCES district ID
- 1804050
- Math proficiency
- 47% ▼ -12.00%
- Reading proficiency
- 45% ▼ -11.00%
- Median HH income
- $55,533
- Composite
- 40.01/100
- National rank
- #3827
- State rank
- #83 of 301 in IN
Livability — Greenfield
- Score
- 73/100
- State rank
- #88
- US rank
- #5094
Category grades
Schools grade is shown separately in the Schools card above.
Census & demographics
- Census place
- Greenfield, IN
- County
- Hancock County · 59,521 people
- City population
- 43,511
- Metro
- Indianapolis-Carmel-Anderson, IN
- Population (ZIP)
- 43,511
- Household income
- $83,056
- Rent vs Own
- Severe rent burden
- 795.0
Population outlook (Hancock County) Hauer SSP2
- Today (2025)
- 77,820 people
- By 2030
- 79,914 · +2.7%
- By 2040
- 82,734 · +6.3%
- By 2050
- 83,348 · +7.1%
- By 2075
- 82,439 · +5.9%
- By 2100
- 74,181 · -4.7%
Race, ethnicity, and origin ACS 2023
- Neighborhood character
- Predominantly White (92%)
- Race & ethnicity
- White 92% Two or more races 5% Hispanic / Latino 3% Black 1%
- Common ancestry
- Italian 3% Lithuanian 3% Slovak 1%
- Foreign-born
- 3% · Canada
- Languages at home
- 96% English-only · Spanish 2% Other Indo-European 1%
Political lean MEDSL · Hancock
- 2024 margin
- Solid R (+33.7) · D 32.2% · R 65.9% · Other 1.9%
- 2008→2024 swing
- -4.1pp toward R · 2008: -29.6pp · 2024: -33.7pp
- All cycles
- 2024: R+33.7 2020: R+37.5 2016: R+44.8 2012: R+41.0 2008: R+29.6
Not yet ingested
- Civics
- —
Market trends
- HPI YoY
- ▼ -131.67%
- Current HPI
- 225.0367
- Rent YoY
- ▲ 2.88%
- Metro
- Indianapolis-Carmel-Anderson, IN
- State GDP YoY
- ▲ 2.90%
- F500 in state
- 18
Industry mix (Fortune 500 HQ in IN)
| Industry | F500 HQs | Revenue |
|---|---|---|
| Industrial Machinery | 2 | $37B |
|
||
| Healthcare | 1 | $177B |
|
||
| Pharmaceuticals | 1 | $45B |
|
||
| Metals / Steel | 1 | $18B |
|
||
| Agriculture | 1 | $17B |
|
||
| Packaging | 1 | $12B |
|
||
Price history
+62.1% since first listed6 events — show timeline
- 2026-03-03 Listed $235,000 MIBOR as Distributed by MLS Grid
- 2018-10-29 Sold (MLS) $135,000 MIBOR as Distributed by MLS Grid
- 2018-09-20 Pending — MIBOR as Distributed by MLS Grid
- 2018-09-20 Relisted — MIBOR as Distributed by MLS Grid
- 2018-05-12 Pending — MIBOR as Distributed by MLS Grid
- 2018-05-11 Listed $145,000 MIBOR as Distributed by MLS Grid
Property tax history
+125.7%/yrLatest (2025): $1,494 · -10.7% YoY. Source: county tax records.
Cash-flow waterfall
monthlySold comps — $/sqft
last 12 mo · ≤1 miLoading sold comps…