4123 Hudson Ct · Decatur, AL
Flood risk No data
- FEMA flood zone
- —
- Chance of flooding over 30 yrs
- —
- Est. flood insurance / yr
- —
Fire risk No data
- Est. fire insurance / yr
- —
Heat risk No data
- Hot days now (above threshold)
- —
- Hot days in 30 yrs
- —
Wind risk No data
- Chance of severe wind over 30 yrs
- —
Air-quality risk No data
- Unhealthy air days now
- —
- Unhealthy air days in 30 yrs
- —
Risk factors via First Street. Map © Google.
Why this score? — see what drove the D- grade
The composite is a weighted blend of 9 inputs, each scored 0–100. Each bar is that input's sub-score; the figure is the points it added to the 100-point composite (weight × sub-score).
- Cash flow +13.4/30.0
- ARV discount +7.3/15.0
- DSCR +4.0/10.0
- 1% rule +3.9/10.0
- Livability +3.6/5.0
- Schools +2.7/10.0
- Rent growth +2.5/5.0
- Condition / age +2.5/5.0
- Appreciation +0.0/10.0
$180,400
🖨 Deal sheet (PDF) 📄 Offer letter ✓ Due diligence
Listing remarks
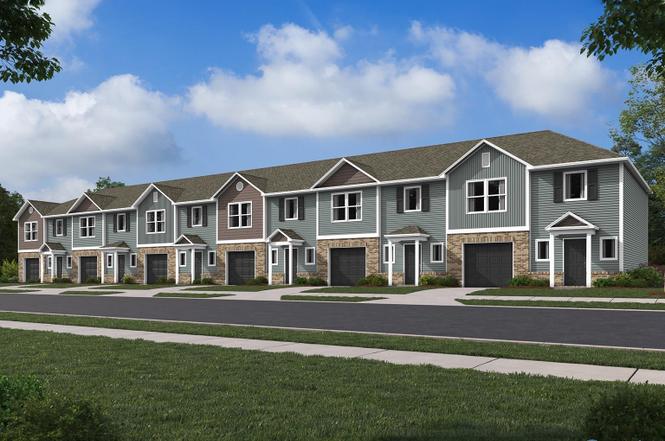
Under Construction-The charming RC Belmont’s rich curb appeal offers a covered front porch and front yard landscaping. This home features an open floor plan with 3 bedrooms, 2.5 bathrooms, and a spacious living area. Also enjoy a lovely dining area/kitchen fully equipped with energy-efficient appliances, ample counter space, and a convenient pantry. Builder will cover up to $8,000 in closing cost with our preferred lender Lennar Mortgage. Learn more about this home today!
Key facts
- Covered front porch
- Open floor plan
- Spacious living area
Tags
Neighborhood map
What this means for you Summary
Snapshot
- This is a 3-bed/2.5-bath townhouse listed at $180k.
Deal economics
- At list price, monthly cash flow is $3 ($34/yr) — positive.
- The deal already cash-flows at list — no discount required.
- To meet the 1% rule (rent ≥ 1% of price), the offer needs to be $161k (10.7% below list).
- Recommended offer: $159k (12.0% below list) — sets the bar for market timing.
- Cap rate 6.3% vs local median 4.0% in Decatur — top-decile yield for the area; either an underpriced asset or a hidden risk that comps aren't pricing in. Stress-test before assuming the spread holds.
Location & tenants
- Location reads 72/100 on livability (#28 in AL) — a middle-class / working-renter tenant base. Strengths: cost of living A+, housing A+, health & safety A+; Watch: employment D+, crime F, amenities F.
- Morgan County (rural): math 19% / reading 43% proficiency, ranked #61 of 129 in AL (top 47%) — families likely to look elsewhere, expect single-tenant / working-renter base with shorter leases.
- Zoned schools: Danville Middle School (math 5% / reading 31%, grade F, #197 of 257 statewide, top 77%, 377 students, 62% FRL) — zoned schools average 62% FRL vs 44% district-wide (18 pts higher); higher-poverty schools than district average — tighter screening recommended.
- Zoned-school proficiency averages 18% at this address vs 31% district-wide (-13 pts) — the specific schools serving this property underperform the Morgan County average; the district grade overstates school quality for this exact location.
- Market conditions: 404 active listings in the ZIP; 15 comparable units currently listed for rent nearby; rentals at typical pace (median 25d on market — plan ~3-4 weeks tenant-placement turnaround); solid renter incomes; 231 units permitted in Morgan County in 2024 (0 in 5+ unit buildings).
Forward outlook
- Local home prices are declining (-3.0%/yr); year-one equity from $1k of loan paydown is wiped out by about $5k of value loss. Plan a longer hold.
- Morgan County population projected at -11% by 2050 — secular population decline; favor cash flow + early exit over multi-decade hold.
Negotiation context
- It's been on market 196 days — a 12% lower offer ($159k) is reasonable based on typical stale-listing flexibility.
Questions for the listing agent
- It's been on market 196 days. Have you received any prior offers? Is the seller open to a 12% concession, seller financing, or rate buy-down credit?
- What does the HOA fee cover, when was the last increase, and are there any pending special assessments or reserve-fund shortfalls?
- Why hasn't it sold? Are there any deal-killer items the seller is aware of (foundation, flood, title, zoning, code violations)?
- Is there a deadline driving the sale (1031 exchange, divorce, estate, relocation)? That informs how much negotiation room exists.
- Crime grade is F in this area — have there been break-ins, vandalism, or insurance claims at this property in the last 3 years? What carrier currently insures it and at what premium?
- The area grade is low — what's the realistic commute time and amenity access for the typical tenant pool here? Any planned neighborhood developments (good or bad) we should know about?
- What's the average days-on-market for RENTAL listings here right now (not sales)? A rising rental-DOM trend means longer vacancies and softer asking-rent achievability than the comps imply.
- What's the recent tenant-quality profile in this submarket — average credit score on applications, eviction rate, late-payment / NSF rate, and stable-employment percentage? A property-management company in the area should have these aggregated.
- How much new for-sale + rental construction is in the pipeline within 1–3 miles? Heavy new supply typically softens prices + rents 12–24 months out; constrained supply supports both.
Investment metrics
- 1% rule
- 0.89% ✗
- Cap rate
- 6.31%
- Cash-on-cash
- 0.07%
- DSCR
- 1.00
- GRM
- 9.3
CMA / ARV
- ARV (on-the-fly)
- $179,564
- Comps found
- 12
Show comp detail 12 sales within ~0.75 mi
| Address | Dist | Beds/Ba | Sqft | Sold | Price | $/sf | Match |
|---|---|---|---|---|---|---|---|
| 4139 Hudson Ct | 0.00mi | 3/2.5 | 1,484 (0%) | 1mo | $185,400 | $125 | 100 |
| 4123 Hudson Ct | 0.00mi | 3/2.5 | 1,484 (0%) | 1mo | $180,000 | $121 | 99 |
| 4113 Hudson Ct | 0.00mi | 3/2.5 | 1,484 (0%) | 1mo | $165,000 | $111 | 99 |
| 4115 Hudson Ct | 0.00mi | 3/2.5 | 1,484 (0%) | 1mo | $186,650 | $126 | 99 |
| 4111 Hudson Ct | 0.00mi | 3/2.5 | 1,484 (0%) | 1mo | $185,400 | $125 | 99 |
| 4119 Hudson Ct | 0.00mi | 3/2.5 | 1,484 (0%) | 1mo | $165,000 | $111 | 99 |
| 4109 Hudson Ct | 0.00mi | 3/2.5 | 1,484 (0%) | 1mo | $179,900 | $121 | 99 |
| 4117 Hudson Ct | 0.00mi | 3/2.5 | 1,484 (0%) | 1mo | $167,301 | $113 | 99 |
| 4129 Hudson Ct | 0.00mi | 3/2.5 | 1,484 (0%) | 2mo | $179,900 | $121 | 98 |
| 4131 Hudson Ct | 0.00mi | 3/2.5 | 1,484 (0%) | 2mo | $179,900 | $121 | 98 |
| 4127 Hudson Ct | 0.00mi | 3/2.5 | 1,484 (0%) | 2mo | $179,900 | $121 | 98 |
| 4125 Hudson Ct | 0.00mi | 3/2.5 | 1,484 (0%) | 2mo | $185,400 | $125 | 98 |
Match score weights: distance 35% · size 25% · config 20% · recency 20%. Top-matched comps best support the ARV.
Projected returns pro-forma
-3.0% appreciation · 3.0% rent growth · sell at horizon
- IRR
- -16.2%
- Equity multiple
- 0.43×
- Total profit
- $-29,013
- Equity at exit
- $26,898
- IRR
- -7.8%
- Equity multiple
- 0.51×
- Total profit
- $-24,875
- Equity at exit
- $15,598
Cash invested: $50,512 (down + closing). Projections, not guarantees.
Landlord ↔ Tenant lean methodology
- Overall (STATE)
- 90 Strongly Landlord-Friendly
- State Alabama
- 90 Strongly Landlord-Friendly · R+15
- County
- — inherits STATE
- City
- — inherits STATE
ZIP-level market 35603
- Active inventory
- 404
- Price-to-rent
- 9.3×
Monthly cashflow live
- Estimated rent
- $1,611 high interval (Pro) →
- Mortgage (P&I)
- −$946
- Tax est. 1.5%
- −$226 /mo · $2,706/yr
- Insurance
- −$75
- HOA
- −$23
- Vacancy / Maint / Mgmt
- −$338
- Net cashflow
- $3
Break-even live
Sensitivity live
| Price | -10% $128 | -5% $65 | +0% $3 | +5% $-59 | +10% $-122 |
|---|---|---|---|---|---|
| Rent | -10% $-124 | -5% $-61 | +0% $3 | +5% $66 | +10% $130 |
| Rate | -1.0pp $94 | -0.5pp $49 | base $3 | +0.5pp $-44 | +1.0pp $-91 |
UW: 25.0% down · 7.5% · 30yr · 1.5% tax · 5.0% vac · 8.0% maint · 8.0% mgmt
Financing live
Cash to close
- Down payment
- $45,100
- Closing costs
- $5,412
- Reserves months
- —
- Total cash needed
- —
Loan-product check · same deal, 3 products live
Conventional
25% down · 7.5% · 30yr
- Down + closing
- —
- Monthly P&I
- —
- Monthly cashflow
- —
- DSCR
- —
- Eligible?
- —
Personal DTI + credit; lowest rate.
DSCR
20% down · 8.5% · 30yr
- Down + closing
- —
- Monthly P&I
- —
- Monthly cashflow
- —
- DSCR
- —
- Eligible?
- —
No personal income docs; deal must DSCR.
Hard money
10% down · 12.0% · 12mo
- Down + closing
- —
- Monthly P&I
- —
- Monthly cashflow
- —
- DSCR
- —
- Eligible?
- —
Short-term bridge; refi at stabilization.
Rent comps 15 comps
| Address | Beds | Baths | Sqft | Rent | $/sqft | DOM | Units | Dist |
|---|---|---|---|---|---|---|---|---|
| 4115 Hudson Ct SW , AL | 3.0 | 2.5 | 1484 | $1,450 | $0.98 | 15d | 1 | 0.02mi |
| 4129 Hudson Ct SW , AL | 3.0 | 2.5 | 1484 | $1,684 | $1.13 | 25d | 1 | 0.02mi |
| 4121 Hudson Ct SW Unit 1 , AL | 3.0 | 2.0 | 1484 | $1,650 | $1.11 | 25d | 1 | 0.02mi |
| 4135 Hudson Ct SW , AL | 3.0 | 2.5 | 1493 | $1,425 | $0.95 | 15d | 1 | 0.02mi |
| 4131 Hudson Ct SW , AL | 3.0 | 2.5 | 1484 | $1,684 | $1.13 | 25d | 1 | 0.02mi |
| 4121 Hudson Ct SW , AL | 3.0 | 2.5 | 1484 | $1,650 | $1.11 | 25d | 1 | 0.02mi |
| 4111 Hudson Ct SW , AL | 3.0 | 2.5 | 1484 | $1,695 | $1.14 | 15d | 1 | 0.02mi |
| 4117 Hudson Ct SW Unit 1 Decatur, AL | 3.0 | 2.5 | 1484 | $1,750 | $1.18 | 25d | 1 | 0.02mi |
| 4113 Hudson Ct SW , AL | 3.0 | 2.5 | 1484 | $1,700 | $1.15 | 25d | 1 | 0.02mi |
| 4119 Hudson Ct SW Unit 1 Decatur, AL | 3.0 | 2.5 | 1484 | $1,650 | $1.11 | 25d | 1 | 0.02mi |
| 4139 Hudson Ct SW Decatur, AL | 3.0 | 2.5 | 1493 | $1,425 | $0.95 | 15d | 1 | 0.02mi |
| 4030 Sherri ST SW Decatur, AL | 4.0 | 2.0 | 1800 | $2,000 | $1.11 | 45d | 1 | 0.14mi |
| 4020 Ryan Dr SW Decatur, AL | 3.0 | 2.0 | 1209 | $1,850 | $1.53 | 45d | 1 | 0.19mi |
| 4020 Ryan Dr SW Decatur, AL | 3.0 | 2.0 | 1209 | $1,825 | $1.51 | 25d | 1 | 0.19mi |
| 3526 Highway 31 S Decatur, AL | 2.0 | 1.5–2.5 | 1208 | $985 | $0.82 | 45d | 3 | 0.93mi |
HOA detail
- Monthly dues
- $23 · $276/yr
- Likely covers
- landscaping
Listing history 6 events
-
2026-03-18status Pending
-
2026-02-21price $180,400
-
2026-02-10price $179,900
-
2026-01-15price $189,900
-
2025-10-30price $200,900
-
2025-09-03$209,900 Active
ⓘ Source: listings_history table (triggers on properties + properties_extension) + one-shot
backfill from property_details.listing_events for pre-trigger history.
Nearby sold comps map
Loading sold comps map…
Walkable amenities ~0.75 mi
Loading nearby amenities…
Taxation est. · year 1
- Rental income
- $19,330
- − Mortgage interest
- −$10,105
- − Property taxes
- −$2,706
- − Insurance
- −$902
- − Repairs & maintenance
- −$1,546
- − Management
- −$1,546
- − HOA
- −$276
- − Depreciation
- −$5,248
- Taxable loss
- −$3,000
- Est. tax savings @ 24.0%
- +$720
- After-tax cash flow
- $754/yr
For passive investors: Depreciation is non-cash, so a rental often shows a tax loss while cash-flowing — sheltering income. Rental losses are passive: they offset passive income freely, and up to $25,000/yr can offset ordinary (W-2) income if you actively participate and your MAGI is under $100k (phasing out to $0 by $150k); unused losses carry forward. On sale, claimed depreciation is recaptured at up to 25%, and gains may owe capital-gains tax (a 1031 exchange can defer both). Figures are a year-1 estimate at your 24.0% rate — not tax advice; consult a CPA.
Schools (NCES district)
- District
- Morgan County
- NCES district ID
- 0102480
- Math proficiency
- 19% ▼ -28.00%
- Reading proficiency
- 43% ▼ -3.00%
- Median HH income
- $47,362
- Composite
- 26.68/100
- National rank
- #7157
- State rank
- #61 of 129 in AL
Livability — Decatur
- Score
- 72/100
- State rank
- #28
- US rank
- #5989
Category grades
Schools grade is shown separately in the Schools card above.
Census & demographics
- County
- Morgan County · 67,628 people
- City population
- 67,628
- Metro
- Decatur, AL
- Population (ZIP)
- 32,179
- Household income
- $81,490
- Rent vs Own
- Severe rent burden
- 467.0
Population outlook (Morgan County) Hauer SSP2
- Today (2025)
- 118,775 people
- By 2030
- 116,979 · -1.5%
- By 2040
- 111,800 · -5.9%
- By 2050
- 105,181 · -11.4%
- By 2075
- 87,736 · -26.1%
- By 2100
- 67,624 · -43.1%
Race, ethnicity, and origin ACS 2023
- Neighborhood character
- Predominantly White (74%)
- Race & ethnicity
- White 74% Black 15% Hispanic / Latino 6% Two or more races 5%
- Hispanic origin (detail)
- Mexican 3%
- Common ancestry
- Italian 2% Slovak 2% Serbian 1%
- Foreign-born
- 5% · Canada, Vietnam
- Languages at home
- 92% English-only · Spanish 5% Arabic 2%
Political lean MEDSL · Morgan
- 2024 margin
- Solid R (+52.6) · D 23.2% · R 75.8%
- 2008→2024 swing
- -8.8pp toward R · 2008: -43.8pp · 2024: -52.6pp
- All cycles
- 2024: R+52.6 2020: R+49.2 2016: R+52.4 2012: R+44.5 2008: R+43.8
Not yet ingested
- Civics
- —
Market trends
- HPI YoY
- ▼ -141.07%
- Current HPI
- 243.157
- Rent YoY
- —
- Metro
- Decatur, AL
- State GDP YoY
- ▲ 2.94%
- F500 in state
- 4
Industry mix (Fortune 500 HQ in AL)
| Industry | F500 HQs | Revenue |
|---|---|---|
| Financial Services | 1 | $8B |
|
||
| Healthcare | 1 | $5B |
|
||
Price history
-14.1% since first listed6 events — show timeline
- 2026-03-18 Pending — VMLS
- 2026-02-21 Price Changed $180,400 VMLS
- 2026-02-10 Price Changed $179,900 VMLS
- 2026-01-15 Price Changed $189,900 VMLS
- 2025-10-30 Price Changed $200,900 VMLS
- 2025-09-03 Listed $209,900 VMLS
Cash-flow waterfall
monthlySold comps — $/sqft
last 12 mo · ≤1 miLoading sold comps…