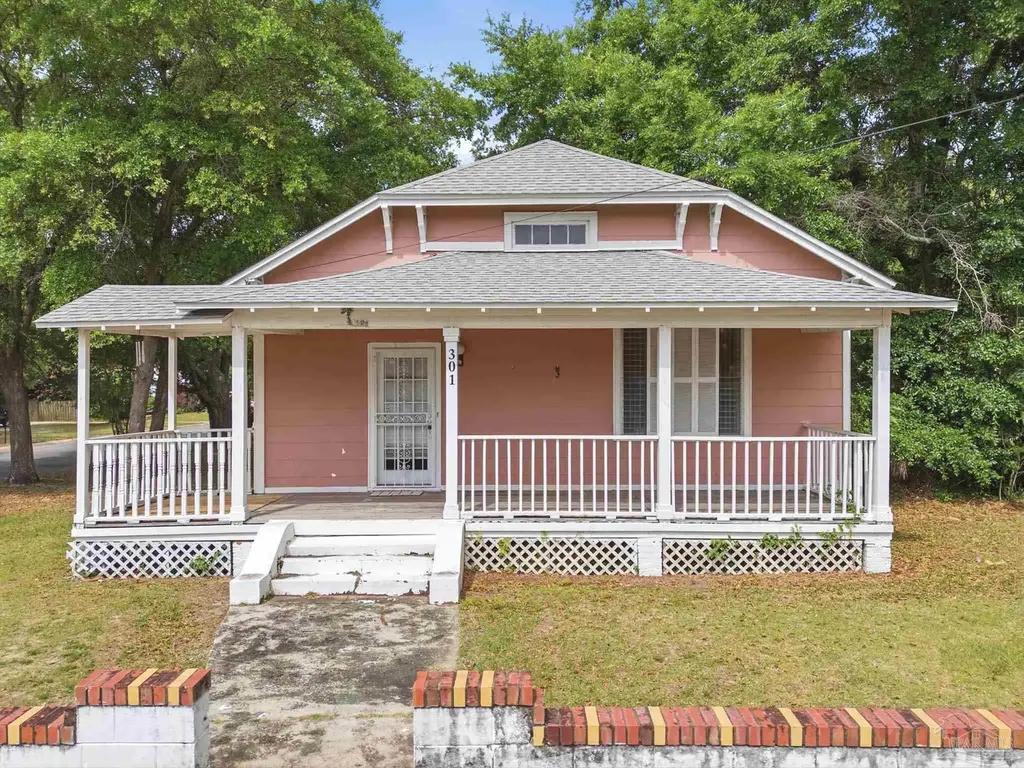
301 N F St · Pensacola, FL
Flood risk 1/10 · Minimal
- FEMA flood zone
- X (unshaded)
- Chance of flooding over 30 yrs
- 0.0%
- Est. flood insurance / yr
- $507 – $1,088
Fire risk 1/10 · Minimal
- Est. fire insurance / yr
- $947 – $1,759
Heat risk 10/10 · Severe
- Hot days now (above 105°F)
- 7 days/yr
- Hot days in 30 yrs
- 23 days/yr
Wind risk 9/10 · Severe
- Chance of severe wind over 30 yrs
- 99.0%
Air-quality risk 2/10 · Minimal
- Unhealthy air days now
- 0 days/yr
- Unhealthy air days in 30 yrs
- 1 days/yr
Risk factors via First Street. Map © Google.
Why this score? — see what drove the C- grade
The composite is a weighted blend of 9 inputs, each scored 0–100. Each bar is that input's sub-score; the figure is the points it added to the 100-point composite (weight × sub-score).
- Cash flow +16.1/30.0
- ARV discount +15.0/15.0
- DSCR +5.0/10.0
- Livability +4.2/5.0
- Rent growth +3.9/5.0
- 1% rule +3.8/10.0
- Schools +3.6/10.0
- Condition / age +2.5/5.0
- Appreciation +0.0/10.0
$250,000
🖨 Deal sheet 📄 Offer letter ✓ Due diligence
Listing remarks MLS
Great opportunity for the INVESTOR. While the property is offered AS IS and clearly needs some TLC, you will see it is a DIAMOND in the rough. Terrific possibilities!
Key facts
- Formal dining room
- Majestic oak trees
- High ceilings
Tags
Property features AI
Finance
- Other: Green features include insulated walls and ridge vent
- HOA & community: No homeowners association
Exterior
- Parking: Side entrance
- Utilities: Public water; Public sewer; Copper electrical wiring; Publicly maintained road
- Home design: Single-story home; Resale property; Not attached to another property; Has fireplace(s) (two or more)
- Construction: Frame construction; Shingle roof with gable and hip elements; Off-grade foundation; One-level
- Exterior features: Porch; Corner lot
Interior
- Kitchen: Laminate counters; Dishwasher; Refrigerator; Electric water heater
- Bedrooms: Primary bedroom on the first floor; Two additional bedrooms on the first floor
- Flooring: Hardwood; Tile; Vinyl; Carpet
- Bathrooms: One full bathroom on the first floor
- Heating & cooling: Central heating; Central air; Ceiling fans
- Interior features: Baseboards; Crown molding; High ceilings; High-speed internet
- Laundry & utility: Indoor laundry
Neighborhood map
What this means for you Summary
Snapshot
- This is a 3-bed/1.0-bath single-family listed at $250k.
Deal economics
- At list price, monthly cash flow is $128 ($2k/yr) — positive.
- The deal already cash-flows at list — no discount required.
- To meet the 1% rule (rent ≥ 1% of price), the offer needs to be $219k (12.5% below list).
- Recommended offer: $219k (12.5% below list) — sets the bar for 1% rule.
- Cap rate 6.9% vs local median 3.6% in Pensacola — top-decile yield for the area; either an underpriced asset or a hidden risk that comps aren't pricing in. Stress-test before assuming the spread holds.
Location & tenants
- Location reads 83/100 on livability (#53 in FL, #924 nationally) — a professional / high-income tenant draw. Strengths: commute A+, cost of living A+, housing A+.
- Escambia (suburban): math 40% / reading 45% proficiency, ranked #56 of 73 in FL (top 77%) — families likely to look elsewhere, expect single-tenant / working-renter base with shorter leases.
- Market conditions: Rents rising fast (+5.4%/yr); 127 active listings in the ZIP; 22 comparable units currently listed for rent nearby; rentals at typical pace (median 23d on market — plan ~3-4 weeks tenant-placement turnaround); lower-income renter base — watch delinquency; 1,479 units permitted in Escambia County in 2024 (0 in 5+ unit buildings).
- At $2,188/mo this rent would consume 59% of the median local household income ($44k/yr) (locally 816% of renters already pay >50% of income on rent) — very limited rent-growth headroom before tenants either downsize or default.
Forward outlook
- Local home prices are declining (-3.0%/yr); year-one equity from $2k of loan paydown is wiped out by about $8k of value loss. Plan a longer hold.
- Escambia County population projected at +13% by 2050 — modest demand growth; plan on rents tracking national, not racing it.
Negotiation context
- It's been on market 55 days — a 3% lower offer ($242k) is reasonable based on typical stale-listing flexibility.
- 2 sale attempts since 17y ago with the ask held roughly flat each time — persistent listings suggest the price (not the market) is what's stuck; bring a comps-based counter.
- Current owner paid $60k; list at $250k implies a 317% gain — meaningful room to come down on a strong offer.
Risks & watch-outs
- Watch-outs: built in 1923 — expect roof / HVAC / electrical / plumbing capex.
- Climate carrying-cost: severe wind risk, 99% chance of damaging wind over 30y; extreme-heat days projected 7→23/yr by 2055 (HVAC capex compounding) — expect insurance premiums to compound above CPI over the hold.
Questions for the listing agent
- It's been on market 55 days. Have you received any prior offers? Is the seller open to a 12% concession, seller financing, or rate buy-down credit?
- Built in 1923 — when were the roof, HVAC, electrical panel, plumbing, and water heater last replaced?
- Is there a deadline driving the sale (1031 exchange, divorce, estate, relocation)? That informs how much negotiation room exists.
- What's the average days-on-market for RENTAL listings here right now (not sales)? A rising rental-DOM trend means longer vacancies and softer asking-rent achievability than the comps imply.
- What's the recent tenant-quality profile in this submarket — average credit score on applications, eviction rate, late-payment / NSF rate, and stable-employment percentage? A property-management company in the area should have these aggregated.
- How much new for-sale + rental construction is in the pipeline within 1–3 miles? Heavy new supply typically softens prices + rents 12–24 months out; constrained supply supports both.
Investment metrics
- 1% rule
- 0.88% ✗
- Cap rate
- 6.91%
- Cash-on-cash
- 2.19%
- DSCR
- 1.10
- GRM
- 9.5
CMA / ARV
- ARV (median comp)
- $325,971
- List price
- $250,000
- Delta
- -23.31%
- Verdict
- UNDERPRICED
- Comps
- 20 within 1.0 mi
Show comp detail 12 sales within ~0.75 mi
| Address | Dist | Beds/Ba | Sqft | Sold | Price | $/sf | Match |
|---|---|---|---|---|---|---|---|
| 724 N K St | 0.43mi | 3/1.0 | 1,674 (+8%) | 1mo | $299,900 | $179 | 66 |
| 724 N Coyle St | 0.50mi | 3/2.0 | 1,501 (-3%) | 4mo | $300,000 | $200 | 64 |
| 971 W Romana | 0.48mi | 3/2.5 | 1,656 (+7%) | 4mo | $450,000 | $272 | 57 |
| 306 S N St | 0.71mi | 3/2.0 | 1,610 (+4%) | 4mo | $290,000 | $180 | 53 |
| 341 S F St | 0.51mi | 3/2.5 | 1,754 (+13%) | 2mo | $444,900 | $254 | 46 |
| 1315 W Government St | 0.56mi | 3/2.5 | 1,754 (+13%) | 1mo | $444,900 | $254 | 45 |
| 1325 W Government St | 0.56mi | 3/2.5 | 1,754 (+13%) | 1mo | $459,900 | $262 | 45 |
| 425 S F St | 0.57mi | 3/2.5 | 1,754 (+13%) | 0mo | $444,400 | $253 | 45 |
| 422 W De Soto St | 0.67mi | 2/2.0 (-1) | 1,440 (-7%) | 4mo | $331,000 | $230 | 45 |
| 512 W Romana St | 0.61mi | 3/3.0 | 1,408 (-9%) | 4mo | $425,000 | $302 | 45 |
| 1350 W Government St | 0.53mi | 3/2.5 | 1,754 (+13%) | 5mo | $409,900 | $234 | 43 |
| 1380 W Government St | 0.53mi | 3/2.5 | 1,754 (+13%) | 5mo | $409,900 | $234 | 43 |
Match score weights: distance 35% · size 25% · config 20% · recency 20%. Top-matched comps best support the ARV.
Projected returns pro-forma
-3.0% appreciation · 5.4% rent growth · sell at horizon
- IRR
- -10.4%
- Equity multiple
- 0.61×
- Total profit
- $-26,996
- Equity at exit
- $37,276
- IRR
- 1.9%
- Equity multiple
- 1.14×
- Total profit
- $10,123
- Equity at exit
- $21,615
Cash invested: $70,000 (down + closing). Projections, not guarantees.
Landlord ↔ Tenant lean methodology
- Overall (STATE)
- 87 Strongly Landlord-Friendly
- State Florida
- 87 Strongly Landlord-Friendly · R+3
- County
- — inherits STATE
- City
- — inherits STATE
ZIP-level market 32501
- Rents YoY
- 5.4%
- Active inventory
- 127
- Price-to-rent
- 9.5×
Monthly cashflow live
- Estimated rent
- $2,188 high interval (Pro) →
- Mortgage (P&I)
- −$1,311
- Tax from tax record
- −$185 /mo · $2,225/yr
- Insurance
- −$104
- HOA
- −$0
- Vacancy / Maint / Mgmt
- −$459
- Net cashflow
- $128
Break-even live
UW: 25.0% down · 7.5% · 30yr · 1.5% tax · 5.0% vac · 8.0% maint · 8.0% mgmt
Financing live
Cash to close
- Down payment
- $62,500
- Closing costs
- $7,500
- Reserves months
- —
- Total cash needed
- —
Loan-product check · same deal, 3 products live
Conventional
25% down · 7.5% · 30yr
- Down + closing
- —
- Monthly P&I
- —
- Monthly cashflow
- —
- DSCR
- —
- Eligible?
- —
Personal DTI + credit; lowest rate.
DSCR
20% down · 8.5% · 30yr
- Down + closing
- —
- Monthly P&I
- —
- Monthly cashflow
- —
- DSCR
- —
- Eligible?
- —
No personal income docs; deal must DSCR.
Hard money
10% down · 12.0% · 12mo
- Down + closing
- —
- Monthly P&I
- —
- Monthly cashflow
- —
- DSCR
- —
- Eligible?
- —
Short-term bridge; refi at stabilization.
Rent comps 22 comps
| Address | Beds | Baths | Sqft | Rent | $/sqft | DOM | Units | Dist |
|---|---|---|---|---|---|---|---|---|
| 411 N D St Pensacola, FL | 4.0 | 2.0 | 1511 | $2,175 | $1.44 | 23d | 1 | 0.19mi |
| 410 N C St Unit 1367374P Pensacola, FL | 3.0 | 2.0 | 1291 | $3,313 | $2.57 | 13d | 1 | 0.27mi |
| 106 S G St Pensacola, FL | 3.0 | 2.0 | 1300 | $2,200 | $1.69 | 23d | 1 | 0.32mi |
| 239 N K St Pensacola, FL | 3.0 | 2.0 | 1392 | $1,950 | $1.40 | 23d | 1 | 0.32mi |
| 706 N F St Pensacola, FL | 3.0 | 2.5 | 2000 | $2,600 | $1.30 | 23d | 1 | 0.32mi |
| 814 N E St Pensacola, FL | 3.0 | 2.0 | 1440 | $1,695 | $1.18 | 23d | 1 | 0.42mi |
| 615 N A St Pensacola, FL | 3.0 | 2.0 | 1122 | $1,900 | $1.69 | 13d | 1 | 0.44mi |
| 1010 N D St Pensacola, FL | 2.0 | 2.0 | 1196 | $1,850 | $1.55 | 23d | 1 | 0.56mi |
| 309 N Pace Blvd Unit B Pensacola, FL | 3.0 | 2.0 | 1342 | $1,650 | $1.23 | 23d | 1 | 0.57mi |
| 315 N Pace Blvd Unit A Pensacola, FL | 3.0 | 2.0 | 1342 | $1,850 | $1.38 | 23d | 1 | 0.60mi |
| 315 N Pace Blvd Unit b Pensacola, FL | 3.0 | 2.0 | 1342 | $1,650 | $1.23 | 23d | 1 | 0.60mi |
| 218 Junction Ave Pensacola, FL | 2.0 | 2.5 | 1295 | $2,400 | $1.85 | 23d | 1 | 0.60mi |
| 379 S Clubbs St Unit A Pensacola, FL | 2.0 | 2.0 | 1190 | $2,400 | $2.02 | 23d | 1 | 0.71mi |
| 1215 N C St Pensacola, FL | 3.0 | 1.0 | 1203 | $1,775 | $1.48 | 13d | 1 | 0.71mi |
| 214 W La Rua St Pensacola, FL | 2.0 | 2.5 | 1600 | $2,800 | $1.75 | 13d | 1 | 0.74mi |
| 504 N Spring St Unit B Pensacola, FL | 3.0 | 1.5 | 1485 | $1,995 | $1.34 | 23d | 1 | 0.79mi |
| 101 E Romana St Pensacola, FL | 3.0 | 1.0–2.0 | 987 | $2,588 | $2.62 | 13d | 20 | 1.15mi |
| 2802 W Gonzalez St Pensacola, FL | 3.0 | 2.0 | 1824 | $1,600 | $0.88 | 23d | 1 | 1.21mi |
| 407 W Jordan St Unit NA Pensacola, FL | 3.0 | 2.0 | 1300 | $2,200 | $1.69 | 23d | 1 | 1.31mi |
| 511 E La Rua St Pensacola, FL | 3.0 | 1.0 | 1128 | $1,475 | $1.31 | 13d | 1 | 1.37mi |
| 419 N Wentworth St Pensacola, FL | 2.0 | 1.0 | 1100 | $1,195 | $1.09 | 23d | 1 | 1.44mi |
| 3141 Barrancas Ave Pensacola, FL | 2.0 | 1.5 | 1200 | $2,150 | $1.79 | 13d | 1 | 1.46mi |
Listing history 18 events
-
2026-06-18days on market $250,000 Active 55 DOM
-
2026-06-17days on market $250,000 Active 54 DOM
-
2026-06-16days on market $250,000 Active 53 DOM
-
2026-06-15days on market $250,000 Active 52 DOM
-
2026-06-14days on market $250,000 Active 50 DOM
-
2026-06-10days on market $250,000 Active 47 DOM
-
2026-06-09days on market $250,000 Active 46 DOM
-
2026-06-08days on market $250,000 Active 45 DOM
-
2026-06-07days on market $250,000 Active 44 DOM
-
2026-06-03days on market $250,000 Active 40 DOM
-
2026-06-02days on market $250,000 Active 39 DOM
-
2026-06-01days on market $250,000 Active 38 DOM
-
2026-05-31days on market $250,000 Active 37 DOM
-
2026-05-31days on market $250,000 Active 36 DOM
-
2026-04-23$250,000 Active 1019-char remark
-
2017-02-16soldstatus $60,000
-
2010-11-24soldstatus $12,000 168-char remark
Show marketing remark (168 chars)
Great opportunity for the INVESTOR. While the property is offered AS IS and clearly needs some TLC, you will see it is a DIAMOND in the rough. Terrific possibilities!
-
2009-12-29$27,500 168-char remark
Show marketing remark (168 chars)
Great opportunity for the INVESTOR. While the property is offered AS IS and clearly needs some TLC, you will see it is a DIAMOND in the rough. Terrific possibilities!
ⓘ Source: listings_history table (triggers on properties + properties_extension) + one-shot
backfill from property_details.listing_events for pre-trigger history.
Tax reassessment forecast FL · Resets to sale price
- Current annual tax
- $2,225 · $185/mo
- Projected year-2 tax
- $2,225 · $185/mo
- Expected delta
- $0/yr ($0/mo · 0.0%)
ⓘ Screening estimate from a state-policy table — verify with the county assessor before closing.
Climate risk First Street
- Flood 1/10 Low FEMA zone X (unshaded) · 0% chance over 30 yrs
- Wildfire 1/10 Low
- Heat 10/10 Extreme 7 d/yr ≥105°F today · 23 d/yr by 30 yrs out
- Wind 9/10 Extreme 99% chance of damaging wind over 30 yrs
- Air quality 2/10 Low 0 unhealthy d/yr today · 1 by 30 yrs out
Nearby sold comps map
Loading sold comps map…
Walkable amenities ~0.75 mi
Loading nearby amenities…
Taxation est. · year 1
- Rental income
- $26,257
- − Mortgage interest
- −$14,004
- − Property taxes
- −$2,225
- − Insurance
- −$1,250
- − Repairs & maintenance
- −$2,101
- − Management
- −$2,101
- − Depreciation
- −$7,273
- Taxable loss
- −$2,696
- Est. tax savings @ 24.0%
- +$647
- After-tax cash flow
- $2,183/yr
For passive investors: Depreciation is non-cash, so a rental often shows a tax loss while cash-flowing — sheltering income. Rental losses are passive: they offset passive income freely, and up to $25,000/yr can offset ordinary (W-2) income if you actively participate and your MAGI is under $100k (phasing out to $0 by $150k); unused losses carry forward. On sale, claimed depreciation is recaptured at up to 25%, and gains may owe capital-gains tax (a 1031 exchange can defer both). Figures are a year-1 estimate at your 24.0% rate — not tax advice; consult a CPA.
Schools (NCES district)
- District
- Escambia
- NCES district ID
- 1200510
- Math proficiency
- 40% ▼ -9.00%
- Reading proficiency
- 45% ▼ -4.00%
- Median HH income
- $44,649
- Composite
- 36.04/100
- National rank
- #4773
- State rank
- #56 of 73 in FL
Livability — Pensacola
- Score
- 83/100
- State rank
- #53
- US rank
- #924
Category grades
Schools grade is shown separately in the Schools card above.
Census & demographics
- Census place
- Pensacola, FL
- County
- Escambia County · 301,722 people
- City population
- 237,636
- Metro
- Pensacola-Ferry Pass-Brent, FL
- Population (ZIP)
- 11,036
- Household income
- $44,139
- Rent vs Own
- Severe rent burden
- 816.0
Population outlook (Escambia County) Hauer SSP2
- Today (2025)
- 334,637 people
- By 2030
- 345,779 · +3.3%
- By 2040
- 364,828 · +9.0%
- By 2050
- 378,514 · +13.1%
- By 2075
- 403,220 · +20.5%
- By 2100
- 386,125 · +15.4%
Race, ethnicity, and origin ACS 2023
- Neighborhood character
- Diverse neighborhood (Simpson 0.62)
- Race & ethnicity
- Black 45% White 42% Two or more races 8% Hispanic / Latino 5%
- Common ancestry
- Subsaharan African 2% Italian 2% Slovak 2%
- Foreign-born
- 2% · Canada, Vietnam
- Languages at home
- 97% English-only · Spanish 2%
Political lean MEDSL · Escambia
- 2024 margin
- R (+19.5) · D 39.7% · R 59.2% · Other 1.1%
- 2008→2024 swing
- -0.2pp no change · 2008: -19.3pp · 2024: -19.5pp
- All cycles
- 2024: R+19.5 2020: R+15.1 2016: R+20.6 2012: R+20.6 2008: R+19.3
Not yet ingested
- Civics
- —
Market trends
- HPI YoY
- ▼ -210.53%
- Current HPI
- 273.0151
- Rent YoY
- ▲ 5.40%
- Metro
- Pensacola-Ferry Pass-Brent, FL
- State GDP YoY
- ▲ 3.28%
- F500 in state
- 36
Industry mix (Fortune 500 HQ in FL)
| Industry | F500 HQs | Revenue |
|---|---|---|
| Industrial Technology | 2 | $29B |
|
||
| Insurance | 2 | $17B |
|
||
| Retail | 1 | $60B |
|
||
| Technology Distribution | 1 | $58B |
|
||
| Homebuilding | 1 | $35B |
|
||
| Technology Manufacturing | 1 | $35B |
|
||
Price history
+809.1% since first listed4 events — show timeline
- 2026-04-23 Listed $250,000 PARMLS
- 2017-02-16 Sold (Public Records) $60,000 Public Records
- 2010-11-24 Sold (MLS) $12,000 PARMLS
- 2009-12-29 Listed $27,500 PARMLS
Property tax history
+8.9%/yrLatest (2025): $2,225 · +10.2% YoY. Source: county tax records.
Cash-flow waterfall
monthlySold comps — $/sqft
last 12 mo · ≤1 miLoading sold comps…