 🌊 Lakefront
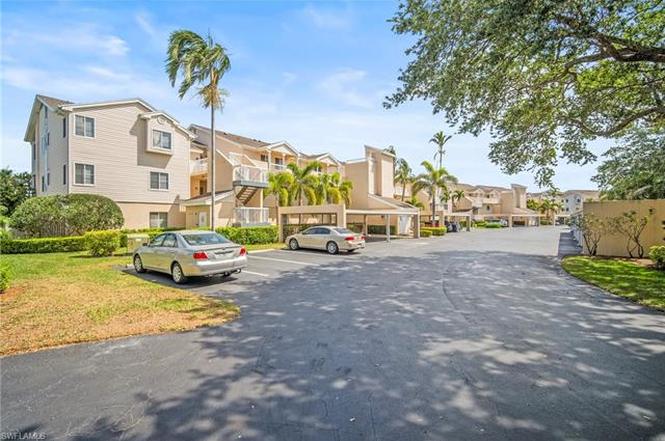
2651 Citrus Lake Dr Unit D203 · Pelican Marsh, FL
Flood risk 7/10 · Major
- FEMA flood zone
- X (shaded)
- Chance of flooding over 30 yrs
- 0.98%
- Est. flood insurance / yr
- $507 – $1,088
Fire risk 1/10 · Minimal
- Est. fire insurance / yr
- $947 – $1,759
Heat risk 10/10 · Severe
- Hot days now (above 107°F)
- 6 days/yr
- Hot days in 30 yrs
- 25 days/yr
Wind risk 10/10 · Severe
- Chance of severe wind over 30 yrs
- 99.0%
Air-quality risk 2/10 · Minimal
- Unhealthy air days now
- 2 days/yr
- Unhealthy air days in 30 yrs
- 2 days/yr
Risk factors via First Street. Map © Google.
Why this score? — see what drove the C+ grade
The composite is a weighted blend of 9 inputs, each scored 0–100. Each bar is that input's sub-score; the figure is the points it added to the 100-point composite (weight × sub-score).
- Cash flow +21.2/30.0
- 1% rule +8.8/10.0
- ARV discount +7.5/15.0
- DSCR +6.8/10.0
- Appreciation +5.1/10.0
- Schools +5.0/10.0
- Condition / age +3.8/5.0
- Rent growth +2.7/5.0
- Livability +2.5/5.0
$275,000
🖨 Deal sheet 📄 Offer letter ✓ Due diligence
Listing remarks
Enjoy serene lake views from this 2-bedroom, 2-bath, condo in sought-after Lakeside of Naples. This 2nd floor unit with 1,249 square feet of living space is bright and spacious with large sets of sliders and windows that allow lake views from nearly every room. Neutral tile and beautiful wood floors can be found throughout. A spacious kitchen features ample cabinetry and stainless steel appliances. The spacious primary suite offers an en-suite bath with dual vanities and a walk-in shower. Additional highlights include plantation shutters in both bedrooms, in-residence laundry, and a dedicated carport. Residents enjoy access to an array of amenities including billiard, bocce, a clubhouse wit
Key facts
- In-residence laundry
- Lake views
- Spacious kitchen
Tags
Property features AI
Finance
- Other: Condo complex has 396 units; 18 units in the building; 2 units per floor; building has 1 floor; Unit/lot number 203; Restrictions: Deeded, no commercial, no RV
- Financial info: Quarterly condo fee reported
- HOA & community: Mandatory HOA (professional management); Quarterly condo fee; HOA maintenance covers insurance, irrigation water, lawn/land maintenance, legal/accounting, manager, master association fee, exterior pest control, recreation facilities, sewer, street lights, street maintenance, trash removal and water; Community amenities include clubhouse, community pool and spa, exercise room, tennis, pickleball, basketball, bocce, shuffleboard, fishing pier, library, billiards, play area, sauna, BBQ/picnic, sidewalks and underground utilities; Community types: boating, gated, condo/hotel, tennis
Exterior
- Parking: Detached carport (1 car)
- Utilities: Central water; Central sewer; Cable available
- Home design: Residential low-rise (1–3 stories); Traditional design; Zero lot line; Rear exposure faces north; Part of Lakeside development
- Construction: Built in 1990; Wood frame construction; Stucco exterior; Shingle roof; Single-hung windows
- Exterior features: Automatic sprinkler system; Lake view; Lake waterfront; Irrigation from lake/canal and reclaimed water
Interior
- Kitchen: Dishwasher; Microwave; Range; Refrigerator/Freezer
- Bedrooms: 2 bedrooms (split bedroom floor plan)
- Flooring: Tile; Wood
- Bathrooms: 2 full bathrooms; Master bathroom with dual sinks and shower only
- Heating & cooling: Central electric heat; Central electric cooling; Ceiling fans
- Interior features: Smoke detectors; Window coverings; Dining area in living room; Screened balcony; Common elevator
- Laundry & utility: Washer; Dryer; Laundry in residence
Neighborhood map
What this means for you Summary
Snapshot
- This is a 2-bed/2.0-bath condo listed at $275k. Condition is rated good.
Deal economics
- At list price, monthly cash flow is $332 ($4k/yr) — positive.
- The deal already cash-flows at list — no discount required.
- Meets the 1% rule at list price ($4k rent vs $275k).
- Recommended offer: $242k (12.0% below list) — sets the bar for market timing.
Location & tenants
- Location reads: area grade C — affects rentability + tenant quality, not the cash-flow math above.
- Collier (suburban): math 60% / reading 56% proficiency, ranked #16 of 73 in FL (top 22%) — acceptable for families but not a draw, mixed tenant base, ~2y average lease.
- Market conditions: Rents flat; 424 active listings in the ZIP; 40 comparable units currently listed for rent nearby; rentals at typical pace (median 21d on market — plan ~3-4 weeks tenant-placement turnaround); solid renter incomes; 3,520 units permitted in Collier County in 2024 (959 in 5+ unit buildings).
- At $3,803/mo this rent would consume 49% of the median local household income ($92k/yr) (locally 1712% of renters already pay >50% of income on rent) — very limited rent-growth headroom before tenants either downsize or default.
Forward outlook
- In year one you build about $3k of equity ($2k loan paydown + $811 appreciation (0.3% local appreciation)).
- Collier County population projected at +30% by 2050 — long-run rental-demand tailwind backs the buy-and-hold thesis.
- By year 10, paydown + projected appreciation supports a ~$33k cash-out refi (75% LTV) — recoverable capital for the next deal without selling this one.
Negotiation context
- It's been on market 421 days — a 12% lower offer ($242k) is reasonable based on typical stale-listing flexibility.
Risks & watch-outs
- Watch-outs: flood insurance adds $66/mo.
- Climate carrying-cost: major flood risk; severe wind risk, 99% chance of damaging wind over 30y; extreme-heat days projected 6→25/yr by 2055 (HVAC capex compounding) — expect insurance premiums to compound above CPI over the hold.
Questions for the listing agent
- It's been on market 421 days. Have you received any prior offers? Is the seller open to a 12% concession, seller financing, or rate buy-down credit?
- What's the actual annual flood-insurance premium (NFIP or private), and is the property in a SFHA with mandatory coverage?
- What does the HOA fee cover, when was the last increase, and are there any pending special assessments or reserve-fund shortfalls?
- Any open or pending special assessments — roof, HVAC, plumbing, elevator, façade? What's the per-unit balance and payoff schedule, and is the seller paying it off at close or rolling it to the buyer?
- Why hasn't it sold? Are there any deal-killer items the seller is aware of (foundation, flood, title, zoning, code violations)?
- Is there a deadline driving the sale (1031 exchange, divorce, estate, relocation)? That informs how much negotiation room exists.
- This sits on a lake — are riparian / water-frontage rights deeded with the parcel? Any dock permits, shoreline easements, or HOA water-use restrictions?
- What's the documented flood / surge / shoreline-erosion history here (FEMA AND non-FEMA — e.g., storm surge, creek backup, septic-field saturation)?
- Any water-quality or seasonal algae-bloom issues that affect tenant satisfaction or short-term-rental demand?
- What's the average days-on-market for RENTAL listings here right now (not sales)? A rising rental-DOM trend means longer vacancies and softer asking-rent achievability than the comps imply.
- What's the recent tenant-quality profile in this submarket — average credit score on applications, eviction rate, late-payment / NSF rate, and stable-employment percentage? A property-management company in the area should have these aggregated.
- How much new apartment / multifamily construction is in the pipeline within 1–3 miles? Heavy new supply (>2% of stock underway) typically softens rents 12–24 months out; light construction supports rent growth.
Investment metrics
- 1% rule
- 1.38% ✓
- Cap rate
- 8.03%
- Cash-on-cash
- 6.21%
- DSCR
- 1.28
- GRM
- 6.0
CMA / ARV
No comps found within radius.
Projected returns pro-forma
0.29% appreciation · 0.92% rent growth · sell at horizon
- IRR
- 2.6%
- Equity multiple
- 1.13×
- Total profit
- $9,679
- Equity at exit
- $83,930
- IRR
- 5.9%
- Equity multiple
- 1.62×
- Total profit
- $47,607
- Equity at exit
- $104,204
Cash invested: $77,000 (down + closing). Projections, not guarantees.
Landlord ↔ Tenant lean methodology
- Overall (STATE)
- 87 Strongly Landlord-Friendly
- State Florida
- 87 Strongly Landlord-Friendly · R+3
- County
- — inherits STATE
- City
- — inherits STATE
ZIP-level market 34109
- Home prices YoY
- 0.1%
- Rents YoY
- 0.9%
- Active inventory
- 424
- Price-to-rent
- 6.0×
Monthly cashflow live
- Estimated rent
- $3,803 high interval (Pro) →
- Mortgage (P&I)
- −$1,442
- Tax est. 1.5%
- −$344 /mo · $4,125/yr
- Insurance
- −$115
- Flood insurance flood zone
- −$66 /mo · $798/yr
- HOA
- −$705
- Vacancy / Maint / Mgmt
- −$799
- Net cashflow
- $332
Break-even live
UW: 25.0% down · 7.5% · 30yr · 1.5% tax · 5.0% vac · 8.0% maint · 8.0% mgmt
Financing live
Cash to close
- Down payment
- $68,750
- Closing costs
- $8,250
- Reserves months
- —
- Total cash needed
- —
Loan-product check · same deal, 3 products live
Conventional
25% down · 7.5% · 30yr
- Down + closing
- —
- Monthly P&I
- —
- Monthly cashflow
- —
- DSCR
- —
- Eligible?
- —
Personal DTI + credit; lowest rate.
DSCR
20% down · 8.5% · 30yr
- Down + closing
- —
- Monthly P&I
- —
- Monthly cashflow
- —
- DSCR
- —
- Eligible?
- —
No personal income docs; deal must DSCR.
Hard money
10% down · 12.0% · 12mo
- Down + closing
- —
- Monthly P&I
- —
- Monthly cashflow
- —
- DSCR
- —
- Eligible?
- —
Short-term bridge; refi at stabilization.
Rent comps 40 comps
| Address | Beds | Baths | Sqft | Rent | $/sqft | DOM | Units | Dist |
|---|---|---|---|---|---|---|---|---|
| 2651 Citrus Lake Dr Unit D302 Naples, FL | 2.0 | 2.0 | 1250 | $5,000 | $4.00 | 14d | 1 | 0.03mi |
| 2671 Citrus Lake Dr Unit E-201 Naples, FL | 3.0 | 2.0 | 1380 | $5,250 | $3.80 | 14d | 1 | 0.04mi |
| 2671 Citrus Lake Dr Unit E-303 Naples, FL | 2.0 | 2.0 | 1380 | $3,500 | $2.54 | 14d | 1 | 0.04mi |
| 2711 Citrus Lake Dr Unit F305 Naples, FL | 3.0 | 2.0 | 1480 | $5,500 | $3.72 | 14d | 1 | 0.06mi |
| 2711 Citrus Lake Dr Unit F302 Naples, FL | 2.0 | 2.0 | 1272 | $4,500 | $3.54 | 14d | 1 | 0.06mi |
| 2731 Citrus Lake Dr #202 Naples, FL | 2.0 | 2.0 | 1260 | $2,500 | $1.98 | 14d | 1 | 0.09mi |
| 2608 Sailors Way #122 Naples, FL | 2.0 | 2.0 | 1387 | $5,500 | $3.97 | 23d | 1 | 0.26mi |
| 2885 Citrus Lake Dr Unit N103 Naples, FL | 2.0 | 2.0 | 1249 | $5,250 | $4.20 | 14d | 1 | 0.29mi |
| 2864 Mizzen Way Unit Y106 Naples, FL | 2.0 | 2.0 | 1350 | $5,200 | $3.85 | 14d | 1 | 0.30mi |
| 7416 Plumbago Bridge Rd #103 Naples, FL | 2.0 | 2.0 | 1223 | $2,400 | $1.96 | 14d | 1 | 0.32mi |
| 3035 Horizon Ln #2206 Naples, FL | 2.0 | 2.0 | 1246 | $6,000 | $4.82 | 23d | 1 | 0.35mi |
| 3051 Horizon Ln #1803 Naples, FL | 2.0 | 2.0 | 1482 | $5,100 | $3.44 | 23d | 1 | 0.35mi |
| 2460 Old Groves Rd Unit E102 Naples, FL | 2.0 | 2.0 | 1226 | $2,400 | $1.96 | 14d | 1 | 0.41mi |
| 2516 Orchid Bay Dr #203 Naples, FL | 2.0 | 2.0 | 1360 | $4,750 | $3.49 | 23d | 1 | 0.43mi |
| 7287 Mill Pond Cir Naples, FL | 3.0 | 2.0 | 1355 | $3,800 | $2.80 | 23d | 1 | 0.45mi |
| 3015 Horizon Ln #2702 Naples, FL | 3.0 | 2.0 | 1399 | $1,790 | $1.28 | 23d | 1 | 0.46mi |
| 7518 Silver Trumpet Ln Unit Q102 Naples, FL | 2.0 | 2.0 | 1300 | $2,600 | $2.00 | 14d | 1 | 0.51mi |
| 7546 Mill Pond Cir Naples, FL | 3.0 | 2.0 | 1373 | $6,500 | $4.73 | 23d | 1 | 0.53mi |
| 3009 Driftwood Way #2802 Naples, FL | 3.0 | 2.0 | 1399 | $2,000 | $1.43 | 23d | 1 | 0.54mi |
| 2585 Old Groves Rd Unit L203 Naples, FL | 2.0 | 2.0 | 1448 | $5,500 | $3.80 | 14d | 1 | 0.59mi |
| 7800 Emerald Cir #104 Naples, FL | 2.0 | 2.0 | 1022 | $2,200 | $2.15 | 21d | 1 | 0.59mi |
| 7800 Emerald Cir Unit B104 Naples, FL | 2.0 | 2.0 | 1022 | $2,200 | $2.15 | 14d | 1 | 0.59mi |
| 3017 Driftwood Way #3001 Naples, FL | 3.0 | 2.0 | 1385 | $5,000 | $3.61 | 23d | 1 | 0.59mi |
| 7794 Emerald Cir Unit A-102 Naples, FL | 2.0 | 2.0 | 1022 | $4,000 | $3.91 | 14d | 1 | 0.59mi |
| 7791 Esmeralda Way #203 Naples, FL | 2.0 | 2.0 | 1022 | $1,950 | $1.91 | 14d | 1 | 0.60mi |
| 6654 Tannin Ln Unit B Naples, FL | 2.0 | 2.0 | 1441 | $3,100 | $2.15 | 23d | 1 | 0.61mi |
| 2277 Arbour Walk Cir Naples, FL | 1.0–2.0 | 1.0–2.0 | 937 | $2,540 | $2.71 | 14d | 25 | 0.62mi |
| 3025 Driftwood Way #3203 Naples, FL | 2.0 | 2.0 | 1248 | $3,900 | $3.12 | 23d | 1 | 0.64mi |
| 7778 Emerald Cir #204 Naples, FL | 3.0 | 2.0 | 1199 | $6,750 | $5.63 | 14d | 1 | 0.66mi |
| 7778 Emerald Cir #104 Naples, FL | 3.0 | 2.0 | 1199 | $2,300 | $1.92 | 21d | 1 | 0.66mi |
| 3029 Driftwood Way #3303 Naples, FL | 2.0 | 2.0 | 1248 | $4,000 | $3.21 | 23d | 1 | 0.67mi |
| 3037 Driftwood Way #3505 Naples, FL | 2.0 | 2.0 | 1248 | $2,500 | $2.00 | 23d | 1 | 0.70mi |
| 2226 Arbour Walk Cir #1913 Naples, FL | 1.0 | 1.0 | 740 | $1,475 | $1.99 | 23d | 1 | 0.70mi |
| 7754 Emerald Cir Unit T202 Naples, FL | 2.0 | 2.0 | 1022 | $3,850 | $3.77 | 14d | 1 | 0.74mi |
| 7712 Jewel Ln Naples, FL | 2.0 | 2.0 | 1022 | $1,850 | $1.81 | 23d | 1 | 0.76mi |
| 7707 Jewel Ln #201 Naples, FL | 3.0 | 2.0 | 1199 | $2,900 | $2.42 | 23d | 1 | 0.78mi |
| 2118 Arbour Walk Cir Naples, FL | 1.0 | 1.0 | 750 | $1,300 | $1.73 | 23d | 1 | 0.78mi |
| 2602 Fountain View Cir Naples, FL | 1.0–2.0 | 1.0–2.0 | 995 | $2,277 | $2.29 | 13d | 41 | 0.79mi |
| 7719 Jewel Ln #103 Naples, FL | 2.0 | 2.0 | 1022 | $3,800 | $3.72 | 23d | 1 | 0.80mi |
| 2130 Arbour Walk Cir #2724 Naples, FL | 2.0 | 2.0 | 1022 | $1,800 | $1.76 | 23d | 1 | 0.82mi |
HOA detail condo
- Monthly dues
- $705 · $8,460/yr
- Assessments
- None detected in remarks — confirm with the listing agent.
Listing history 10 events
-
2026-06-18days on market $275,000 Active 421 DOM
-
2026-06-17days on market $275,000 Active 420 DOM
-
2026-06-16days on market $275,000 Active 419 DOM
-
2026-06-15days on market $275,000 Active 418 DOM
-
2026-06-10days on market $275,000 Active 413 DOM
-
2026-06-09days on market $275,000 Active 412 DOM
-
2026-06-08days on market $275,000 Active 411 DOM
-
2026-06-07days on market $275,000 Active 410 DOM
-
2026-06-03remarks 699-char remark
-
2026-06-03$275,000 Active 405 DOM
ⓘ Source: listings_history table (triggers on properties + properties_extension) + one-shot
backfill from property_details.listing_events for pre-trigger history.
Climate risk First Street
- Flood 7/10 Severe FEMA zone X (shaded) · 98% chance over 30 yrs
- Wildfire 1/10 Low
- Heat 10/10 Extreme 6 d/yr ≥107°F today · 25 d/yr by 30 yrs out
- Wind 10/10 Extreme 99% chance of damaging wind over 30 yrs
- Air quality 2/10 Low 2 unhealthy d/yr today · 2 by 30 yrs out
Nearby sold comps map
Loading sold comps map…
Walkable amenities ~0.75 mi
Loading nearby amenities…
Taxation est. · year 1
- Rental income
- $45,632
- − Mortgage interest
- −$15,404
- − Property taxes
- −$4,125
- − Insurance
- −$2,172
- − Repairs & maintenance
- −$3,651
- − Management
- −$3,651
- − HOA
- −$8,460
- − Depreciation
- −$8,000
- Taxable income
- $169
- Est. tax owed @ 24.0%
- −$40
- After-tax cash flow
- $3,945/yr
For passive investors: Depreciation is non-cash, so a rental often shows a tax loss while cash-flowing — sheltering income. Rental losses are passive: they offset passive income freely, and up to $25,000/yr can offset ordinary (W-2) income if you actively participate and your MAGI is under $100k (phasing out to $0 by $150k); unused losses carry forward. On sale, claimed depreciation is recaptured at up to 25%, and gains may owe capital-gains tax (a 1031 exchange can defer both). Figures are a year-1 estimate at your 24.0% rate — not tax advice; consult a CPA.
Condition & rehab AI · 13 photos
This 2-bedroom, 2-bath condo is in good condition with no major repairs needed. It has a good exterior, interior, and HVAC system, and is located in a desirable area with lake views. The property is move-in ready and would benefit from some cosmetic updates to enhance its curb appeal and rental value.
Value-add opportunities
- Resale Paint the exterior walls — Painting the exterior walls can enhance the curb appeal and make the property more attractive to potential buyers.
- Rental Replace the HVAC filters — Replacing the HVAC filters can improve air quality and reduce energy costs, making the property more appealing to renters.
Renovation cost estimate screening
Value-add ROI direction
- Resale Paint the exterior walls — Painting the exterior walls can enhance the curb appeal and make the property more attractive to potential buyers. ↑
- Rental Replace the HVAC filters — Replacing the HVAC filters can improve air quality and reduce energy costs, making the property more appealing to renters. ↑
ⓘ Cost ranges are severity-bucket heuristics (US national rule-of-thumb). Get contractor quotes + a written scope before underwriting a rehab budget.
Schools (NCES district)
- District
- Collier
- NCES district ID
- 1200330
- Math proficiency
- 60% ▼ -4.00%
- Reading proficiency
- 56% ▼ -2.00%
- Median HH income
- $58,275
- Composite
- 50.23/100
- National rank
- #1892
- State rank
- #16 of 73 in FL
Livability — Pelican Marsh
No livability data for this city. (Only ~50 U.S. cities are tracked.)
Census & demographics
- County
- Collier County · 396,295 people
- Metro
- Naples-Marco Island, FL
- Population (ZIP)
- 27,273
- Household income
- $92,259
- Rent vs Own
- Severe rent burden
- 1712.0
Population outlook (Collier County) Hauer SSP2
- Today (2025)
- 420,858 people
- By 2030
- 450,054 · +6.9%
- By 2040
- 502,232 · +19.3%
- By 2050
- 544,932 · +29.5%
- By 2075
- 627,203 · +49.0%
- By 2100
- 659,015 · +56.6%
Race, ethnicity, and origin ACS 2023
- Neighborhood character
- Predominantly White (78%)
- Race & ethnicity
- White 78% Hispanic / Latino 11% Two or more races 9% Black 4% Asian 4%
- Hispanic origin (detail)
- Mexican 1% Puerto Rican 1% Cuban 3%
- Common ancestry
- Romanian 5% Scotch-Irish 3% Lithuanian 2%
- Foreign-born
- 20% · Canada, Jamaica, Vietnam
- Languages at home
- 77% English-only · Spanish 10% Other Indo-European 5% Russian/Polish/Slavic 3%
Political lean MEDSL · Collier
- 2024 margin
- Solid R (+33.1) · D 33.1% · R 66.2%
- 2008→2024 swing
- -10.6pp toward R · 2008: -22.5pp · 2024: -33.1pp
- All cycles
- 2024: R+33.1 2020: R+24.7 2016: R+26.0 2012: R+30.1 2008: R+22.5
Not yet ingested
- Civics
- —
Market trends
- HPI YoY
- ▲ 0.29%
- Current HPI
- 279.357
- Rent YoY
- ▲ 0.92%
- Metro
- Naples-Marco Island, FL
- State GDP YoY
- ▲ 3.28%
- F500 in state
- 36
Industry mix (Fortune 500 HQ in FL)
| Industry | F500 HQs | Revenue |
|---|---|---|
| Industrial Technology | 2 | $29B |
|
||
| Insurance | 2 | $17B |
|
||
| Retail | 1 | $60B |
|
||
| Technology Distribution | 1 | $58B |
|
||
| Homebuilding | 1 | $35B |
|
||
| Technology Manufacturing | 1 | $35B |
|
||
Price history
-15.4% since first listed2 events — show timeline
- 2025-11-14 Price Changed $275,000 NAPLESMLS
- 2025-04-23 Listed $325,000 NAPLESMLS
Cash-flow waterfall
monthlySold comps — $/sqft
last 12 mo · ≤1 miLoading sold comps…