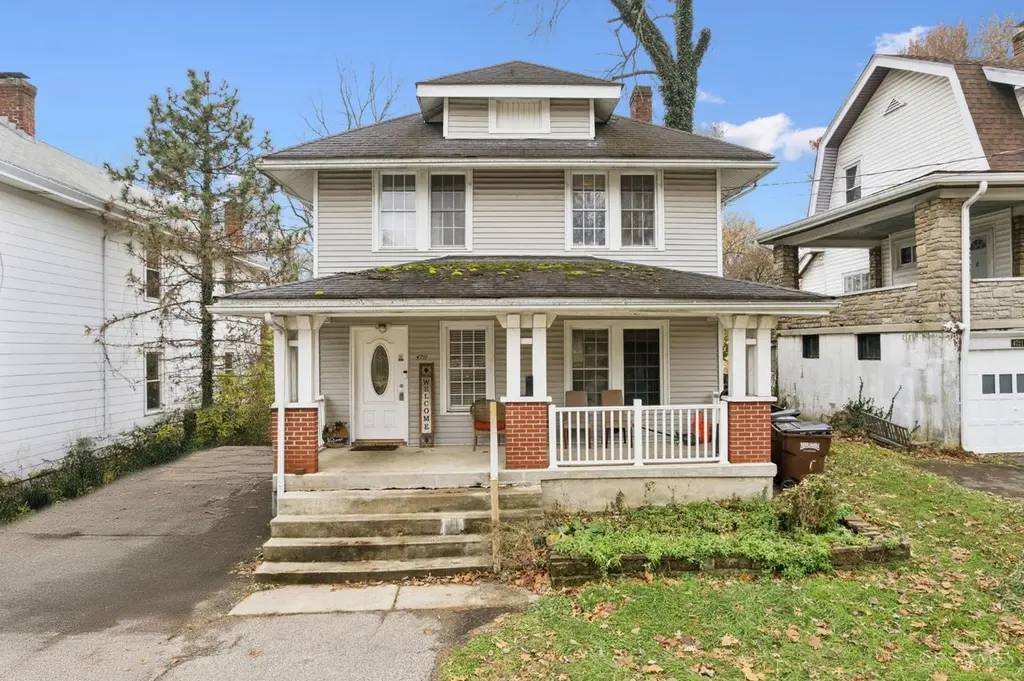
4711 Foley Rd · Cincinnati, OH
Flood risk 1/10 · Minimal
- FEMA flood zone
- X (unshaded)
- Chance of flooding over 30 yrs
- 0.0%
- Est. flood insurance / yr
- $473 – $860
Fire risk 1/10 · Minimal
- Est. fire insurance / yr
- $713 – $1,323
Heat risk 4/10 · Minor
- Hot days now (above 102°F)
- 7 days/yr
- Hot days in 30 yrs
- 19 days/yr
Wind risk 2/10 · Minimal
- Chance of severe wind over 30 yrs
- 2.0%
Air-quality risk 3/10 · Minor
- Unhealthy air days now
- 3 days/yr
- Unhealthy air days in 30 yrs
- 5 days/yr
Risk factors via First Street. Map © Google.
Why this score? — see what drove the C grade
The composite is a weighted blend of 9 inputs, each scored 0–100. Each bar is that input's sub-score; the figure is the points it added to the 100-point composite (weight × sub-score).
- Cash flow +17.5/30.0
- ARV discount +12.9/15.0
- Schools +6.0/10.0
- DSCR +5.5/10.0
- 1% rule +4.5/10.0
- Livability +4.0/5.0
- Rent growth +3.7/5.0
- Condition / age +2.5/5.0
- Appreciation +0.0/10.0
$163,500
🖨 Deal sheet 📄 Offer letter ✓ Due diligence
Listing remarks MLS
Check out this versatile opportunity in Delhi! With 3 bedrooms, 2 bathrooms, and generous living space, this home is perfect for a family looking to settle in and make it their own. The backyard deck is ready for cookouts, quiet mornings, or hosting friends. Currently tenant-occupied and producing rental income, it's also a smart addition to any investor's portfolio. Live in it, rent it, or hold it the possibilities are wide open.
Key facts
- 6,316 sq ft lot
- Built 1921
- Listed 191 days
Neighborhood map
What this means for you Summary
Snapshot
- This is a 3-bed/1.5-bath single-family listed at $164k.
Deal economics
- At list price, monthly cash flow is $126 ($2k/yr) — positive.
- The deal already cash-flows at list — no discount required.
- To meet the 1% rule (rent ≥ 1% of price), the offer needs to be $155k (5.5% below list).
- Recommended offer: $144k (12.0% below list) — sets the bar for market timing.
- Cap rate 7.2% vs local median 3.9% in Cincinnati — top-decile yield for the area; either an underpriced asset or a hidden risk that comps aren't pricing in. Stress-test before assuming the spread holds.
Location & tenants
- Location reads 80/100 on livability (#130 in OH, #1,856 nationally) — a professional / high-income tenant draw. Strengths: amenities A+, commute A+, cost of living A+; Watch: employment D, crime F.
- Oak Hills Local (suburban): math 68% / reading 70% proficiency, ranked #141 of 656 in OH (top 22%) — acceptable for families but not a draw, mixed tenant base, ~2y average lease.
- Market conditions: Rents rising fast (+4.9%/yr); 78 active listings in the ZIP; 15 comparable units currently listed for rent nearby; rentals at typical pace (median 20d on market — plan ~3-4 weeks tenant-placement turnaround); 801 units permitted in Hamilton County in 2024 (190 in 5+ unit buildings).
Forward outlook
- Local home prices are declining (-3.0%/yr); year-one equity from $1k of loan paydown is wiped out by about $5k of value loss. Plan a longer hold.
Negotiation context
- It's been on market 191 days — a 12% lower offer ($144k) is reasonable based on typical stale-listing flexibility.
- 2 sale attempts since 17y ago; this cycle's ask has dropped $12k (7%) from the opening price — seller is motivated, your offer sets the floor, not the list.
- Current owner paid $35k; list at $164k implies a 364% gain — meaningful room to come down on a strong offer.
Risks & watch-outs
- Watch-outs: built in 1921 — expect roof / HVAC / electrical / plumbing capex.
Questions for the listing agent
- It's been on market 191 days. Have you received any prior offers? Is the seller open to a 12% concession, seller financing, or rate buy-down credit?
- Built in 1921 — when were the roof, HVAC, electrical panel, plumbing, and water heater last replaced?
- Why hasn't it sold? Are there any deal-killer items the seller is aware of (foundation, flood, title, zoning, code violations)?
- Is there a deadline driving the sale (1031 exchange, divorce, estate, relocation)? That informs how much negotiation room exists.
- Schools are B-rated — typically a magnet for longer-tenancy family renters. What's the average tenant stay here, and is there a school-zone premium baked into asking?
- Crime grade is F in this area — have there been break-ins, vandalism, or insurance claims at this property in the last 3 years? What carrier currently insures it and at what premium?
- What's the average days-on-market for RENTAL listings here right now (not sales)? A rising rental-DOM trend means longer vacancies and softer asking-rent achievability than the comps imply.
- What's the recent tenant-quality profile in this submarket — average credit score on applications, eviction rate, late-payment / NSF rate, and stable-employment percentage? A property-management company in the area should have these aggregated.
- How much new for-sale + rental construction is in the pipeline within 1–3 miles? Heavy new supply typically softens prices + rents 12–24 months out; constrained supply supports both.
Investment metrics
- 1% rule
- 0.95% ✗
- Cap rate
- 7.22%
- Cash-on-cash
- 3.30%
- DSCR
- 1.15
- GRM
- 8.8
CMA / ARV
- ARV (median comp)
- $185,605
- List price
- $163,500
- Delta
- -11.91%
- Verdict
- UNDERPRICED
- Comps
- 20 within 1.0 mi
Show comp detail 12 sales within ~0.75 mi
| Address | Dist | Beds/Ba | Sqft | Sold | Price | $/sf | Match |
|---|---|---|---|---|---|---|---|
| 511 Claymore Ter | 0.13mi | 2/1.0 (-1) | 1,240 (+3%) | 1mo | $185,000 | $149 | 81 |
| 4334 W Eighth St | 0.58mi | 3/2.0 | 1,170 (-2%) | 1mo | $115,000 | $98 | 65 |
| 574 Virgil Rd | 0.45mi | 3/1.0 | 1,110 (-8%) | 1mo | $180,000 | $162 | 64 |
| 538 Roebling Rd | 0.68mi | 2/1.5 (-1) | 1,190 (-1%) | 0mo | $226,000 | $190 | 62 |
| 543 Virgil Rd | 0.44mi | 4/2.0 (+1) | 1,258 (+5%) | 4mo | $202,000 | $161 | 61 |
| 4635 Mayhew Ave | 0.55mi | 2/1.0 (-1) | 1,132 (-6%) | 2mo | $165,000 | $146 | 56 |
| 521 Roebling Rd | 0.70mi | 4/1.5 (+1) | 1,258 (+5%) | 3mo | $170,000 | $135 | 52 |
| 4457 Delhi Rd | 0.70mi | 3/1.5 | 1,332 (+11%) | 2mo | $208,000 | $156 | 47 |
| 976 Woodbriar Ln | 0.72mi | 4/2.0 (+1) | 1,295 (+8%) | 1mo | $199,900 | $154 | 46 |
| 990 Covedale Ave | 0.62mi | 4/1.0 (+1) | 1,332 (+11%) | 0mo | $220,000 | $165 | 46 |
| 1005 Covedale Ave | 0.66mi | 4/1.0 (+1) | 1,332 (+11%) | 2mo | $115,000 | $86 | 42 |
| 582 Trenton Ave | 0.63mi | 2/2.0 (-1) | 1,056 (-12%) | 2mo | $170,000 | $161 | 42 |
Match score weights: distance 35% · size 25% · config 20% · recency 20%. Top-matched comps best support the ARV.
Projected returns pro-forma
-3.0% appreciation · 4.87% rent growth · sell at horizon
- IRR
- -9.1%
- Equity multiple
- 0.66×
- Total profit
- $-15,523
- Equity at exit
- $24,378
- IRR
- 2.7%
- Equity multiple
- 1.21×
- Total profit
- $9,429
- Equity at exit
- $14,136
Cash invested: $45,780 (down + closing). Projections, not guarantees.
Landlord ↔ Tenant lean methodology
- Overall (STATE)
- 73 Landlord-Friendly
- State Ohio
- 73 Landlord-Friendly · R+6
- County
- — inherits STATE
- City
- — inherits STATE
ZIP-level market 45238
- Rents YoY
- 4.9%
- Active inventory
- 78
- Price-to-rent
- 8.8×
Monthly cashflow live
- Estimated rent
- $1,545 high interval (Pro) →
- Mortgage (P&I)
- −$857
- Tax from tax record
- −$170 /mo · $2,035/yr
- Insurance
- −$68
- HOA
- −$0
- Vacancy / Maint / Mgmt
- −$325
- Net cashflow
- $126
Break-even live
UW: 25.0% down · 7.5% · 30yr · 1.5% tax · 5.0% vac · 8.0% maint · 8.0% mgmt
Financing live
Cash to close
- Down payment
- $40,875
- Closing costs
- $4,905
- Reserves months
- —
- Total cash needed
- —
Loan-product check · same deal, 3 products live
Conventional
25% down · 7.5% · 30yr
- Down + closing
- —
- Monthly P&I
- —
- Monthly cashflow
- —
- DSCR
- —
- Eligible?
- —
Personal DTI + credit; lowest rate.
DSCR
20% down · 8.5% · 30yr
- Down + closing
- —
- Monthly P&I
- —
- Monthly cashflow
- —
- DSCR
- —
- Eligible?
- —
No personal income docs; deal must DSCR.
Hard money
10% down · 12.0% · 12mo
- Down + closing
- —
- Monthly P&I
- —
- Monthly cashflow
- —
- DSCR
- —
- Eligible?
- —
Short-term bridge; refi at stabilization.
Rent comps 15 comps
| Address | Beds | Baths | Sqft | Rent | $/sqft | DOM | Units | Dist |
|---|---|---|---|---|---|---|---|---|
| 620 Pedretti Ave Apt A8 Cincinnati, OH | 2.0 | 1.0 | 703 | $978 | $1.39 | 14d | 1 | 0.20mi |
| 543 Virgil Rd Cincinnati, OH | 4.0 | 2.0 | 1258 | $1,795 | $1.43 | 21d | 1 | 0.43mi |
| 466 Pedretti Ave Unit 472-10 Cincinnati, OH | 2.0 | 1.0 | 750 | $1,100 | $1.47 | 23d | 1 | 0.43mi |
| 4284 Foley Rd Cincinnati, OH | 3.0 | 2.0 | 1242 | $2,800 | $2.25 | 43d | 1 | 0.54mi |
| 419 Elm St Unit 419-1 Cincinnati, OH | 4.0 | 2.0 | 1200 | $1,995 | $1.66 | 19d | 1 | 0.58mi |
| 4220 Viewland Pl Cincinnati, OH | 2.0 | 1.0 | 900 | $1,495 | $1.66 | 20d | 1 | 0.71mi |
| 5039 Delhi Rd Cincinnati, OH | 1.0–2.0 | 1.0–2.0 | 952 | $1,895 | $1.99 | 1d | 10 | 0.83mi |
| 1057 Schiff Ave Unit 1057-2 Cincinnati, OH | 4.0 | 1.0 | 1000 | $1,595 | $1.59 | 14d | 1 | 0.87mi |
| 4463 Glenhaven Rd Cincinnati, OH | 2.0 | 1.0 | 775 | $1,005 | $1.30 | 43d | 1 | 1.05mi |
| 1057 Winfield Ave Unit 2 Cincinnati, OH | 2.0 | 1.0 | 1000 | $1,250 | $1.25 | 23d | 1 | 1.10mi |
| 868 Academy Ave Unit 2 Cincinnati, OH | 4.0 | 1.0 | 1100 | $1,699 | $1.54 | 23d | 1 | 1.29mi |
| 1240 Rosemont Ave Cincinnati, OH | 2.0 | 1.0 | 1280 | $1,100 | $0.86 | 20d | 1 | 1.32mi |
| 1233 Dewey Ave Cincinnati, OH | 3.0 | 1.0 | 1411 | $1,375 | $0.97 | 4d | 1 | 1.33mi |
| 1214 Gilsey Ave Cincinnati, OH | 3.0 | 1.0 | 1300 | $1,300 | $1.00 | 23d | 1 | 1.36mi |
| 1214 Gilsey Ave Cincinnati, OH | 3.0 | 1.0 | 1300 | $1,300 | $1.00 | 20d | 1 | 1.36mi |
Listing history 19 events
-
2026-06-18days on market $163,500 Active 191 DOM
-
2026-06-17days on market $163,500 Active 190 DOM
-
2026-06-16days on market $163,500 Active 189 DOM
-
2026-06-15days on market $163,500 Active 188 DOM
-
2026-06-13days on market $163,500 Active 186 DOM
-
2026-06-09days on market $163,500 Active 182 DOM
-
2026-06-08days on market $163,500 Active 181 DOM
-
2026-06-07days on market $163,500 Active 180 DOM
-
2026-06-05days on market $163,500 Active 177 DOM
-
2026-06-03days on market $163,500 Active 176 DOM
-
2026-06-02days on market $163,500 Active 175 DOM
-
2026-06-01days on market $163,500 Active 174 DOM
-
2026-05-31days on market $163,500 Active 173 DOM
-
2026-03-19price $163,500 435-char remark
Show marketing remark (435 chars)
Check out this versatile opportunity in Delhi! With 3 bedrooms, 2 bathrooms, and generous living space, this home is perfect for a family looking to settle in and make it their own. The backyard deck is ready for cookouts, quiet mornings, or hosting friends. Currently tenant-occupied and producing rental income, it's also a smart addition to any investor's portfolio. Live in it, rent it, or hold it the possibilities are wide open.
-
2025-11-25$175,000 Active 435-char remark
Show marketing remark (435 chars)
Check out this versatile opportunity in Delhi! With 3 bedrooms, 2 bathrooms, and generous living space, this home is perfect for a family looking to settle in and make it their own. The backyard deck is ready for cookouts, quiet mornings, or hosting friends. Currently tenant-occupied and producing rental income, it's also a smart addition to any investor's portfolio. Live in it, rent it, or hold it the possibilities are wide open.
-
2009-08-05soldstatus $35,200
-
2009-05-18historical
-
2009-04-16
-
2005-08-23soldstatus $62,000
ⓘ Source: listings_history table (triggers on properties + properties_extension) + one-shot
backfill from property_details.listing_events for pre-trigger history.
Tax reassessment forecast OH · Partial reset (capped growth)
- Current annual tax
- $2,035 · $170/mo
- Projected year-2 tax
- $2,293 · $191/mo
- Expected delta
- +$258/yr (+$21/mo · 12.7%)
ⓘ Screening estimate from a state-policy table — verify with the county assessor before closing.
Climate risk First Street
- Flood 1/10 Low FEMA zone X (unshaded) · 0% chance over 30 yrs
- Wildfire 1/10 Low
- Heat 4/10 Moderate 7 d/yr ≥102°F today · 19 d/yr by 30 yrs out
- Wind 2/10 Low 2% chance of damaging wind over 30 yrs
- Air quality 3/10 Moderate 3 unhealthy d/yr today · 5 by 30 yrs out
Nearby sold comps map
Loading sold comps map…
Walkable amenities ~0.75 mi
Loading nearby amenities…
Taxation est. · year 1
- Rental income
- $18,544
- − Mortgage interest
- −$9,159
- − Property taxes
- −$2,035
- − Insurance
- −$818
- − Repairs & maintenance
- −$1,484
- − Management
- −$1,484
- − Depreciation
- −$4,756
- Taxable loss
- −$1,190
- Est. tax savings @ 24.0%
- +$286
- After-tax cash flow
- $1,794/yr
For passive investors: Depreciation is non-cash, so a rental often shows a tax loss while cash-flowing — sheltering income. Rental losses are passive: they offset passive income freely, and up to $25,000/yr can offset ordinary (W-2) income if you actively participate and your MAGI is under $100k (phasing out to $0 by $150k); unused losses carry forward. On sale, claimed depreciation is recaptured at up to 25%, and gains may owe capital-gains tax (a 1031 exchange can defer both). Figures are a year-1 estimate at your 24.0% rate — not tax advice; consult a CPA.
Schools (NCES district)
- District
- Oak Hills Local
- NCES district ID
- 3904737
- Math proficiency
- 68% ▼ -11.00%
- Reading proficiency
- 70% ▼ -8.00%
- Median HH income
- $67,889
- Composite
- 60.25/100
- National rank
- #858
- State rank
- #141 of 656 in OH
Livability — Cincinnati
- Score
- 80/100
- State rank
- #130
- US rank
- #1856
Category grades
Schools grade is shown separately in the Schools card above.
Census & demographics
- County
- Hamilton County · 701,295 people
- City population
- 505,555
- Metro
- Cincinnati, OH-KY-IN
- Population (ZIP)
- 48,351
- Household income
- $66,277
- Rent vs Own
- Severe rent burden
- 2012.0
Population outlook (Hamilton County) Hauer SSP2
- Today (2025)
- 826,054 people
- By 2030
- 830,947 · +0.6%
- By 2040
- 832,319 · +0.8%
- By 2050
- 822,428 · -0.4%
- By 2075
- 788,688 · -4.5%
- By 2100
- 710,674 · -14.0%
Race, ethnicity, and origin ACS 2023
- Neighborhood character
- Majority White (64%)
- Race & ethnicity
- White 64% Black 28% Two or more races 6% Hispanic / Latino 3%
- Common ancestry
- Italian 2% Lithuanian 2% Slovak 1%
- Foreign-born
- 10% · Canada
- Languages at home
- 88% English-only · French/Haitian/Cajun 4% Spanish 2% German/W. Germanic 1%
Political lean MEDSL · Hamilton
- 2024 margin
- D (+14.9) · D 57.0% · R 42.1%
- 2008→2024 swing
- +7.9pp toward D · 2008: 7.0pp · 2024: 14.9pp
- All cycles
- 2024: D+14.9 2020: D+15.9 2016: D+9.5 2012: D+4.9 2008: D+7.0
Not yet ingested
- Civics
- —
Market trends
- HPI YoY
- ▼ -197.57%
- Current HPI
- 213.5097
- Rent YoY
- ▲ 4.87%
- Metro
- Cincinnati, OH-KY-IN
- State GDP YoY
- ▲ 1.98%
- F500 in state
- 48
Industry mix (Fortune 500 HQ in OH)
| Industry | F500 HQs | Revenue |
|---|---|---|
| Insurance | 3 | $145B |
|
||
| Industrial Machinery | 3 | $49B |
|
||
| Financial Services | 3 | $24B |
|
||
| Consumer Goods | 2 | $93B |
|
||
| Aerospace / Defense | 2 | $47B |
|
||
| Utilities | 2 | $33B |
|
||
Price history
+163.7% since first listed6 events — show timeline
- 2026-03-19 Price Changed $163,500 Cincy MLS
- 2025-11-25 Listed $175,000 Cincy MLS
- 2009-08-05 Sold (Public Records) $35,200 Public Records
- 2009-05-18 Listing Removed — Cincy MLS
- 2009-04-16 Listed — Cincy MLS
- 2005-08-23 Sold (Public Records) $62,000 Public Records
Property tax history
+9.2%/yrLatest (2025): $2,035 · +2.5% YoY. Source: county tax records.
Cash-flow waterfall
monthlySold comps — $/sqft
last 12 mo · ≤1 miLoading sold comps…