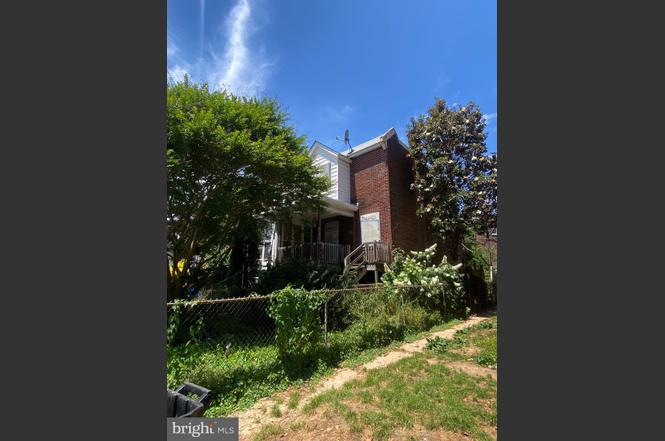
336 W 15th St · Chester, PA
Flood risk 4/10 · Minor
- FEMA flood zone
- X (unshaded)
- Chance of flooding over 30 yrs
- 0.22%
- Est. flood insurance / yr
- $473 – $860
Fire risk 1/10 · Minimal
- Est. fire insurance / yr
- $511 – $949
Heat risk 7/10 · Major
- Hot days now (above 105°F)
- 7 days/yr
- Hot days in 30 yrs
- 15 days/yr
Wind risk 6/10 · Moderate
- Chance of severe wind over 30 yrs
- 27.0%
Air-quality risk 3/10 · Minor
- Unhealthy air days now
- 2 days/yr
- Unhealthy air days in 30 yrs
- 4 days/yr
Risk factors via First Street. Map © Google.
Why this score? — see what drove the C grade
The composite is a weighted blend of 9 inputs, each scored 0–100. Each bar is that input's sub-score; the figure is the points it added to the 100-point composite (weight × sub-score).
- Cash flow +21.7/30.0
- ARV discount +8.6/15.0
- DSCR +6.9/10.0
- 1% rule +6.8/10.0
- Rent growth +4.2/5.0
- Livability +3.7/5.0
- Condition / age +2.5/5.0
- Schools +0.8/10.0
- Appreciation +0.0/10.0
$139,000
🖨 Deal sheet (PDF) 📄 Offer letter ✓ Due diligence
Listing remarks
Property is Being Sold in "AS-IS" "Where-IS" condition. Buyer responsible for any required property sales certs. Three Bedroom Home with vinyl flooring on the first floor. The kitchen is newer with white shaker cabinetry, quartz countertops, and all stainless steel appliances. The upstairs consists of three spacious bedrooms and a full bathroom. The full Basement is large and a walk out basement. This end home has a generous yard!
Key facts
- Quartz countertops
- Vinyl flooring
- Generous yard
Tags
Property features AI
Exterior
- Parking: Driveway
- Utilities: Public water; Public sewer; Natural gas for hot water
- Home design: End of row townhouse; Fee simple ownership
- Construction: Brick construction; Concrete perimeter foundation; Above grade and below grade structures
- Exterior features: Lot dimensions approximately 24 x 80
Interior
- Bedrooms: 3 bedrooms on the main level
- Bathrooms: 1 full bathroom (main level)
- Heating & cooling: Hot water heating; Natural gas heating and cooling fuel
- Interior features: Full basement
Neighborhood map
What this means for you Summary
Snapshot
- This is a 3-bed/1.0-bath townhouse listed at $139k.
Deal economics
- At list price, monthly cash flow is $214 ($3k/yr) — positive.
- The deal already cash-flows at list — no discount required.
- Meets the 1% rule at list price ($2k rent vs $139k).
Location & tenants
- Location reads 73/100 on livability (#540 in PA) — a middle-class / working-renter tenant base. Strengths: amenities A+, commute A+, cost of living A+; Watch: schools F, crime F, employment F.
- Chester-Upland SD (suburban): math 4% / reading 17% proficiency, ranked #533 of 539 in PA (top 99%) — low school quality limits family demand, transient renter base, plan for 1-2y turnover; 81% free/reduced lunch — lower-income household profile, screen leases tightly.
- Market conditions: Rents rising fast (+6.9%/yr); 140 active listings in the ZIP; 28 comparable units currently listed for rent nearby; rentals at typical pace (median 20d on market — plan ~3-4 weeks tenant-placement turnaround); lower-income renter base — watch delinquency; 299 units permitted in Delaware County in 2024 (5 in 5+ unit buildings).
- At $1,638/mo this rent would consume 48% of the median local household income ($41k/yr) (locally 2668% of renters already pay >50% of income on rent) — very limited rent-growth headroom before tenants either downsize or default.
Forward outlook
- Local home prices are declining (-3.0%/yr); year-one equity from $961 of loan paydown is wiped out by about $4k of value loss. Plan a longer hold.
- At projected returns (-3.0% appreciation + 6.9% rent growth), your $39k cash investment doubles in ~9 years — after that, you're playing with house money.
Negotiation context
- Only 6 days on market — expect competitive offers; lowballing is unlikely to land.
- 2 sale attempts since 2y ago with the ask held roughly flat each time — persistent listings suggest the price (not the market) is what's stuck; bring a comps-based counter.
- Current owner paid $43k; list at $139k implies a 223% gain — meaningful room to come down on a strong offer.
Risks & watch-outs
- Watch-outs: property tax is 2.5% of price; built in 1938 — expect roof / HVAC / electrical / plumbing capex.
- Climate carrying-cost: major wind risk, 27% chance of damaging wind over 30y; extreme-heat days projected 7→15/yr by 2055 (HVAC capex compounding) — expect insurance premiums to compound above CPI over the hold.
Questions for the listing agent
- Built in 1938 — when were the roof, HVAC, electrical panel, plumbing, and water heater last replaced?
- Property tax is high relative to price — has the assessment been appealed recently, and will the sale trigger a re-assessment?
- Is there a deadline driving the sale (1031 exchange, divorce, estate, relocation)? That informs how much negotiation room exists.
- Schools are F-rated, which usually means shorter tenancies and higher turnover. Who's the typical renter profile here, and what's been the actual vacancy rate?
- Crime grade is F in this area — have there been break-ins, vandalism, or insurance claims at this property in the last 3 years? What carrier currently insures it and at what premium?
- What's the average days-on-market for RENTAL listings here right now (not sales)? A rising rental-DOM trend means longer vacancies and softer asking-rent achievability than the comps imply.
- What's the recent tenant-quality profile in this submarket — average credit score on applications, eviction rate, late-payment / NSF rate, and stable-employment percentage? A property-management company in the area should have these aggregated.
- How much new for-sale + rental construction is in the pipeline within 1–3 miles? Heavy new supply typically softens prices + rents 12–24 months out; constrained supply supports both.
Investment metrics
- 1% rule
- 1.18% ✓
- Cap rate
- 8.14%
- Cash-on-cash
- 6.60%
- DSCR
- 1.29
- GRM
- 7.1
CMA / ARV
- ARV (on-the-fly)
- $142,560
- Comps found
- 12
Show comp detail 12 sales within ~0.75 mi
| Address | Dist | Beds/Ba | Sqft | Sold | Price | $/sf | Match |
|---|---|---|---|---|---|---|---|
| 312 W 21st St | 0.21mi | 3/1.0 | 1,152 (+9%) | 2mo | $155,000 | $135 | 73 |
| 327 W 21st St | 0.18mi | 3/1.5 | 1,152 (+9%) | 2mo | $105,312 | $91 | 73 |
| 200 W 21st St | 0.28mi | 3/1.0 | 1,152 (+9%) | 3mo | $160,000 | $139 | 69 |
| 125 W 21st St | 0.32mi | 3/1.5 | 1,152 (+9%) | 1mo | $135,000 | $117 | 67 |
| 21 W 21st St | 0.37mi | 3/1.0 | 1,151 (+9%) | 3mo | $137,500 | $119 | 65 |
| 1137 Mulberry St | 0.55mi | 3/1.5 | 1,122 (+6%) | 2mo | $235,000 | $209 | 60 |
| 2535 Lindsay St | 0.68mi | 3/1.0 | 1,088 (+3%) | 5mo | $80,000 | $74 | 59 |
| 920 Butler St | 0.72mi | 3/1.0 | 1,024 (-3%) | 3mo | $143,100 | $140 | 59 |
| 610 W 8th St | 0.70mi | 3/1.0 | 1,104 (+4%) | 5mo | $49,900 | $45 | 56 |
| 215 8th St | 0.74mi | 2/1.0 (-1) | 1,023 (-3%) | 3mo | $145,000 | $142 | 53 |
| 2419 Upland St | 0.69mi | 3/1.0 | 1,212 (+15%) | 3mo | $105,000 | $87 | 41 |
| 2534 Sandeland St | 0.67mi | 2/1.0 (-1) | 1,204 (+14%) | 4mo | $190,000 | $158 | 37 |
Match score weights: distance 35% · size 25% · config 20% · recency 20%. Top-matched comps best support the ARV.
Projected returns pro-forma
-3.0% appreciation · 6.88% rent growth · sell at horizon
- IRR
- -1.4%
- Equity multiple
- 0.94×
- Total profit
- $-2,150
- Equity at exit
- $20,725
- IRR
- 12.4%
- Equity multiple
- 2.17×
- Total profit
- $45,612
- Equity at exit
- $12,018
Cash invested: $38,920 (down + closing). Projections, not guarantees.
Landlord ↔ Tenant lean methodology
- Overall (STATE)
- 62 Landlord-Friendly
- State Pennsylvania
- 62 Landlord-Friendly · EVEN
- County
- — inherits STATE
- City
- — inherits STATE
ZIP-level market 19013
- Rents YoY
- 6.9%
- Active inventory
- 140
- Price-to-rent
- 7.1×
Monthly cashflow live
- Estimated rent
- $1,638 high interval (Pro) →
- Mortgage (P&I)
- −$729
- Tax from tax record
- −$293 /mo · $3,517/yr
- Insurance
- −$58
- HOA
- −$0
- Vacancy / Maint / Mgmt
- −$344
- Net cashflow
- $214
Break-even live
Sensitivity live
| Price | -10% $293 | -5% $253 | +0% $214 | +5% $175 | +10% $135 |
|---|---|---|---|---|---|
| Rent | -10% $85 | -5% $149 | +0% $214 | +5% $279 | +10% $343 |
| Rate | -1.0pp $284 | -0.5pp $249 | base $214 | +0.5pp $178 | +1.0pp $141 |
UW: 25.0% down · 7.5% · 30yr · 1.5% tax · 5.0% vac · 8.0% maint · 8.0% mgmt
Financing live
Cash to close
- Down payment
- $34,750
- Closing costs
- $4,170
- Reserves months
- —
- Total cash needed
- —
Loan-product check · same deal, 3 products live
Conventional
25% down · 7.5% · 30yr
- Down + closing
- —
- Monthly P&I
- —
- Monthly cashflow
- —
- DSCR
- —
- Eligible?
- —
Personal DTI + credit; lowest rate.
DSCR
20% down · 8.5% · 30yr
- Down + closing
- —
- Monthly P&I
- —
- Monthly cashflow
- —
- DSCR
- —
- Eligible?
- —
No personal income docs; deal must DSCR.
Hard money
10% down · 12.0% · 12mo
- Down + closing
- —
- Monthly P&I
- —
- Monthly cashflow
- —
- DSCR
- —
- Eligible?
- —
Short-term bridge; refi at stabilization.
Rent comps 28 comps
| Address | Beds | Baths | Sqft | Rent | $/sqft | DOM | Units | Dist |
|---|---|---|---|---|---|---|---|---|
| 330 W 21st St Chester, PA | 3.0 | 1.0 | 1152 | $1,500 | $1.30 | 44d | 1 | 0.20mi |
| 125 W 21st St Chester, PA | 4.0 | 1.5 | 1152 | $1,850 | $1.61 | 25d | 1 | 0.30mi |
| 13 E 21st St Unit A Chester, PA | 2.0 | 1.0 | 900 | $1,250 | $1.39 | 44d | 1 | 0.40mi |
| 2219 Madison St Unit B Chester, PA | 2.0 | 1.0 | 800 | $1,000 | $1.25 | 44d | 1 | 0.52mi |
| 25 W Parkway Ave Chester, PA | 3.0 | 1.0 | 1324 | $1,600 | $1.21 | 6d | 1 | 0.59mi |
| 1127 Walnut St Chester, PA | 4.0 | 1.5 | 1312 | $1,600 | $1.22 | 8d | 1 | 0.60mi |
| 814 Upland St Chester, PA | 3.0 | 1.0 | 1344 | $1,525 | $1.13 | 8d | 1 | 0.60mi |
| 314 E 24th St Chester, PA | 2.0 | 1.0–1.5 | 800 | $1,500 | $1.88 | 5d | 13 | 0.69mi |
| 2701 Madison St Chester, PA | 1.0–2.0 | 1.0 | 860 | $1,533 | $1.78 | 3d | 10 | 0.75mi |
| 2607 Edgmont Ave Unit 2F Brookhaven, PA | 2.0 | 1.0 | 850 | $1,600 | $1.88 | 25d | 1 | 0.75mi |
| 2015 Hyatt St Chester, PA | 3.0 | 1.0 | 988 | $1,950 | $1.97 | 12d | 1 | 0.76mi |
| 30 W Roland Rd Brookhaven, PA | 3.0 | 1.0 | 1424 | $1,695 | $1.19 | 44d | 1 | 0.76mi |
| 1211 Johnson St Chester, PA | 3.0 | 1.0 | 882 | $1,500 | $1.70 | 3d | 1 | 0.81mi |
| 1510 Washington Ave Chester, PA | 4.0 | 1.5 | 1280 | $2,000 | $1.56 | 19d | 1 | 0.83mi |
| 418 Penn St Chester, PA | 3.0 | 1.0 | 1250 | $1,350 | $1.08 | 44d | 1 | 0.84mi |
| 1118 Brown St Unit 318 Chester, PA | 3.0 | 1.0 | 1092 | $1,900 | $1.74 | 16d | 1 | 0.88mi |
| 1124 Thomas St Chester, PA | 3.0 | 1.0 | 1046 | $1,200 | $1.15 | 25d | 1 | 0.95mi |
| 1206 Thomas St Chester, PA | 3.0 | 1.0 | 833 | $1,399 | $1.68 | 25d | 1 | 0.98mi |
| 1944 Ridley Mill Ln Woodlyn, PA | 2.0 | 1.0 | 840 | $1,600 | $1.90 | 44d | 1 | 1.09mi |
| 925 W 3rd St Chester, PA | 4.0 | 1.0 | 1500 | $1,700 | $1.13 | 19d | 1 | 1.16mi |
| 51 Park Valley Ln Brookhaven, PA | 2.0 | 1.5 | 990 | $1,795 | $1.81 | 19d | 1 | 1.17mi |
| 89 Park Valley Ln Brookhaven, PA | 2.0 | 1.5 | 984 | $1,705 | $1.73 | 44d | 1 | 1.17mi |
| 1312 E 13th St Crum Lynne, PA | 3.0 | 1.0 | 1280 | $1,940 | $1.52 | 19d | 1 | 1.24mi |
| 1224 Elson Rd Brookhaven, PA | 3.0 | 2.0 | 1200 | $1,900 | $1.58 | 18d | 1 | 1.32mi |
| 1315 Harshaw Rd Brookhaven, PA | 3.0 | 2.5 | 1260 | $2,395 | $1.90 | 2d | 1 | 1.37mi |
| 407 Beech Rd Apt B Wallingford, PA | 2.0 | 1.0 | 998 | $1,600 | $1.60 | 44d | 1 | 1.42mi |
| 280 Bridgewater Rd Brookhaven, PA | 1.0–2.0 | 1.0–2.0 | 775 | $1,695 | $2.19 | 6d | 4 | 1.47mi |
| 280 Bridgewater Rd Brookhaven, PA | 1.0–2.0 | 1.0–1.5 | 775 | $1,800 | $2.32 | 25d | 2 | 1.47mi |
Listing history 5 events
-
2026-06-21days on market $139,000 Active 6 DOM
-
2026-06-18days on market $139,000 Active 3 DOM
-
2026-06-17days on market $139,000 Active 2 DOM
-
2026-06-15remarks 434-char remark
-
2026-06-15$139,000 Active 1 DOM
ⓘ Source: listings_history table (triggers on properties + properties_extension) + one-shot
backfill from property_details.listing_events for pre-trigger history.
Tax reassessment forecast PA · Partial reset (capped growth)
- Current annual tax
- $3,517 · $293/mo
- Projected year-2 tax
- $3,517 · $293/mo
- Expected delta
- $0/yr ($0/mo · 0.0%)
ⓘ Screening estimate from a state-policy table — verify with the county assessor before closing.
Climate risk First Street
- Flood 4/10 Moderate FEMA zone X (unshaded) · 22% chance over 30 yrs
- Wildfire 1/10 Low
- Heat 7/10 Severe 7 d/yr ≥105°F today · 15 d/yr by 30 yrs out
- Wind 6/10 Major 27% chance of damaging wind over 30 yrs
- Air quality 3/10 Moderate 2 unhealthy d/yr today · 4 by 30 yrs out
Nearby sold comps map
Loading sold comps map…
Walkable amenities ~0.75 mi
Loading nearby amenities…
Taxation est. · year 1
- Rental income
- $19,655
- − Mortgage interest
- −$7,786
- − Property taxes
- −$3,517
- − Insurance
- −$695
- − Repairs & maintenance
- −$1,572
- − Management
- −$1,572
- − Depreciation
- −$4,044
- Taxable income
- $469
- Est. tax owed @ 24.0%
- −$112
- After-tax cash flow
- $2,456/yr
For passive investors: Depreciation is non-cash, so a rental often shows a tax loss while cash-flowing — sheltering income. Rental losses are passive: they offset passive income freely, and up to $25,000/yr can offset ordinary (W-2) income if you actively participate and your MAGI is under $100k (phasing out to $0 by $150k); unused losses carry forward. On sale, claimed depreciation is recaptured at up to 25%, and gains may owe capital-gains tax (a 1031 exchange can defer both). Figures are a year-1 estimate at your 24.0% rate — not tax advice; consult a CPA.
Schools (NCES district)
- District
- Chester-Upland SD
- NCES district ID
- 4205860
- Math proficiency
- 4% ▼ -3.00%
- Reading proficiency
- 17% ▼ -6.00%
- Median HH income
- $29,790
- Composite
- 8.05/100
- National rank
- #9918
- State rank
- #533 of 539 in PA
Livability — Chester
- Score
- 73/100
- State rank
- #540
- US rank
- #5053
Category grades
Schools grade is shown separately in the Schools card above.
Census & demographics
- Census place
- Chester, PA
- County
- Delaware County · 399,863 people
- City population
- 35,064
- Metro
- Philadelphia-Camden-Wilmington, PA-NJ-DE-MD
- Population (ZIP)
- 35,064
- Household income
- $41,261
- Rent vs Own
- Severe rent burden
- 2668.0
Population outlook (Delaware County) Hauer SSP2
- Today (2025)
- 577,490 people
- By 2030
- 581,243 · +0.6%
- By 2040
- 584,700 · +1.2%
- By 2050
- 586,581 · +1.6%
- By 2075
- 598,706 · +3.7%
- By 2100
- 590,823 · +2.3%
Race, ethnicity, and origin ACS 2023
- Neighborhood character
- Predominantly Black (71%)
- Race & ethnicity
- Black 71% White 14% Hispanic / Latino 9% Two or more races 4%
- Hispanic origin (detail)
- Puerto Rican 6%
- Common ancestry
- Romanian 2%
- Foreign-born
- 4% · Canada
- Languages at home
- 92% English-only · Spanish 6%
Political lean MEDSL · Delaware
- 2024 margin
- Strong D (+23.7) · D 61.4% · R 37.6% · Other 1.0%
- 2008→2024 swing
- +2.3pp toward D · 2008: 21.4pp · 2024: 23.7pp
- All cycles
- 2024: D+23.7 2020: D+26.7 2016: D+22.0 2012: D+21.8 2008: D+21.4
Not yet ingested
- Civics
- —
Market trends
- HPI YoY
- ▼ -149.69%
- Current HPI
- 219.5173
- Rent YoY
- ▲ 6.88%
- Metro
- Philadelphia-Camden-Wilmington, PA-NJ-DE-MD
- State GDP YoY
- ▲ 1.68%
- F500 in state
- 34
Industry mix (Fortune 500 HQ in PA)
| Industry | F500 HQs | Revenue |
|---|---|---|
| Healthcare | 2 | $309B |
|
||
| Insurance | 2 | $27B |
|
||
| Telecommunications / Media | 1 | $124B |
|
||
| Industrial Distribution | 1 | $22B |
|
||
| Financial Services | 1 | $20B |
|
||
| Chemicals / Materials | 1 | $18B |
|
||
Price history
+892.9% since first listed6 events — show timeline
- 2026-06-15 Listed $139,000 BRIGHT MLS
- 2024-10-10 Rental Removed $1,760 BRIGHTMLS
- 2024-10-10 Listed for Rent $1,760 BRIGHTMLS
- 2023-10-11 Sold (Public Records) $43,000 Public Records
- 1998-06-22 Sold (Public Records) $5,000 Public Records
- 1989-01-20 Sold (Public Records) $14,000 Public Records
Property tax history
+20.0%/yrLatest (2026): $3,517 · +143.3% YoY. Source: county tax records.
Cash-flow waterfall
monthlySold comps — $/sqft
last 12 mo · ≤1 miLoading sold comps…