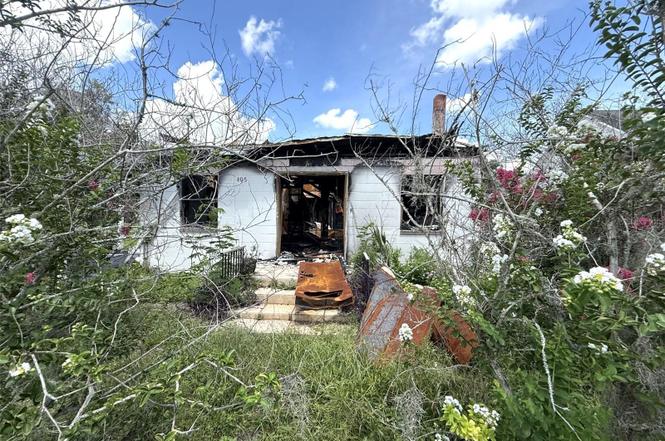
405 NW 5th Ave · Mulberry, FL
Flood risk 1/10 · Minimal
- FEMA flood zone
- X (unshaded)
- Chance of flooding over 30 yrs
- 0.0%
- Est. flood insurance / yr
- $507 – $1,088
Fire risk 5/10 · Moderate
- Est. fire insurance / yr
- $947 – $1,759
Heat risk 9/10 · Severe
- Hot days now (above 108°F)
- 7 days/yr
- Hot days in 30 yrs
- 25 days/yr
Wind risk 9/10 · Severe
- Chance of severe wind over 30 yrs
- 99.0%
Air-quality risk 2/10 · Minimal
- Unhealthy air days now
- 2 days/yr
- Unhealthy air days in 30 yrs
- 2 days/yr
Risk factors via First Street. Map © Google.
Why this score? — see what drove the D+ grade
The composite is a weighted blend of 9 inputs, each scored 0–100. Each bar is that input's sub-score; the figure is the points it added to the 100-point composite (weight × sub-score).
- Cash flow +15.0/30.0
- ARV discount +7.5/15.0
- 1% rule +5.0/10.0
- DSCR +5.0/10.0
- Livability +3.7/5.0
- Schools +3.5/10.0
- Rent growth +2.9/5.0
- Condition / age +2.5/5.0
- Appreciation +0.0/10.0
$38,000
🖨 Deal sheet 📄 Offer letter ✓ Due diligence
Listing remarks MLS
Lovely 1 bedroom 1.5 bath home that could easily be converted back to a 2 bedroom home. Home includes spacious Florida room leading into the living room. Kitchen includes small island and plenty of cabinet space. Separate dining area and laundry room with extra storage space. Huge master bedroom that has a walk in closet large enough to include a couch if getting dressed tires you! Closet used to be a second bedroom so it also has another hidden closet inside the master closet! Master bathroom is also large as it was converted from 2 bathrooms to 1 large bath with dual vanity with lots of storage space, separate shower stall and bathtub. There is a screened in back porch with sink to enjoy those breezy Florida days leading to the large backyard with mature fruit trees and large shed. This property falls within the NMTC Qualified Zone for potential investors. Welcome home!
Key facts
- 0.23 acre lot
- Parking
- Built 1926
Property features AI
Finance
- Other: Zoned R-1; Paved lot and public-maintained road access; Living area approximately 1,296 sq ft (per public records)
- Financial info: No lease restrictions
- HOA & community: No association; Pets allowed
Exterior
- Parking: Carport (1 space)
- Utilities: Public water; Public sewer; Other utilities
- Home design: Single family residence; One story; Faces west
- Construction: Block and frame construction; Metal roof; Crawlspace foundation; Built on a lot under 1/4 acre
- Exterior features: Front porch; Exterior storage
Interior
- Kitchen: No appliances included
- Bedrooms: 1 bedroom
- Flooring: Other flooring
- Bathrooms: 1 full bathroom; 1 half bathroom
- Heating & cooling: No heating; No cooling
- Interior features: Ceiling fans
- Laundry & utility: No laundry hookups/features
Neighborhood map
What this means for you Summary
Snapshot
- This is a 2-bed/1.0-bath single-family listed at $38k.
Deal economics
- At list price, monthly cash flow is $1k ($13k/yr) — positive.
- The deal already cash-flows at list — no discount required.
- Meets the 1% rule at list price ($2k rent vs $38k).
Location & tenants
- Location reads 73/100 on livability (#311 in FL) — a middle-class / working-renter tenant base. Strengths: cost of living A+, housing A+, health & safety A+; Watch: schools D, amenities F, commute F.
- Polk (suburban): math 39% / reading 43% proficiency, ranked #62 of 73 in FL (top 85%) — families likely to look elsewhere, expect single-tenant / working-renter base with shorter leases.
- Market conditions: Rents rising (+1.6%/yr); 180 active listings in the ZIP; 2 comparable units currently listed for rent nearby; 10,384 units permitted in Polk County in 2024 (1,716 in 5+ unit buildings).
- This rent runs 31% of the median local income ($66k/yr) — at the standard rent-burdened threshold; future hikes will face affordability resistance.
Forward outlook
- Local home prices are declining (-3.0%/yr); year-one equity from $263 of loan paydown is wiped out by about $1k of value loss. Plan a longer hold.
- Polk County population projected at +33% by 2050 — long-run rental-demand tailwind backs the buy-and-hold thesis.
- At projected returns (-3.0% appreciation + 1.6% rent growth), your $11k cash investment doubles in ~1 year — after that, you're playing with house money.
Negotiation context
- Only 1 days on market — expect competitive offers; lowballing is unlikely to land.
- 4 sale attempts since 23y ago with the ask held roughly flat each time — persistent listings suggest the price (not the market) is what's stuck; bring a comps-based counter.
Risks & watch-outs
- Watch-outs: built in 1926 — expect roof / HVAC / electrical / plumbing capex.
- Climate carrying-cost: severe wind risk, 99% chance of damaging wind over 30y; moderate wildfire risk; extreme-heat days projected 7→25/yr by 2055 (HVAC capex compounding) — expect insurance premiums to compound above CPI over the hold.
Questions for the listing agent
- Built in 1926 — when were the roof, HVAC, electrical panel, plumbing, and water heater last replaced?
- Is there a deadline driving the sale (1031 exchange, divorce, estate, relocation)? That informs how much negotiation room exists.
- Schools are D-rated, which usually means shorter tenancies and higher turnover. Who's the typical renter profile here, and what's been the actual vacancy rate?
- The area grade is low — what's the realistic commute time and amenity access for the typical tenant pool here? Any planned neighborhood developments (good or bad) we should know about?
- What's the average days-on-market for RENTAL listings here right now (not sales)? A rising rental-DOM trend means longer vacancies and softer asking-rent achievability than the comps imply.
- What's the recent tenant-quality profile in this submarket — average credit score on applications, eviction rate, late-payment / NSF rate, and stable-employment percentage? A property-management company in the area should have these aggregated.
- How much new for-sale + rental construction is in the pipeline within 1–3 miles? Heavy new supply typically softens prices + rents 12–24 months out; constrained supply supports both.
Investment metrics
- 1% rule
- 4.41% ✓
- Cap rate
- 39.79%
- Cash-on-cash
- 119.65%
- DSCR
- 6.32
- GRM
- 1.9
CMA / ARV
No comps found within radius.
Projected returns pro-forma
-3.0% appreciation · 1.59% rent growth · sell at horizon
- IRR
- —
- Equity multiple
- 6.55×
- Total profit
- $59,092
- Equity at exit
- $5,666
- IRR
- —
- Equity multiple
- 13.14×
- Total profit
- $129,214
- Equity at exit
- $3,286
Cash invested: $10,640 (down + closing). Projections, not guarantees.
Landlord ↔ Tenant lean methodology
- Overall (STATE)
- 87 Strongly Landlord-Friendly
- State Florida
- 87 Strongly Landlord-Friendly · R+3
- County
- — inherits STATE
- City
- — inherits STATE
ZIP-level market 33860
- Home prices YoY
- -22.4%
- Rents YoY
- 1.6%
- Active inventory
- 180
- Price-to-rent
- 1.9×
Monthly cashflow live
- Estimated rent
- $1,675 medium interval (Pro) →
- Mortgage (P&I)
- −$199
- Tax est. 1.5%
- −$48 /mo · $570/yr
- Insurance
- −$16
- HOA
- −$0
- Vacancy / Maint / Mgmt
- −$352
- Net cashflow
- $1,061
Break-even live
UW: 25.0% down · 7.5% · 30yr · 1.5% tax · 5.0% vac · 8.0% maint · 8.0% mgmt
Financing live
Cash to close
- Down payment
- $9,500
- Closing costs
- $1,140
- Reserves months
- —
- Total cash needed
- —
Loan-product check · same deal, 3 products live
Conventional
25% down · 7.5% · 30yr
- Down + closing
- —
- Monthly P&I
- —
- Monthly cashflow
- —
- DSCR
- —
- Eligible?
- —
Personal DTI + credit; lowest rate.
DSCR
20% down · 8.5% · 30yr
- Down + closing
- —
- Monthly P&I
- —
- Monthly cashflow
- —
- DSCR
- —
- Eligible?
- —
No personal income docs; deal must DSCR.
Hard money
10% down · 12.0% · 12mo
- Down + closing
- —
- Monthly P&I
- —
- Monthly cashflow
- —
- DSCR
- —
- Eligible?
- —
Short-term bridge; refi at stabilization.
Rent comps 2 comps
| Address | Beds | Baths | Sqft | Rent | $/sqft | DOM | Units | Dist |
|---|---|---|---|---|---|---|---|---|
| 181 Diesel Rd Mulberry, FL | 2.0 | 1.5 | 1300 | $1,375 | $1.06 | 23d | 1 | 0.40mi |
| 609 NE 11th Ave Mulberry, FL | 3.0 | 2.0 | 1369 | $2,000 | $1.46 | 23d | 1 | 0.86mi |
Listing history 2 events
-
2026-06-15remarks 386-char remark
-
2026-06-15$38,000 Pending 1 DOM
ⓘ Source: listings_history table (triggers on properties + properties_extension) + one-shot
backfill from property_details.listing_events for pre-trigger history.
Climate risk First Street
- Flood 1/10 Low FEMA zone X (unshaded) · 0% chance over 30 yrs
- Wildfire 5/10 Major
- Heat 9/10 Extreme 7 d/yr ≥108°F today · 25 d/yr by 30 yrs out
- Wind 9/10 Extreme 99% chance of damaging wind over 30 yrs
- Air quality 2/10 Low 2 unhealthy d/yr today · 2 by 30 yrs out
Nearby sold comps map
Loading sold comps map…
Walkable amenities ~0.75 mi
Loading nearby amenities…
Taxation est. · year 1
- Rental income
- $20,104
- − Mortgage interest
- −$2,129
- − Property taxes
- −$570
- − Insurance
- −$190
- − Repairs & maintenance
- −$1,608
- − Management
- −$1,608
- − Depreciation
- −$1,105
- Taxable income
- $12,893
- Est. tax owed @ 24.0%
- −$3,094
- After-tax cash flow
- $9,636/yr
For passive investors: Depreciation is non-cash, so a rental often shows a tax loss while cash-flowing — sheltering income. Rental losses are passive: they offset passive income freely, and up to $25,000/yr can offset ordinary (W-2) income if you actively participate and your MAGI is under $100k (phasing out to $0 by $150k); unused losses carry forward. On sale, claimed depreciation is recaptured at up to 25%, and gains may owe capital-gains tax (a 1031 exchange can defer both). Figures are a year-1 estimate at your 24.0% rate — not tax advice; consult a CPA.
Schools (NCES district)
- District
- Polk
- NCES district ID
- 1201590
- Math proficiency
- 39% ▼ -11.00%
- Reading proficiency
- 43% ▼ -4.00%
- Median HH income
- $43,979
- Composite
- 34.74/100
- National rank
- #5132
- State rank
- #62 of 73 in FL
Livability — Mulberry
- Score
- 73/100
- State rank
- #311
- US rank
- #5311
Category grades
Schools grade is shown separately in the Schools card above.
Census & demographics
- Census place
- Mulberry, FL
- County
- Polk County · 740,051 people
- City population
- 24,892
- Metro
- Lakeland-Winter Haven, FL
- Population (ZIP)
- 24,892
- Household income
- $65,710
- Rent vs Own
- Severe rent burden
- 583.0
Population outlook (Polk County) Hauer SSP2
- Today (2025)
- 752,975 people
- By 2030
- 804,621 · +6.9%
- By 2040
- 906,117 · +20.3%
- By 2050
- 1,000,476 · +32.9%
- By 2075
- 1,197,520 · +59.0%
- By 2100
- 1,271,518 · +68.9%
Race, ethnicity, and origin ACS 2023
- Neighborhood character
- Diverse neighborhood (Simpson 0.60)
- Race & ethnicity
- White 53% Hispanic / Latino 33% Two or more races 12% Black 10% Asian 1% Native American 1%
- Hispanic origin (detail)
- Mexican 19% Puerto Rican 7% Cuban 2%
- Common ancestry
- Lithuanian 2% Romanian 1% Slovak 1%
- Foreign-born
- 15% · Canada
- Languages at home
- 70% English-only · Spanish 28% Other Indo-European 1%
Political lean MEDSL · Polk
- 2024 margin
- Strong R (+20.7) · D 39.2% · R 59.9%
- 2008→2024 swing
- -14.6pp toward R · 2008: -6.1pp · 2024: -20.7pp
- All cycles
- 2024: R+20.7 2020: R+14.4 2016: R+14.1 2012: R+6.8 2008: R+6.1
Not yet ingested
- Civics
- —
Market trends
- HPI YoY
- ▼ -101.08%
- Current HPI
- 349.7266
- Rent YoY
- ▲ 1.59%
- Metro
- Lakeland-Winter Haven, FL
- State GDP YoY
- ▲ 3.28%
- F500 in state
- 36
Industry mix (Fortune 500 HQ in FL)
| Industry | F500 HQs | Revenue |
|---|---|---|
| Industrial Technology | 2 | $29B |
|
||
| Insurance | 2 | $17B |
|
||
| Retail | 1 | $60B |
|
||
| Technology Distribution | 1 | $58B |
|
||
| Homebuilding | 1 | $35B |
|
||
| Technology Manufacturing | 1 | $35B |
|
||
Price history
-61.8% since first listed12 events — show timeline
- 2026-06-15 Pending — Stellar MLS as Distributed by MLS Grid
- 2026-06-15 Listed $38,000 Stellar MLS as Distributed by MLS Grid
- 2020-04-30 Sold (Public Records) $116,000 Public Records
- 2020-04-28 Sold (MLS) $116,000 Stellar MLS as Distributed by MLS Grid
- 2020-03-02 Pending — Stellar MLS as Distributed by MLS Grid
- 2020-02-21 Price Changed $115,000 Stellar MLS as Distributed by MLS Grid
- 2019-12-01 Listed $120,000 Stellar MLS as Distributed by MLS Grid
- 2007-10-09 Sold (MLS) $58,200 Stellar MLS as Distributed by MLS Grid
- 2007-06-21 Listed $62,900 Stellar MLS as Distributed by MLS Grid
- 2004-10-19 Sold (Public Records) $94,000 Public Records
- 2004-06-22 Listing Removed — Stellar MLS as Distributed by MLS Grid
- 2003-12-22 Listed $99,500 Stellar MLS as Distributed by MLS Grid
Property tax history
+31.5%/yrLatest (2025): $3,748 · +5.2% YoY. Source: county tax records.
Cash-flow waterfall
monthlySold comps — $/sqft
last 12 mo · ≤1 miLoading sold comps…