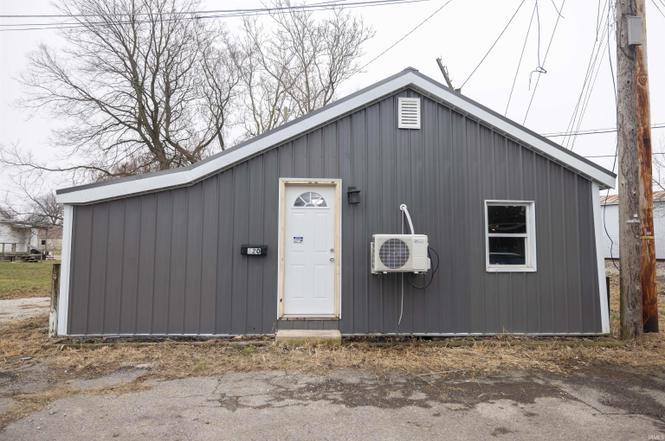
620 S Gharkey St · Muncie, IN
Flood risk 6/10 · Moderate
- FEMA flood zone
- X (unshaded)
- Chance of flooding over 30 yrs
- 0.67%
- Est. flood insurance / yr
- $507 – $1,088
Fire risk 1/10 · Minimal
- Est. fire insurance / yr
- $717 – $1,331
Heat risk 3/10 · Minor
- Hot days now (above 100°F)
- 7 days/yr
- Hot days in 30 yrs
- 18 days/yr
Wind risk 2/10 · Minimal
- Chance of severe wind over 30 yrs
- —
Air-quality risk 3/10 · Minor
- Unhealthy air days now
- 2 days/yr
- Unhealthy air days in 30 yrs
- 3 days/yr
Risk factors via First Street. Map © Google.
Why this score? — see what drove the B grade
The composite is a weighted blend of 9 inputs, each scored 0–100. Each bar is that input's sub-score; the figure is the points it added to the 100-point composite (weight × sub-score).
- Cash flow +30.0/30.0
- DSCR +10.0/10.0
- 1% rule +8.5/10.0
- Appreciation +7.6/10.0
- ARV discount +7.1/15.0
- Livability +4.0/5.0
- Rent growth +3.3/5.0
- Condition / age +2.5/5.0
- Schools +1.7/10.0
$64,900
🖨 Deal sheet 📄 Offer letter ✓ Due diligence
Listing remarks
Welcome to the quiet end of a dead-end street, where peace meets convenience. This completely renovated 2-bedroom, 1-bath home offers 756 square feet of efficient, thoughtfully updated living space. Every inch has been refreshed, giving you a move-in-ready home with modern comfort and low-maintenance living. Whether you’re starting out, downsizing, or investing, this little gem is solid, simple, and exactly what you need.
Key facts
- Modern appliances
- Updated home
- 2,439 sq ft lot
Tags
Neighborhood map
What this means for you Summary
Snapshot
- This is a 2-bed/1.0-bath single-family listed at $65k.
Deal economics
- At list price, monthly cash flow is $287 ($3k/yr) — positive.
- The deal already cash-flows at list — no discount required.
- Meets the 1% rule at list price ($873 rent vs $65k).
- Recommended offer: $59k (9.0% below list) — sets the bar for market timing.
- Cap rate 11.6% vs local median 6.0% in Muncie — top-decile yield for the area; either an underpriced asset or a hidden risk that comps aren't pricing in. Stress-test before assuming the spread holds.
Location & tenants
- Location reads 80/100 on livability (#18 in IN, #1,654 nationally) — a professional / high-income tenant draw. Strengths: amenities A+, commute A+, cost of living A+; Watch: crime F, employment F.
- Muncie Community Schools (urban): math 18% / reading 25% proficiency, ranked #275 of 301 in IN (top 91%) — low school quality limits family demand, transient renter base, plan for 1-2y turnover; 68% free/reduced lunch — lower-income household profile, screen leases tightly.
- Zoned schools: Southside Middle School (math 7% / reading 15%, grade F, #312 of 330 statewide, top 95%, 443 students, 85% FRL) — zoned schools average 85% FRL vs 68% district-wide (17 pts higher); higher-poverty schools than district average — tighter screening recommended.
- Market conditions: Rents rising (+3.3%/yr); 26 active listings in the ZIP; 40 comparable units currently listed for rent nearby; rentals lingering (median 44d on market — plan ~5-8 weeks vacancy on turnover, expect pricing pressure); 100% of comp listings sitting > 30 days — soft ceiling on asking rent; lower-income renter base — watch delinquency; 171 units permitted in Delaware County in 2024 (57 in 5+ unit buildings).
Forward outlook
- In year one you build about $4k of equity ($449 loan paydown + $3k appreciation (5.3% local appreciation)).
- Delaware County population projected at -11% by 2050 — secular population decline; favor cash flow + early exit over multi-decade hold.
- At projected returns (5.3% appreciation + 3.3% rent growth), your $18k cash investment doubles in ~3 years — after that, you're playing with house money.
- By year 9, paydown + projected appreciation supports a ~$34k cash-out refi (75% LTV) — recoverable capital for the next deal without selling this one.
Negotiation context
- It's been on market 100 days — a 9% lower offer ($59k) is reasonable based on typical stale-listing flexibility.
- 3 sale attempts since 4y ago; this cycle's ask has dropped $20k (24%) from the opening price — seller is motivated, your offer sets the floor, not the list.
Risks & watch-outs
- Watch-outs: built in 1951 — expect roof / HVAC / electrical / plumbing capex.
- Climate carrying-cost: major flood risk — expect insurance premiums to compound above CPI over the hold.
Questions for the listing agent
- It's been on market 100 days. Have you received any prior offers? Is the seller open to a 9% concession, seller financing, or rate buy-down credit?
- Built in 1951 — when were the roof, HVAC, electrical panel, plumbing, and water heater last replaced?
- Why hasn't it sold? Are there any deal-killer items the seller is aware of (foundation, flood, title, zoning, code violations)?
- Is there a deadline driving the sale (1031 exchange, divorce, estate, relocation)? That informs how much negotiation room exists.
- Schools are D-rated, which usually means shorter tenancies and higher turnover. Who's the typical renter profile here, and what's been the actual vacancy rate?
- Crime grade is F in this area — have there been break-ins, vandalism, or insurance claims at this property in the last 3 years? What carrier currently insures it and at what premium?
- What's the average days-on-market for RENTAL listings here right now (not sales)? A rising rental-DOM trend means longer vacancies and softer asking-rent achievability than the comps imply.
- What's the recent tenant-quality profile in this submarket — average credit score on applications, eviction rate, late-payment / NSF rate, and stable-employment percentage? A property-management company in the area should have these aggregated.
- How much new for-sale + rental construction is in the pipeline within 1–3 miles? Heavy new supply typically softens prices + rents 12–24 months out; constrained supply supports both.
Investment metrics
- 1% rule
- 1.35% ✓
- Cap rate
- 11.60%
- Cash-on-cash
- 18.97%
- DSCR
- 1.84
- GRM
- 6.2
CMA / ARV
- ARV (on-the-fly)
- $64,260
- Comps found
- 4
Show comp detail 4 sales within ~0.75 mi
| Address | Dist | Beds/Ba | Sqft | Sold | Price | $/sf | Match |
|---|---|---|---|---|---|---|---|
| 706 W 11th St | 0.62mi | 2/1.0 | 688 (-9%) | 6mo | $22,000 | $32 | 51 |
| 709 W 11th St | 0.65mi | 2/1.0 | 780 (+3%) | 18mo | $54,000 | $69 | 50 |
| 1605 W Main St | 0.74mi | 2/1.0 | 864 (+14%) | 0mo | $100,000 | $116 | 41 |
| 702 E Kirby Ave | 0.72mi | 2/1.0 | 820 (+8%) | 23mo | $70,000 | $85 | 33 |
Match score weights: distance 35% · size 25% · config 20% · recency 20%. Top-matched comps best support the ARV.
Projected returns pro-forma
5.27% appreciation · 3.27% rent growth · sell at horizon
- IRR
- 30.0%
- Equity multiple
- 2.90×
- Total profit
- $34,497
- Equity at exit
- $37,865
- IRR
- 28.6%
- Equity multiple
- 5.87×
- Total profit
- $88,458
- Equity at exit
- $66,266
Cash invested: $18,172 (down + closing). Projections, not guarantees.
Landlord ↔ Tenant lean methodology
- Overall (STATE)
- 90 Strongly Landlord-Friendly
- State Indiana
- 90 Strongly Landlord-Friendly · R+11
- County
- — inherits STATE
- City
- — inherits STATE
ZIP-level market 47305
- Home prices YoY
- 2.0%
- Rents YoY
- 3.3%
- Active inventory
- 26
- Price-to-rent
- 6.2×
Monthly cashflow live
- Estimated rent
- $873 high interval (Pro) →
- Mortgage (P&I)
- −$340
- Tax from tax record
- −$35 /mo · $420/yr
- Insurance
- −$27
- HOA
- −$0
- Vacancy / Maint / Mgmt
- −$183
- Net cashflow
- $287
Break-even live
UW: 25.0% down · 7.5% · 30yr · 1.5% tax · 5.0% vac · 8.0% maint · 8.0% mgmt
Financing live
Cash to close
- Down payment
- $16,225
- Closing costs
- $1,947
- Reserves months
- —
- Total cash needed
- —
Loan-product check · same deal, 3 products live
Conventional
25% down · 7.5% · 30yr
- Down + closing
- —
- Monthly P&I
- —
- Monthly cashflow
- —
- DSCR
- —
- Eligible?
- —
Personal DTI + credit; lowest rate.
DSCR
20% down · 8.5% · 30yr
- Down + closing
- —
- Monthly P&I
- —
- Monthly cashflow
- —
- DSCR
- —
- Eligible?
- —
No personal income docs; deal must DSCR.
Hard money
10% down · 12.0% · 12mo
- Down + closing
- —
- Monthly P&I
- —
- Monthly cashflow
- —
- DSCR
- —
- Eligible?
- —
Short-term bridge; refi at stabilization.
Rent comps 40 comps
| Address | Beds | Baths | Sqft | Rent | $/sqft | DOM | Units | Dist |
|---|---|---|---|---|---|---|---|---|
| 810 W 1st St Muncie, IN | 1.0 | 1.0 | 980 | $599 | $0.61 | 43d | 1 | 0.10mi |
| 1001 W 1st St Unit 1 Muncie, IN | 3.0 | 1.5 | 1098 | $875 | $0.80 | 43d | 1 | 0.20mi |
| 514 W Charles St Muncie, IN | 2.0 | 1.0 | 1062 | $800 | $0.75 | 43d | 1 | 0.24mi |
| 326 W Charles St Muncie, IN | 2.0 | 1.0 | 836 | $1,300 | $1.56 | 43d | 1 | 0.29mi |
| 522 W Adams St Muncie, IN | 2.0 | 1.0 | 750 | $810 | $1.08 | 43d | 6 | 0.31mi |
| 626 W Main St Muncie, IN | 1.0 | 1.0 | 738 | $715 | $0.97 | 43d | 2 | 0.41mi |
| 907 W Main St Apt 1 Muncie, IN | 2.0 | 1.0 | 750 | $775 | $1.03 | 43d | 1 | 0.42mi |
| 509 W 8th St Muncie, IN | 3.0 | 1.0 | 1008 | $1,325 | $1.31 | 43d | 1 | 0.43mi |
| 906 W Main St Muncie, IN | 1.0–2.0 | 1.0 | 712 | $995 | $1.40 | 43d | 3 | 0.44mi |
| 400 W Washington St Unit 101 Muncie, IN | 1.0 | 1.0 | 700 | $1,050 | $1.50 | 43d | 1 | 0.48mi |
| 400 W Washington St Unit 213 Muncie, IN | 2.0 | 2.0 | 1009 | $1,200 | $1.19 | 43d | 1 | 0.48mi |
| 1609 S Gharkey St Muncie, IN | 2.0 | 1.0 | 744 | $750 | $1.01 | 43d | 1 | 0.49mi |
| 415 W 9th St Muncie, IN | 2.0 | 1.0 | 705 | $925 | $1.31 | 43d | 1 | 0.50mi |
| 421 W 9th St Muncie, IN | 1.0 | 1.0 | 672 | $525 | $0.78 | 43d | 1 | 0.50mi |
| 1525 S Walnut St Unit 11 Muncie, IN | 2.0 | 1.0 | 800 | $775 | $0.97 | 43d | 1 | 0.57mi |
| 319 W 10th St Muncie, IN | 2.0 | 1.0 | 869 | $885 | $1.02 | 43d | 1 | 0.57mi |
| 1408 W White River Blvd Muncie, IN | 1.0 | 1.0 | 610 | $938 | $1.54 | 43d | 1 | 0.58mi |
| 1409 W Jackson St Muncie, IN | 2.0 | 1.0 | 811 | $844 | $1.04 | 43d | 1 | 0.61mi |
| 815 W Memorial Dr Muncie, IN | 2.0 | 1.0 | 800 | $750 | $0.94 | 43d | 1 | 0.69mi |
| 520 N Alameda Ave Unit A Muncie, IN | 1.0 | 1.0 | 750 | $895 | $1.19 | 43d | 1 | 0.73mi |
| 206 W 13th St Muncie, IN | 2.0 | 1.0 | 992 | $900 | $0.91 | 43d | 1 | 0.76mi |
| 1721 S Elm St Muncie, IN | 2.0 | 1.0 | 940 | $925 | $0.98 | 43d | 1 | 0.78mi |
| 301 W 13th St Muncie, IN | 1.0–2.0 | 1.0 | 725 | $844 | $1.16 | 43d | 1 | 0.79mi |
| 210 N Martin St Muncie, IN | 1.0 | 1.0 | 640 | $742 | $1.16 | 43d | 3 | 0.83mi |
| 309 S McKinley Ave Muncie, IN | 2.0 | 1.0 | 875 | $1,100 | $1.26 | 43d | 1 | 0.83mi |
| 1501 W University Ave Muncie, IN | 2.0–3.0 | 1.0 | 794 | $900 | $1.13 | 43d | 1 | 0.87mi |
| 106 N McKinley Ave Muncie, IN | 2.0 | 1.0 | 996 | $1,024 | $1.03 | 43d | 2 | 0.88mi |
| 2015 W Godman Ave Muncie, IN | 2.0 | 1.0 | 900 | $985 | $1.09 | 43d | 7 | 0.90mi |
| 216 N McKinley Ave Muncie, IN | 1.0–2.0 | 1.0 | 679 | $825 | $1.22 | 43d | 3 | 0.92mi |
| 1307 S Ebright St Unit 2 Muncie, IN | 1.0 | 1.0 | 630 | $695 | $1.10 | 43d | 1 | 0.93mi |
| 305 N Pershing Dr Muncie, IN | 3.0 | 1.0 | 1062 | $1,100 | $1.04 | 43d | 1 | 0.94mi |
| 402 N Calvert St Muncie, IN | 2.0 | 1.0–1.5 | 720 | $899 | $1.25 | 43d | 5 | 0.95mi |
| 519 N Dill St Muncie, IN | 1.0–2.0 | 1.0 | 900 | $1,125 | $1.25 | 43d | 7 | 0.95mi |
| 701 N Dicks St Unit 1&3 Muncie, IN | 2.0 | 1.5 | 920 | $1,580 | $1.72 | 43d | 1 | 0.97mi |
| 1109 E Kirby Ave Muncie, IN | 2.0–3.0 | 1.0 | 971 | $835 | $0.86 | 43d | 2 | 0.98mi |
| 701 N Dicks St Unit 4 Muncie, IN | 2.0 | 1.5 | 920 | $1,580 | $1.72 | 43d | 1 | 0.98mi |
| 816 N New York Ave Muncie, IN | 3.0–4.0 | 1.0 | 1200 | $1,000 | $0.83 | 43d | 10 | 0.98mi |
| 920 N Linden St Muncie, IN | 2.0 | 1.0 | 745 | $925 | $1.24 | 43d | 1 | 0.99mi |
| 1001 W Wayne St Muncie, IN | 3.0 | 2.0 | 1100 | $1,200 | $1.09 | 43d | 1 | 1.00mi |
| 824 W Wayne St Muncie, IN | 1.0 | 1.0 | 710 | $795 | $1.12 | 43d | 1 | 1.01mi |
Listing history 9 events
-
2026-04-21status Pending
-
2026-04-06price $64,900
-
2026-03-04price $69,900
-
2026-02-15price $74,900
-
2026-01-31status Active
-
2026-01-21status Pending
-
2025-12-31$84,900 Active
-
2022-03-24historical
-
2022-03-15$60,000
ⓘ Source: listings_history table (triggers on properties + properties_extension) + one-shot
backfill from property_details.listing_events for pre-trigger history.
Tax reassessment forecast IN · Partial reset (capped growth)
- Current annual tax
- $420 · $35/mo
- Projected year-2 tax
- $486 · $40/mo
- Expected delta
- +$66/yr (+$5/mo · 15.7%)
ⓘ Screening estimate from a state-policy table — verify with the county assessor before closing.
Climate risk First Street
- Flood 6/10 Major FEMA zone X (unshaded) · 67% chance over 30 yrs
- Wildfire 1/10 Low
- Heat 3/10 Moderate 7 d/yr ≥100°F today · 18 d/yr by 30 yrs out
- Wind 2/10 Low
- Air quality 3/10 Moderate 2 unhealthy d/yr today · 3 by 30 yrs out
Nearby sold comps map
Loading sold comps map…
Walkable amenities ~0.75 mi
Loading nearby amenities…
Taxation est. · year 1
- Rental income
- $10,475
- − Mortgage interest
- −$3,635
- − Property taxes
- −$420
- − Insurance
- −$324
- − Repairs & maintenance
- −$838
- − Management
- −$838
- − Depreciation
- −$1,888
- Taxable income
- $2,531
- Est. tax owed @ 24.0%
- −$607
- After-tax cash flow
- $2,839/yr
For passive investors: Depreciation is non-cash, so a rental often shows a tax loss while cash-flowing — sheltering income. Rental losses are passive: they offset passive income freely, and up to $25,000/yr can offset ordinary (W-2) income if you actively participate and your MAGI is under $100k (phasing out to $0 by $150k); unused losses carry forward. On sale, claimed depreciation is recaptured at up to 25%, and gains may owe capital-gains tax (a 1031 exchange can defer both). Figures are a year-1 estimate at your 24.0% rate — not tax advice; consult a CPA.
Schools (NCES district)
- District
- Muncie Community Schools
- NCES district ID
- 1807320
- Math proficiency
- 18% ▼ -9.00%
- Reading proficiency
- 25% ▼ -4.00%
- Median HH income
- $30,052
- Composite
- 17.22/100
- National rank
- #9099
- State rank
- #275 of 301 in IN
Livability — Muncie
- Score
- 80/100
- State rank
- #18
- US rank
- #1654
Category grades
Schools grade is shown separately in the Schools card above.
Census & demographics
- Census place
- Muncie, IN
- County
- Delaware County · 84,658 people
- City population
- 84,658
- Metro
- Muncie, IN
- Population (ZIP)
- 3,556
- Household income
- $36,389
- Rent vs Own
- Severe rent burden
- 336.0
Population outlook (Delaware County) Hauer SSP2
- Today (2025)
- 113,036 people
- By 2030
- 111,313 · -1.5%
- By 2040
- 106,432 · -5.8%
- By 2050
- 100,747 · -10.9%
- By 2075
- 91,000 · -19.5%
- By 2100
- 80,687 · -28.6%
Race, ethnicity, and origin ACS 2023
- Neighborhood character
- Diverse neighborhood (Simpson 0.60)
- Race & ethnicity
- White 62% Two or more races 24% Black 8% Hispanic / Latino 7%
- Hispanic origin (detail)
- Mexican 6%
- Common ancestry
- Italian 4% Iranian 1% Lithuanian 1%
- Foreign-born
- 1%
- Languages at home
- 96% English-only · Spanish 2% Arabic 1% Other Asian/Pacific 1%
Political lean MEDSL · Delaware
- 2024 margin
- R (+15.8) · D 41.2% · R 57.0% · Other 1.8%
- 2008→2024 swing
- -30.8pp toward R · 2008: 15.0pp · 2024: -15.8pp
- All cycles
- 2024: R+15.8 2020: R+13.2 2016: R+13.7 2012: D+3.1 2008: D+15.0
Not yet ingested
- Civics
- —
Market trends
- HPI YoY
- ▲ 5.27%
- Current HPI
- 269.888
- Rent YoY
- ▲ 3.27%
- Metro
- Muncie, IN
- State GDP YoY
- ▲ 2.90%
- F500 in state
- 18
Industry mix (Fortune 500 HQ in IN)
| Industry | F500 HQs | Revenue |
|---|---|---|
| Industrial Machinery | 2 | $37B |
|
||
| Healthcare | 1 | $177B |
|
||
| Pharmaceuticals | 1 | $45B |
|
||
| Metals / Steel | 1 | $18B |
|
||
| Agriculture | 1 | $17B |
|
||
| Packaging | 1 | $12B |
|
||
Price history
+8.2% since first listed9 events — show timeline
- 2026-04-21 Pending — IRMLS
- 2026-04-06 Price Changed $64,900 IRMLS
- 2026-03-04 Price Changed $69,900 IRMLS
- 2026-02-15 Price Changed $74,900 IRMLS
- 2026-01-31 Relisted — IRMLS
- 2026-01-21 Pending — IRMLS
- 2025-12-31 Listed $84,900 IRMLS
- 2022-03-24 Listing Removed — MIBOR as Distributed by MLS Grid
- 2022-03-15 Listed $60,000 MIBOR as Distributed by MLS Grid
Property tax history
+1.8%/yrLatest (2024): $420 · +103.9% YoY. Source: county tax records.
Cash-flow waterfall
monthlySold comps — $/sqft
last 12 mo · ≤1 miLoading sold comps…