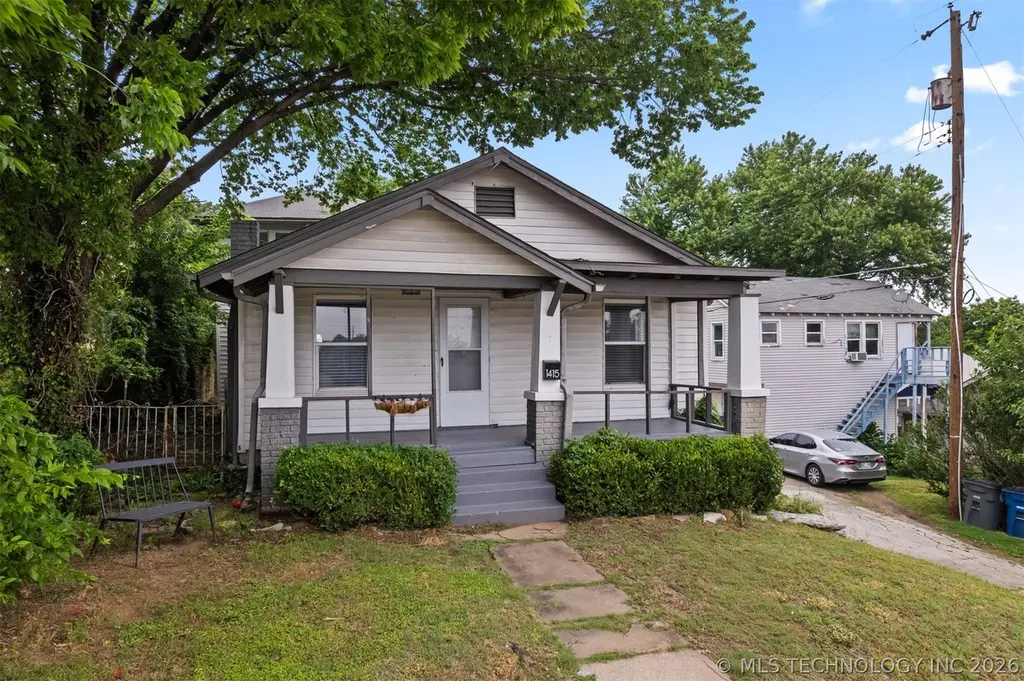
1415 W Reconciliation Way · Tulsa, OK
Flood risk 1/10 · Minimal
- FEMA flood zone
- X (unshaded)
- Chance of flooding over 30 yrs
- 0.0%
- Est. flood insurance / yr
- $507 – $1,088
Fire risk 4/10 · Minor
- Est. fire insurance / yr
- $2,463 – $4,575
Heat risk 6/10 · Moderate
- Hot days now (above 110°F)
- 7 days/yr
- Hot days in 30 yrs
- 18 days/yr
Wind risk 3/10 · Minor
- Chance of severe wind over 30 yrs
- 4.0%
Air-quality risk 2/10 · Minimal
- Unhealthy air days now
- 2 days/yr
- Unhealthy air days in 30 yrs
- 2 days/yr
Risk factors via First Street. Map © Google.
Why this score? — see what drove the C- grade
The composite is a weighted blend of 9 inputs, each scored 0–100. Each bar is that input's sub-score; the figure is the points it added to the 100-point composite (weight × sub-score).
- Cash flow +16.1/30.0
- ARV discount +15.0/15.0
- DSCR +5.0/10.0
- 1% rule +4.2/10.0
- Livability +3.8/5.0
- Rent growth +3.1/5.0
- Condition / age +2.5/5.0
- Schools +0.8/10.0
- Appreciation +0.0/10.0
$189,000
🖨 Deal sheet (PDF) 📄 Offer letter ✓ Due diligence
Listing remarks MLS
* * Possible owner financing Minimum 10% down. Also, bank loan option of 100% financing with zero PMI! Adorable hilltop bungalow with downtown views in historic Owen Park! This 4 bed 1 bath home has lots of space and abundant natural light. 4th bedroom has option as indoor laundry and primary suite boasts tons of space to add second bath. Move-in ready with options to make your own and a great price for this flourishing neighborhood.
Key facts
- Cozy fireplace
- Granite countertops
- White cabinetry
Tags
Property features AI
Finance
- HOA & community: Community gutters
Exterior
- Parking: Side-facing garage; 1-car garage with workshop area
- Security: Leased security system; Smoke detectors; No safety shelter
- Utilities: Electricity available; Natural gas available; Public water; Public sewer; High speed internet and phone available
- Home design: Faces south; Crawlspace foundation
- Construction: Stone, vinyl siding and wood frame construction; Asphalt/fiberglass roof
- Exterior features: Covered patio and porch; Concrete driveway; Rain gutters; Chain link fencing; Corner lot with mature trees; Less than 5 miles to the Arkansas River
Interior
- Kitchen: Country-style kitchen; Oven, range, stove; Disposal
- Bedrooms: First-floor bedrooms (including two with Pullman bath configuration and one bedroom with no bath); Second-floor master bedroom (no bath listed)
- Flooring: Hardwood; Tile; Vinyl
- Bathrooms: One full bathroom (hall/full bath)
- Heating & cooling: Central heating (electric); Central air conditioning
- Interior features: Fireplace (1); Vinyl, insulated and storm windows; High ceilings; Granite counters; Laminate counters; High speed internet and wired for data; Cable TV; Ceiling fan(s); Programmable thermostat; Electric oven/range connection and gas range/oven connections; Disposal
- Laundry & utility: Washer hookup; Electric dryer hookup; Utility room with garage access
Neighborhood map
What this means for you Summary
Snapshot
- This is a 4-bed/1.0-bath single-family listed at $189k.
Deal economics
- At list price, monthly cash flow is $98 ($1k/yr) — positive.
- The deal already cash-flows at list — no discount required.
- To meet the 1% rule (rent ≥ 1% of price), the offer needs to be $174k (7.8% below list).
- Recommended offer: $174k (7.8% below list) — sets the bar for 1% rule.
- Cap rate 6.9% vs local median 3.8% in Tulsa — top-decile yield for the area; either an underpriced asset or a hidden risk that comps aren't pricing in. Stress-test before assuming the spread holds.
Location & tenants
- Location reads 75/100 on livability (#13 in OK, #4,058 nationally) — a middle-class / working-renter tenant base. Strengths: amenities A+, commute A+, cost of living A+; Watch: crime F, employment D-.
- Tulsa (urban): math 7% / reading 12% proficiency, ranked #250 of 270 in OK (top 93%) — low school quality limits family demand, transient renter base, plan for 1-2y turnover; 76% free/reduced lunch — lower-income household profile, screen leases tightly.
- Zoned schools: Project Accept Traice Es (math 10% / reading 10%, grade F, #695 of 845 statewide, top 84%, 558 students, 0% FRL); Monroe Demonstration Ms (math 0% / reading 2%, grade F, #344 of 345 statewide, top 100%, 688 students, 0% FRL); Booker T. Washington Hs (math 41% / reading 61%, grade D+, #2 of 447 statewide, top 0%, 1,280 students, 0% FRL) — zoned schools average 0% FRL vs 76% district-wide (76 pts lower); this property's tenant base skews higher-income than the district average.
- Market conditions: Rents rising (+2.5%/yr); 115 active listings in the ZIP; 8 comparable units currently listed for rent nearby; rentals at typical pace (median 26d on market — plan ~3-4 weeks tenant-placement turnaround); 2,818 units permitted in Tulsa County in 2024 (518 in 5+ unit buildings).
- At $1,743/mo this rent would consume 45% of the median local household income ($46k/yr) (locally 782% of renters already pay >50% of income on rent) — very limited rent-growth headroom before tenants either downsize or default.
Forward outlook
- Local home prices are declining (-3.0%/yr); year-one equity from $1k of loan paydown is wiped out by about $6k of value loss. Plan a longer hold.
- Tulsa County population projected at +30% by 2050 — long-run rental-demand tailwind backs the buy-and-hold thesis.
Negotiation context
- It's been on market 30 days — a 2% lower offer ($186k) is reasonable based on typical stale-listing flexibility.
- 8 sale attempts since 20y ago with the ask held roughly flat each time — persistent listings suggest the price (not the market) is what's stuck; bring a comps-based counter.
Risks & watch-outs
- Watch-outs: built in 1928 — expect roof / HVAC / electrical / plumbing capex.
- Climate carrying-cost: extreme-heat days projected 7→18/yr by 2055 (HVAC capex compounding) — expect insurance premiums to compound above CPI over the hold.
Questions for the listing agent
- Built in 1928 — when were the roof, HVAC, electrical panel, plumbing, and water heater last replaced?
- Is there a deadline driving the sale (1031 exchange, divorce, estate, relocation)? That informs how much negotiation room exists.
- Schools are F-rated, which usually means shorter tenancies and higher turnover. Who's the typical renter profile here, and what's been the actual vacancy rate?
- Crime grade is F in this area — have there been break-ins, vandalism, or insurance claims at this property in the last 3 years? What carrier currently insures it and at what premium?
- What's the average days-on-market for RENTAL listings here right now (not sales)? A rising rental-DOM trend means longer vacancies and softer asking-rent achievability than the comps imply.
- What's the recent tenant-quality profile in this submarket — average credit score on applications, eviction rate, late-payment / NSF rate, and stable-employment percentage? A property-management company in the area should have these aggregated.
- How much new for-sale + rental construction is in the pipeline within 1–3 miles? Heavy new supply typically softens prices + rents 12–24 months out; constrained supply supports both.
Investment metrics
- 1% rule
- 0.92% ✗
- Cap rate
- 6.92%
- Cash-on-cash
- 2.23%
- DSCR
- 1.10
- GRM
- 9.0
CMA / ARV
- ARV (on-the-fly)
- $271,296
- Comps found
- 12
Show comp detail 12 sales within ~0.75 mi
| Address | Dist | Beds/Ba | Sqft | Sold | Price | $/sf | Match |
|---|---|---|---|---|---|---|---|
| 328 N Santa Fe Ave | 0.15mi | 3/1.0 (-1) | 1,652 (-4%) | 3mo | $227,500 | $138 | 78 |
| 104 N Union Ave | 0.21mi | 3/2.0 (-1) | 1,690 (-2%) | 4mo | $265,000 | $157 | 74 |
| 19 N Union Ave | 0.20mi | 5/3.0 (+1) | 1,769 (+2%) | 6mo | $218,000 | $123 | 69 |
| 1815 W Cameron St | 0.27mi | 3/2.0 (-1) | 1,623 (-6%) | 2mo | $240,000 | $148 | 67 |
| 212 S Phoenix Ave | 0.42mi | 3/1.5 (-1) | 1,632 (-6%) | 3mo | $212,000 | $130 | 62 |
| 308 N Tacoma Ave | 0.15mi | 3/1.0 (-1) | 1,479 (-14%) | 4mo | $117,000 | $79 | 61 |
| 1819 W Easton St | 0.31mi | 4/1.5 | 1,568 (-9%) | 9mo | $275,000 | $175 | 61 |
| 254 N Yukon Ave | 0.45mi | 4/3.0 | 1,855 (+7%) | 2mo | $293,000 | $158 | 57 |
| 557 N Tacoma Ave | 0.30mi | 3/2.0 (-1) | 1,871 (+8%) | 14mo | $342,000 | $183 | 52 |
| 647 N Union Pl | 0.51mi | 3/1.5 (-1) | 1,612 (-7%) | 8mo | $280,000 | $174 | 51 |
| 704 N Zenith Ave | 0.69mi | 3/2.0 (-1) | 1,627 (-6%) | 2mo | $265,000 | $163 | 47 |
| 408 S Phoenix Ave | 0.56mi | 4/1.5 | 1,566 (-9%) | 11mo | $180,000 | $115 | 47 |
Match score weights: distance 35% · size 25% · config 20% · recency 20%. Top-matched comps best support the ARV.
Projected returns pro-forma
-3.0% appreciation · 2.45% rent growth · sell at horizon
- IRR
- -13.4%
- Equity multiple
- 0.52×
- Total profit
- $-25,310
- Equity at exit
- $28,181
- IRR
- -5.3%
- Equity multiple
- 0.66×
- Total profit
- $-17,825
- Equity at exit
- $16,341
Cash invested: $52,920 (down + closing). Projections, not guarantees.
Landlord ↔ Tenant lean methodology
- Overall (STATE)
- 83 Strongly Landlord-Friendly
- State Oklahoma
- 83 Strongly Landlord-Friendly · R+20
- County
- — inherits STATE
- City
- — inherits STATE
ZIP-level market 74127
- Home prices YoY
- -20.4%
- Rents YoY
- 2.5%
- Active inventory
- 115
- Price-to-rent
- 9.0×
Monthly cashflow live
- Estimated rent
- $1,743 high interval (Pro) →
- Mortgage (P&I)
- −$991
- Tax from tax record
- −$209 /mo · $2,507/yr
- Insurance
- −$79
- HOA
- −$0
- Vacancy / Maint / Mgmt
- −$366
- Net cashflow
- $98
Break-even live
Sensitivity live
| Price | -10% $205 | -5% $152 | +0% $98 | +5% $45 | +10% $-9 |
|---|---|---|---|---|---|
| Rent | -10% $-39 | -5% $30 | +0% $98 | +5% $167 | +10% $236 |
| Rate | -1.0pp $194 | -0.5pp $146 | base $98 | +0.5pp $49 | +1.0pp $0 |
UW: 25.0% down · 7.5% · 30yr · 1.5% tax · 5.0% vac · 8.0% maint · 8.0% mgmt
Financing live
Cash to close
- Down payment
- $47,250
- Closing costs
- $5,670
- Reserves months
- —
- Total cash needed
- —
Loan-product check · same deal, 3 products live
Conventional
25% down · 7.5% · 30yr
- Down + closing
- —
- Monthly P&I
- —
- Monthly cashflow
- —
- DSCR
- —
- Eligible?
- —
Personal DTI + credit; lowest rate.
DSCR
20% down · 8.5% · 30yr
- Down + closing
- —
- Monthly P&I
- —
- Monthly cashflow
- —
- DSCR
- —
- Eligible?
- —
No personal income docs; deal must DSCR.
Hard money
10% down · 12.0% · 12mo
- Down + closing
- —
- Monthly P&I
- —
- Monthly cashflow
- —
- DSCR
- —
- Eligible?
- —
Short-term bridge; refi at stabilization.
Rent comps 8 comps
| Address | Beds | Baths | Sqft | Rent | $/sqft | DOM | Units | Dist |
|---|---|---|---|---|---|---|---|---|
| 209 N Xenophon Ave Unit B Tulsa, OK | 3.0 | 2.0 | 1150 | $1,500 | $1.30 | 25d | 1 | 0.33mi |
| 2521 W Cameron St Tulsa, OK | 3.0 | 1.5 | 1161 | $1,295 | $1.12 | 21d | 1 | 0.69mi |
| 424 N Boulder Ave Tulsa, OK | 1.0–3.0 | 1.0–2.5 | 1220 | $3,699 | $3.03 | 3d | 62 | 0.73mi |
| 9 E 4th St Tulsa, OK | 3.0 | 1.0–2.0 | 894 | $2,499 | $2.80 | 3d | 5 | 1.08mi |
| 1127 N Boston Ave Tulsa, OK | 4.0 | 2.0 | 1745 | $2,275 | $1.30 | 25d | 1 | 1.17mi |
| 1152 N Boston Pl Tulsa, OK | 4.0 | 2.0 | 1756 | $2,550 | $1.45 | 25d | 1 | 1.23mi |
| 1401 S Elwood Ave Tulsa, OK | 3.0 | 1.0 | 1373 | $1,850 | $1.35 | 25d | 1 | 1.34mi |
| 205 E Marshall St Tulsa, OK | 3.0 | 2.0 | 1452 | $1,725 | $1.19 | 25d | 1 | 1.35mi |
Listing history 46 events
-
2026-06-22days on market $189,000 Active 30 DOM
-
2026-06-18days on market $189,000 Active 27 DOM
-
2026-06-17days on market $189,000 Active 26 DOM
-
2026-06-16days on market $189,000 Active 25 DOM
-
2026-06-15days on market $189,000 Active 24 DOM
-
2026-06-13days on market $189,000 Active 22 DOM
-
2026-06-10days on market $189,000 Active 19 DOM
-
2026-06-09days on market $189,000 Active 18 DOM
-
2026-06-08days on market $189,000 Active 17 DOM
-
2026-06-07pricedays on market $189,000 Active 16 DOM
-
2026-06-05days on market $195,000 Active 13 DOM
-
2026-06-03days on market $195,000 Active 12 DOM
-
2026-06-02days on market $195,000 Active 11 DOM
-
2026-06-01days on market $195,000 Active 10 DOM
-
2026-05-31days on market $195,000 Active 9 DOM
-
2026-05-22$195,000 Active
-
2026-04-24historical $1,570
-
2026-04-17historical
-
2026-04-04price $1,570
-
2026-03-16$1,620
-
2026-01-07price $190,000
-
2025-12-01price $200,000
-
2025-10-17$215,000 Active
-
2023-12-28soldstatus $179,000
-
2023-12-20soldstatus $179,000 Closed 438-char remark
Show marketing remark (438 chars)
* * Possible owner financing Minimum 10% down. Also, bank loan option of 100% financing with zero PMI! Adorable hilltop bungalow with downtown views in historic Owen Park! This 4 bed 1 bath home has lots of space and abundant natural light. 4th bedroom has option as indoor laundry and primary suite boasts tons of space to add second bath. Move-in ready with options to make your own and a great price for this flourishing neighborhood.
-
2023-11-21status Pending 438-char remark
Show marketing remark (438 chars)
* * Possible owner financing Minimum 10% down. Also, bank loan option of 100% financing with zero PMI! Adorable hilltop bungalow with downtown views in historic Owen Park! This 4 bed 1 bath home has lots of space and abundant natural light. 4th bedroom has option as indoor laundry and primary suite boasts tons of space to add second bath. Move-in ready with options to make your own and a great price for this flourishing neighborhood.
-
2023-11-06status Active 438-char remark
Show marketing remark (438 chars)
* * Possible owner financing Minimum 10% down. Also, bank loan option of 100% financing with zero PMI! Adorable hilltop bungalow with downtown views in historic Owen Park! This 4 bed 1 bath home has lots of space and abundant natural light. 4th bedroom has option as indoor laundry and primary suite boasts tons of space to add second bath. Move-in ready with options to make your own and a great price for this flourishing neighborhood.
-
2023-10-31status Pending 438-char remark
Show marketing remark (438 chars)
* * Possible owner financing Minimum 10% down. Also, bank loan option of 100% financing with zero PMI! Adorable hilltop bungalow with downtown views in historic Owen Park! This 4 bed 1 bath home has lots of space and abundant natural light. 4th bedroom has option as indoor laundry and primary suite boasts tons of space to add second bath. Move-in ready with options to make your own and a great price for this flourishing neighborhood.
-
2023-10-19price $179,000 438-char remark
Show marketing remark (438 chars)
* * Possible owner financing Minimum 10% down. Also, bank loan option of 100% financing with zero PMI! Adorable hilltop bungalow with downtown views in historic Owen Park! This 4 bed 1 bath home has lots of space and abundant natural light. 4th bedroom has option as indoor laundry and primary suite boasts tons of space to add second bath. Move-in ready with options to make your own and a great price for this flourishing neighborhood.
-
2023-09-21price $184,500 438-char remark
Show marketing remark (438 chars)
* * Possible owner financing Minimum 10% down. Also, bank loan option of 100% financing with zero PMI! Adorable hilltop bungalow with downtown views in historic Owen Park! This 4 bed 1 bath home has lots of space and abundant natural light. 4th bedroom has option as indoor laundry and primary suite boasts tons of space to add second bath. Move-in ready with options to make your own and a great price for this flourishing neighborhood.
-
2023-09-08price $184,900 438-char remark
Show marketing remark (438 chars)
* * Possible owner financing Minimum 10% down. Also, bank loan option of 100% financing with zero PMI! Adorable hilltop bungalow with downtown views in historic Owen Park! This 4 bed 1 bath home has lots of space and abundant natural light. 4th bedroom has option as indoor laundry and primary suite boasts tons of space to add second bath. Move-in ready with options to make your own and a great price for this flourishing neighborhood.
-
2023-08-26$195,000 Active 438-char remark
Show marketing remark (438 chars)
* * Possible owner financing Minimum 10% down. Also, bank loan option of 100% financing with zero PMI! Adorable hilltop bungalow with downtown views in historic Owen Park! This 4 bed 1 bath home has lots of space and abundant natural light. 4th bedroom has option as indoor laundry and primary suite boasts tons of space to add second bath. Move-in ready with options to make your own and a great price for this flourishing neighborhood.
-
2021-06-22soldstatus $125,000
-
2021-01-13soldstatus $104,000
-
2020-12-21soldstatus $104,000 Closed
-
2020-11-22status Pending
-
2020-11-20$112,500 Active
-
2010-12-20soldstatus $82,000
-
2010-12-03soldstatus $82,000
-
2010-11-18historical
-
2010-09-13$82,000
-
2007-03-06soldstatus $75,500
-
2007-03-02soldstatus $75,250
-
2007-02-05historical
-
2006-12-01$74,500
-
1991-12-17soldstatus $15,000
ⓘ Source: listings_history table (triggers on properties + properties_extension) + one-shot
backfill from property_details.listing_events for pre-trigger history.
Tax reassessment forecast OK · Resets to sale price
- Current annual tax
- $2,507 · $209/mo
- Projected year-2 tax
- $2,507 · $209/mo
- Expected delta
- $0/yr ($0/mo · 0.0%)
ⓘ Screening estimate from a state-policy table — verify with the county assessor before closing.
Climate risk First Street
- Flood 1/10 Low FEMA zone X (unshaded) · 0% chance over 30 yrs
- Wildfire 4/10 Moderate
- Heat 6/10 Major 7 d/yr ≥110°F today · 18 d/yr by 30 yrs out
- Wind 3/10 Moderate 4% chance of damaging wind over 30 yrs
- Air quality 2/10 Low 2 unhealthy d/yr today · 2 by 30 yrs out
Nearby sold comps map
Loading sold comps map…
Walkable amenities ~0.75 mi
Loading nearby amenities…
Taxation est. · year 1
- Rental income
- $20,919
- − Mortgage interest
- −$10,587
- − Property taxes
- −$2,507
- − Insurance
- −$945
- − Repairs & maintenance
- −$1,674
- − Management
- −$1,674
- − Depreciation
- −$5,498
- Taxable loss
- −$1,965
- Est. tax savings @ 24.0%
- +$472
- After-tax cash flow
- $1,652/yr
For passive investors: Depreciation is non-cash, so a rental often shows a tax loss while cash-flowing — sheltering income. Rental losses are passive: they offset passive income freely, and up to $25,000/yr can offset ordinary (W-2) income if you actively participate and your MAGI is under $100k (phasing out to $0 by $150k); unused losses carry forward. On sale, claimed depreciation is recaptured at up to 25%, and gains may owe capital-gains tax (a 1031 exchange can defer both). Figures are a year-1 estimate at your 24.0% rate — not tax advice; consult a CPA.
Schools (NCES district)
- District
- Tulsa
- NCES district ID
- 4030240
- Math proficiency
- 7% ▼ -9.00%
- Reading proficiency
- 12% ▼ -7.00%
- Median HH income
- $37,895
- Composite
- 8.04/100
- National rank
- #9919
- State rank
- #250 of 270 in OK
Livability — Tulsa
- Score
- 75/100
- State rank
- #13
- US rank
- #4058
Category grades
Schools grade is shown separately in the Schools card above.
Census & demographics
- Census place
- Tulsa, OK
- County
- Osage County · 26,244 people
- City population
- 389,418
- Metro
- Tulsa, OK
- Population (ZIP)
- 16,324
- Household income
- $46,373
- Rent vs Own
- Severe rent burden
- 782.0
Population outlook (Tulsa County) Hauer SSP2
- Today (2025)
- 723,846 people
- By 2030
- 766,033 · +5.8%
- By 2040
- 851,386 · +17.6%
- By 2050
- 938,389 · +29.6%
- By 2075
- 1,166,011 · +61.1%
- By 2100
- 1,350,277 · +86.5%
Race, ethnicity, and origin ACS 2023
- Neighborhood character
- Diverse neighborhood (Simpson 0.66)
- Race & ethnicity
- White 50% Black 28% Two or more races 10% Hispanic / Latino 7% Native American 7%
- Hispanic origin (detail)
- Mexican 5%
- Common ancestry
- Slovak 2% Italian 1% Iranian 1%
- Foreign-born
- 4% · Canada, Jamaica
- Languages at home
- 94% English-only · Spanish 4%
Political lean MEDSL · Tulsa
- 2024 margin
- R (+15.2) · D 41.3% · R 56.5% · Other 2.2%
- 2008→2024 swing
- +9.2pp toward D · 2008: -24.5pp · 2024: -15.2pp
- All cycles
- 2024: R+15.2 2020: R+15.6 2016: R+22.9 2012: R+27.4 2008: R+24.5
Not yet ingested
- Civics
- —
Market trends
- HPI YoY
- ▼ -59.31%
- Current HPI
- 231.5994
- Rent YoY
- ▲ 2.45%
- Metro
- Tulsa, OK
- State GDP YoY
- ▲ 1.55%
- F500 in state
- 6
Industry mix (Fortune 500 HQ in OK)
| Industry | F500 HQs | Revenue |
|---|---|---|
| Energy | 3 | $48B |
|
||
Price history
+1200.0% since first listed31 events — show timeline
- 2026-05-22 Listed $195,000 MLS Technology, Inc.
- 2026-04-24 Rental Removed $1,570 RentEngineListings
- 2026-04-17 Listing Removed — MLS Technology, Inc.
- 2026-04-04 Price Changed $1,570 RentEngineListings
- 2026-03-16 Listed for Rent $1,620 RentEngineListings
- 2026-01-07 Price Changed $190,000 MLS Technology, Inc.
- 2025-12-01 Price Changed $200,000 MLS Technology, Inc.
- 2025-10-17 Listed $215,000 MLS Technology, Inc.
- 2023-12-28 Sold (Public Records) $179,000 Public Records
- 2023-12-20 Sold (MLS) $179,000 MLS Technology, Inc.
- 2023-11-21 Pending — MLS Technology, Inc.
- 2023-11-06 Relisted — MLS Technology, Inc.
- 2023-10-31 Pending — MLS Technology, Inc.
- 2023-10-19 Price Changed $179,000 MLS Technology, Inc.
- 2023-09-21 Price Changed $184,500 MLS Technology, Inc.
- 2023-09-08 Price Changed $184,900 MLS Technology, Inc.
- 2023-08-26 Listed $195,000 MLS Technology, Inc.
- 2021-06-22 Sold (Public Records) $125,000 Public Records
- 2021-01-13 Sold (Public Records) $104,000 Public Records
- 2020-12-21 Sold (MLS) $104,000 MLS Technology, Inc.
- 2020-11-22 Pending — MLS Technology, Inc.
- 2020-11-20 Listed $112,500 MLS Technology, Inc.
- 2010-12-20 Sold (Public Records) $82,000 Public Records
- 2010-12-03 Sold (MLS) $82,000 MLS Technology, Inc.
- 2010-11-18 Listing Removed — MLS Technology, Inc.
- 2010-09-13 Listed $82,000 MLS Technology, Inc.
- 2007-03-06 Sold (Public Records) $75,500 Public Records
- 2007-03-02 Sold (MLS) $75,250 MLS Technology, Inc.
- 2007-02-05 Listing Removed — MLS Technology, Inc.
- 2006-12-01 Listed $74,500 MLS Technology, Inc.
- 1991-12-17 Sold (Public Records) $15,000 Public Records
Property tax history
+6.9%/yrLatest (2025): $2,507 · -1.7% YoY. Source: county tax records.
Cash-flow waterfall
monthlySold comps — $/sqft
last 12 mo · ≤1 miLoading sold comps…