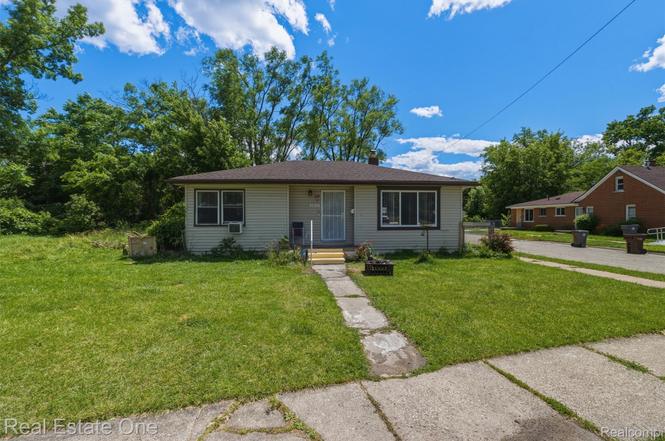
28151 Cherry St · Inkster, MI
Flood risk 4/10 · Minor
- FEMA flood zone
- X (unshaded)
- Chance of flooding over 30 yrs
- 0.22%
- Est. flood insurance / yr
- $507 – $1,088
Fire risk 1/10 · Minimal
- Est. fire insurance / yr
- $784 – $1,456
Heat risk 3/10 · Minor
- Hot days now (above 98°F)
- 7 days/yr
- Hot days in 30 yrs
- 15 days/yr
Wind risk 2/10 · Minimal
- Chance of severe wind over 30 yrs
- —
Air-quality risk 2/10 · Minimal
- Unhealthy air days now
- 1 days/yr
- Unhealthy air days in 30 yrs
- 2 days/yr
Risk factors via First Street. Map © Google.
Why this score? — see what drove the D- grade
The composite is a weighted blend of 9 inputs, each scored 0–100. Each bar is that input's sub-score; the figure is the points it added to the 100-point composite (weight × sub-score).
- Cash flow +17.6/30.0
- DSCR +5.5/10.0
- 1% rule +4.3/10.0
- Livability +3.4/5.0
- Rent growth +3.2/5.0
- Condition / age +2.5/5.0
- Schools +1.8/10.0
- ARV discount +0.0/15.0
- Appreciation +0.0/10.0
$152,000
🖨 Deal sheet (PDF) 📄 Offer letter ✓ Due diligence
Listing remarks MLS
Move-In Ready and Beautifully Maintained 3-Bedroom Home! Welcome to this charming, turnkey home offering comfort, style, and plenty of space both inside and out. The spacious primary bedroom features two closets, while all bedrooms have been recently refreshed with fresh paint. Enjoy the convenience of newer appliances throughout the home, including a washer and dryer, and a beautifully updated kitchen equipped with brand-new appliances ready for all your cooking and entertaining needs. Throughout the home, you'll find durable ceramic tile and solid hardwood flooring, adding warmth and elegance to every room. Large windows, accented with new window treatments, fill the home with natural light and create a bright, inviting atmosphere. Situated on a large corner lot, this property offers endless possibilities for creating your own outdoor oasis. The private backyard provides a peaceful retreat for relaxation, gardening, or entertaining family and friends. Additional features include an attached two-car garage and ample storage space throughout the home. Cozy yet spacious, this home is full of character and ready for its next owner. Don't miss this fantastic opportunity to own a move-in-ready property with so much to offer - schedule your showing today!
Key facts
- Hardwood flooring
- Large corner lot
- Newer appliances
Tags
Property features AI
Exterior
- Parking: Attached garage with 2 spaces
- Utilities: Public water; Public sewer
- Home design: Single-family residence; One level; Ground-level entry with steps; Vinyl siding
- Construction: Vinyl siding construction
- Exterior features: Paved road access; Lot approximately 0.11 acres (44 x 110)
Interior
- Bathrooms: One full bathroom
- Heating & cooling: Forced air heating (natural gas); No cooling
- Interior features: Crawl space basement; Five total rooms
Neighborhood map
What this means for you Summary
Snapshot
- This is a 3-bed/1.0-bath single-family listed at $152k.
Deal economics
- At list price, monthly cash flow is $119 ($1k/yr) — positive.
- The deal already cash-flows at list — no discount required.
- To meet the 1% rule (rent ≥ 1% of price), the offer needs to be $141k (7.2% below list).
- Recommended offer: $141k (7.2% below list) — sets the bar for 1% rule.
- Cap rate 7.2% vs local median 9.3% in Inkster — below-typical yield; the buyer is paying a premium for something (appreciation thesis, condition, location) that the cap rate doesn't capture.
Location & tenants
- Location reads 67/100 on livability (#406 in MI) — a middle-class / working-renter tenant base. Strengths: commute A+, cost of living A+, housing A+; Watch: health & safety D, schools F, crime F.
- Taylor School District (urban): math 14% / reading 27% proficiency, ranked #462 of 540 in MI (top 86%) — low school quality limits family demand, transient renter base, plan for 1-2y turnover; 68% free/reduced lunch — lower-income household profile, screen leases tightly.
- Market conditions: Rents rising (+3.0%/yr); 147 active listings in the ZIP; 20 comparable units currently listed for rent nearby; rentals at typical pace (median 20d on market — plan ~3-4 weeks tenant-placement turnaround); lower-income renter base — watch delinquency; 2,639 units permitted in Wayne County in 2024 (1,216 in 5+ unit buildings).
- This rent runs 43% of the median local income ($39k/yr) — at the standard rent-burdened threshold; future hikes will face affordability resistance.
Forward outlook
- Local home prices are declining (-3.0%/yr); year-one equity from $1k of loan paydown is wiped out by about $5k of value loss. Plan a longer hold.
- Wayne County population projected at -17% by 2050 — secular population decline; favor cash flow + early exit over multi-decade hold.
Negotiation context
- Only 1 days on market — expect competitive offers; lowballing is unlikely to land.
- 16 sale attempts since 20y ago with the ask held roughly flat each time — persistent listings suggest the price (not the market) is what's stuck; bring a comps-based counter.
- Current owner paid $129k; 18% above their basis — modest negotiation headroom, anchor on the comps not their cost.
Risks & watch-outs
- Watch-outs: built in 1949 — expect roof / HVAC / electrical / plumbing capex.
Questions for the listing agent
- Built in 1949 — when were the roof, HVAC, electrical panel, plumbing, and water heater last replaced?
- Is there a deadline driving the sale (1031 exchange, divorce, estate, relocation)? That informs how much negotiation room exists.
- Schools are F-rated, which usually means shorter tenancies and higher turnover. Who's the typical renter profile here, and what's been the actual vacancy rate?
- Crime grade is F in this area — have there been break-ins, vandalism, or insurance claims at this property in the last 3 years? What carrier currently insures it and at what premium?
- The area grade is low — what's the realistic commute time and amenity access for the typical tenant pool here? Any planned neighborhood developments (good or bad) we should know about?
- What's the average days-on-market for RENTAL listings here right now (not sales)? A rising rental-DOM trend means longer vacancies and softer asking-rent achievability than the comps imply.
- What's the recent tenant-quality profile in this submarket — average credit score on applications, eviction rate, late-payment / NSF rate, and stable-employment percentage? A property-management company in the area should have these aggregated.
- How much new for-sale + rental construction is in the pipeline within 1–3 miles? Heavy new supply typically softens prices + rents 12–24 months out; constrained supply supports both.
Investment metrics
- 1% rule
- 0.93% ✗
- Cap rate
- 7.23%
- Cash-on-cash
- 3.36%
- DSCR
- 1.15
- GRM
- 9.0
CMA / ARV
- ARV (on-the-fly)
- $110,200
- Comps found
- 12
Show comp detail 12 sales within ~0.75 mi
| Address | Dist | Beds/Ba | Sqft | Sold | Price | $/sf | Match |
|---|---|---|---|---|---|---|---|
| 3543 Spring Hill Ave | 0.38mi | 3/1.0 | 1,097 (-0%) | 3mo | $108,000 | $98 | 79 |
| 3135 Harrison St | 0.11mi | 2/1.0 (-1) | 1,049 (-5%) | 4mo | $47,000 | $45 | 79 |
| 3033 Williams St | 0.22mi | 3/1.0 | 1,200 (+9%) | 3mo | $120,000 | $100 | 73 |
| 3579 Ash St | 0.30mi | 4/1.0 (+1) | 1,050 (-5%) | 2mo | $140,000 | $133 | 72 |
| 3514 Spruce St | 0.26mi | 4/1.0 (+1) | 1,148 (+4%) | 7mo | $71,000 | $62 | 70 |
| 3829 Walnut St | 0.50mi | 3/1.0 | 1,070 (-3%) | 2mo | $128,000 | $120 | 70 |
| 4005 Moore St | 0.63mi | 3/1.0 | 1,100 (-0%) | 2mo | $46,000 | $42 | 68 |
| 2500 Weithoff Ct | 0.62mi | 3/1.0 | 1,050 (-5%) | 3mo | $125,000 | $119 | 61 |
| 27018 Kitch St | 0.69mi | 3/1.0 | 1,112 (+1%) | 7mo | $116,000 | $104 | 60 |
| 27848 Rosewood St | 0.68mi | 3/1.0 | 1,000 (-9%) | 7mo | $127,000 | $127 | 47 |
| 4135 Allen St | 0.75mi | 3/1.0 | 972 (-12%) | 1mo | $40,000 | $41 | 45 |
| 1909 Justine St | 0.50mi | 3/2.0 | 1,256 (+14%) | 6mo | $38,000 | $30 | 45 |
Match score weights: distance 35% · size 25% · config 20% · recency 20%. Top-matched comps best support the ARV.
Projected returns pro-forma
-3.0% appreciation · 2.95% rent growth · sell at horizon
- IRR
- -11.1%
- Equity multiple
- 0.60×
- Total profit
- $-17,118
- Equity at exit
- $22,664
- IRR
- -1.9%
- Equity multiple
- 0.87×
- Total profit
- $-5,466
- Equity at exit
- $13,142
Cash invested: $42,560 (down + closing). Projections, not guarantees.
Landlord ↔ Tenant lean methodology
- Overall (STATE)
- 62 Landlord-Friendly
- State Michigan
- 62 Landlord-Friendly · EVEN
- County
- — inherits STATE
- City
- — inherits STATE
ZIP-level market 48141
- Home prices YoY
- -2.9%
- Rents YoY
- 3.0%
- Active inventory
- 147
- Price-to-rent
- 9.0×
Monthly cashflow live
- Estimated rent
- $1,410 high interval (Pro) →
- Mortgage (P&I)
- −$797
- Tax from tax record
- −$135 /mo · $1,614/yr
- Insurance
- −$63
- HOA
- −$0
- Vacancy / Maint / Mgmt
- −$296
- Net cashflow
- $119
Break-even live
Sensitivity live
| Price | -10% $205 | -5% $162 | +0% $119 | +5% $76 | +10% $33 |
|---|---|---|---|---|---|
| Rent | -10% $8 | -5% $64 | +0% $119 | +5% $175 | +10% $231 |
| Rate | -1.0pp $196 | -0.5pp $158 | base $119 | +0.5pp $80 | +1.0pp $40 |
UW: 25.0% down · 7.5% · 30yr · 1.5% tax · 5.0% vac · 8.0% maint · 8.0% mgmt
Financing live
Cash to close
- Down payment
- $38,000
- Closing costs
- $4,560
- Reserves months
- —
- Total cash needed
- —
Loan-product check · same deal, 3 products live
Conventional
25% down · 7.5% · 30yr
- Down + closing
- —
- Monthly P&I
- —
- Monthly cashflow
- —
- DSCR
- —
- Eligible?
- —
Personal DTI + credit; lowest rate.
DSCR
20% down · 8.5% · 30yr
- Down + closing
- —
- Monthly P&I
- —
- Monthly cashflow
- —
- DSCR
- —
- Eligible?
- —
No personal income docs; deal must DSCR.
Hard money
10% down · 12.0% · 12mo
- Down + closing
- —
- Monthly P&I
- —
- Monthly cashflow
- —
- DSCR
- —
- Eligible?
- —
Short-term bridge; refi at stabilization.
Rent comps 20 comps
| Address | Beds | Baths | Sqft | Rent | $/sqft | DOM | Units | Dist |
|---|---|---|---|---|---|---|---|---|
| 3236 Walnut St Inkster, MI | 3.0 | 1.0 | 1096 | $1,495 | $1.36 | 0d | 1 | 0.12mi |
| 27139 Penn St Inkster, MI | 3.0 | 1.0 | 832 | $675 | $0.81 | 19d | 1 | 0.59mi |
| 4080 Isabelle St Inkster, MI | 4.0 | 1.0 | 975 | $1,150 | $1.18 | 17d | 1 | 0.67mi |
| 4167 Isabelle St Inkster, MI | 2.0 | 1.0 | 900 | $1,295 | $1.44 | 19d | 1 | 0.72mi |
| 4301 Harriet St Unit A-1 Inkster, MI | 2.0 | 1.5 | 1000 | $1,300 | $1.30 | 45d | 1 | 0.75mi |
| 26742 Penn St Inkster, MI | 3.0 | 1.0 | 1000 | $1,300 | $1.30 | 18d | 1 | 0.80mi |
| 26707 Penn St Inkster, MI | 3.0 | 1.0 | 900 | $1,400 | $1.56 | 7d | 1 | 0.83mi |
| 1189 Woodland Dr Inkster, MI | 3.0 | 1.0 | 994 | $1,400 | $1.41 | 1d | 1 | 1.01mi |
| 1150 Magnolia Dr Inkster, MI | 3.0 | 1.0 | 900 | $1,300 | $1.44 | 26d | 1 | 1.02mi |
| 27184 Lucerne Dr Inkster, MI | 3.0 | 1.0 | 1100 | $1,250 | $1.14 | 45d | 1 | 1.10mi |
| 29971 Brooklane St Inkster, MI | 3.0 | 1.0 | 974 | $1,450 | $1.49 | 45d | 1 | 1.11mi |
| 26382 Colgate St Inkster, MI | 2.0 | 1.0 | 850 | $935 | $1.10 | 26d | 1 | 1.11mi |
| 29203 Oakwood St Inkster, MI | 3.0 | 1.5 | 912 | $1,600 | $1.75 | 0d | 1 | 1.20mi |
| 26159 Stanford St Inkster, MI | 4.0 | 1.0 | 1056 | $1,350 | $1.28 | 7d | 1 | 1.32mi |
| 30010 Hazelwood St Inkster, MI | 3.0 | 1.0 | 1044 | $1,300 | $1.25 | 45d | 1 | 1.34mi |
| 29800 Oakwood St Inkster, MI | 3.0 | 1.0 | 1040 | $1,400 | $1.35 | 14d | 1 | 1.36mi |
| 26274 McDonald St Dearborn Heights, MI | 3.0 | 1.0 | 1365 | $1,575 | $1.15 | 0d | 1 | 1.39mi |
| 25745 Princeton St Dearborn Heights, MI | 3.0 | 1.0 | 1080 | $1,500 | $1.39 | 13d | 1 | 1.41mi |
| 26089 Lehigh St Inkster, MI | 2.0 | 1.0 | 900 | $1,295 | $1.44 | 19d | 1 | 1.42mi |
| 25722 Carlysle St Dearborn Heights, MI | 3.0 | 1.0 | 1040 | $1,450 | $1.39 | 19d | 1 | 1.47mi |
Listing history 2 events
-
2026-06-22remarks 699-char remark
-
2026-06-22$152,000 Active 1 DOM
ⓘ Source: listings_history table (triggers on properties + properties_extension) + one-shot
backfill from property_details.listing_events for pre-trigger history.
Tax reassessment forecast MI · Partial reset (capped growth)
- Current annual tax
- $1,614 · $135/mo
- Projected year-2 tax
- $1,978 · $165/mo
- Expected delta
- +$363/yr (+$30/mo · 22.5%)
ⓘ Screening estimate from a state-policy table — verify with the county assessor before closing.
Climate risk First Street
- Flood 4/10 Moderate FEMA zone X (unshaded) · 22% chance over 30 yrs
- Wildfire 1/10 Low
- Heat 3/10 Moderate 7 d/yr ≥98°F today · 15 d/yr by 30 yrs out
- Wind 2/10 Low
- Air quality 2/10 Low 1 unhealthy d/yr today · 2 by 30 yrs out
Nearby sold comps map
Loading sold comps map…
Walkable amenities ~0.75 mi
Loading nearby amenities…
Taxation est. · year 1
- Rental income
- $16,925
- − Mortgage interest
- −$8,514
- − Property taxes
- −$1,614
- − Insurance
- −$760
- − Repairs & maintenance
- −$1,354
- − Management
- −$1,354
- − Depreciation
- −$4,422
- Taxable loss
- −$1,093
- Est. tax savings @ 24.0%
- +$262
- After-tax cash flow
- $1,694/yr
For passive investors: Depreciation is non-cash, so a rental often shows a tax loss while cash-flowing — sheltering income. Rental losses are passive: they offset passive income freely, and up to $25,000/yr can offset ordinary (W-2) income if you actively participate and your MAGI is under $100k (phasing out to $0 by $150k); unused losses carry forward. On sale, claimed depreciation is recaptured at up to 25%, and gains may owe capital-gains tax (a 1031 exchange can defer both). Figures are a year-1 estimate at your 24.0% rate — not tax advice; consult a CPA.
Schools (NCES district)
- District
- Taylor School District
- NCES district ID
- 2633540
- Math proficiency
- 14% ▼ -7.00%
- Reading proficiency
- 27% ▼ -4.00%
- Median HH income
- $43,062
- Composite
- 17.62/100
- National rank
- #9034
- State rank
- #462 of 540 in MI
Livability — Inkster
- Score
- 67/100
- State rank
- #406
- US rank
- #11087
Category grades
Schools grade is shown separately in the Schools card above.
Census & demographics
- Census place
- Inkster, MI
- County
- Wayne County · 1,562,939 people
- City population
- 25,428
- Metro
- Detroit-Warren-Dearborn, MI
- Population (ZIP)
- 25,428
- Household income
- $39,252
- Rent vs Own
- Severe rent burden
- 1558.0
Population outlook (Wayne County) Hauer SSP2
- Today (2025)
- 1,675,273 people
- By 2030
- 1,620,300 · -3.3%
- By 2040
- 1,502,341 · -10.3%
- By 2050
- 1,384,039 · -17.4%
- By 2075
- 1,124,592 · -32.9%
- By 2100
- 881,193 · -47.4%
Race, ethnicity, and origin ACS 2023
- Neighborhood character
- Predominantly Black (72%)
- Race & ethnicity
- Black 72% White 17% Two or more races 7% Hispanic / Latino 2% Asian 1%
- Common ancestry
- Romanian 3% Slovak 1% Italian 1%
- Foreign-born
- 5% · Canada, China
- Languages at home
- 92% English-only · Arabic 3% Other Asian/Pacific 1% Spanish 1%
Political lean MEDSL · Wayne
- 2024 margin
- Strong D (+29.0) · D 62.7% · R 33.7% · Other 3.6%
- 2008→2024 swing
- -20.5pp toward R · 2008: 49.5pp · 2024: 29.0pp
- All cycles
- 2024: D+29.0 2020: D+38.1 2016: D+37.3 2012: D+46.9 2008: D+49.5
Not yet ingested
- Civics
- —
Market trends
- HPI YoY
- ▼ -11.74%
- Current HPI
- 390.2139
- Rent YoY
- ▲ 2.95%
- Metro
- Detroit-Warren-Dearborn, MI
- State GDP YoY
- ▲ 1.37%
- F500 in state
- 28
Industry mix (Fortune 500 HQ in MI)
| Industry | F500 HQs | Revenue |
|---|---|---|
| Automotive Parts | 3 | $48B |
|
||
| Automotive | 2 | $372B |
|
||
| Chemicals | 1 | $45B |
|
||
| Automotive Retail | 1 | $29B |
|
||
| Healthcare / Medical Devices | 1 | $23B |
|
||
| Automotive Technology | 1 | $20B |
|
||
Price history
+133.8% since first listed51 events — show timeline
- 2026-06-21 Listed $152,000 REALCOMP
- 2026-06-21 Listed $152,000 MiRealSource-MiMLS
- 2025-02-19 Sold (Public Records) $129,000 Public Records
- 2025-02-11 Sold (MLS) $129,000 MiRealSource-MiMLS
- 2025-02-11 Sold (MLS) $129,000 REALCOMP
- 2025-01-23 Pending — MiRealSource-MiMLS
- 2025-01-23 Pending — REALCOMP
- 2025-01-11 Listed $134,900 MiRealSource-MiMLS
- 2025-01-11 Listed $134,900 REALCOMP
- 2024-10-24 Listing Removed — MiRealSource-MiMLS
- 2024-10-24 Listing Removed — REALCOMP
- 2024-10-04 Price Changed $122,829 MiRealSource-MiMLS
- 2024-10-04 Price Changed $122,829 REALCOMP
- 2024-09-21 Price Changed $124,829 MiRealSource-MiMLS
- 2024-09-21 Price Changed $124,829 REALCOMP
- 2024-08-29 Listed $126,829 REALCOMP
- 2024-08-26 Listed $126,829 MiRealSource-MiMLS
- 2022-04-26 Sold (Public Records) $79,900 Public Records
- 2022-04-25 Sold (MLS) $79,900 MiRealSource-MiMLS
- 2022-04-25 Sold (MLS) $79,900 REALCOMP
- 2022-04-12 Listing Removed — REALCOMP
- 2022-04-03 Pending — MiRealSource-MiMLS
- 2022-04-03 Pending — REALCOMP
- 2022-04-02 Listed $80,000 MiRealSource-MiMLS
- 2022-04-02 Listed $80,000 REALCOMP
- 2022-04-01 Listing Removed — REALCOMP
- 2022-03-31 Listing Removed — MiRealSource-MiMLS
- 2022-02-14 Contingent — MiRealSource-MiMLS
- 2022-02-14 Contingent — REALCOMP
- 2022-02-07 Relisted — MiRealSource-MiMLS
- 2022-02-07 Relisted — REALCOMP
- 2021-12-07 Pending — MiRealSource-MiMLS
- 2021-12-07 Relisted — MiRealSource-MiMLS
- 2021-12-07 Pending — REALCOMP
- 2021-12-07 Relisted — REALCOMP
- 2021-11-22 Pending — MiRealSource-MiMLS
- 2021-11-22 Pending — REALCOMP
- 2021-11-16 Contingent — MiRealSource-MiMLS
- 2021-11-16 Contingent — REALCOMP
- 2021-11-10 Price Changed $79,900 MiRealSource-MiMLS
- 2021-11-09 Price Changed $79,900 REALCOMP
- 2021-10-26 Price Changed $80,000 MiRealSource-MiMLS
- 2021-10-25 Price Changed $80,000 REALCOMP
- 2021-10-18 Price Changed $85,000 MiRealSource-MiMLS
- 2021-10-18 Price Changed $85,000 REALCOMP
- 2021-10-04 Listed $89,999 MiRealSource-MiMLS
- 2021-10-04 Listed $89,999 REALCOMP
- 2007-04-25 Listing Removed — REALCOMP
- 2007-03-08 Listed $17,900 REALCOMP
- 2007-01-18 Listing Removed — REALCOMP
- 2006-07-18 Listed $65,000 REALCOMP
Property tax history
+0.2%/yrLatest (2025): $1,614 · -18.9% YoY. Source: county tax records.
Cash-flow waterfall
monthlySold comps — $/sqft
last 12 mo · ≤1 miLoading sold comps…