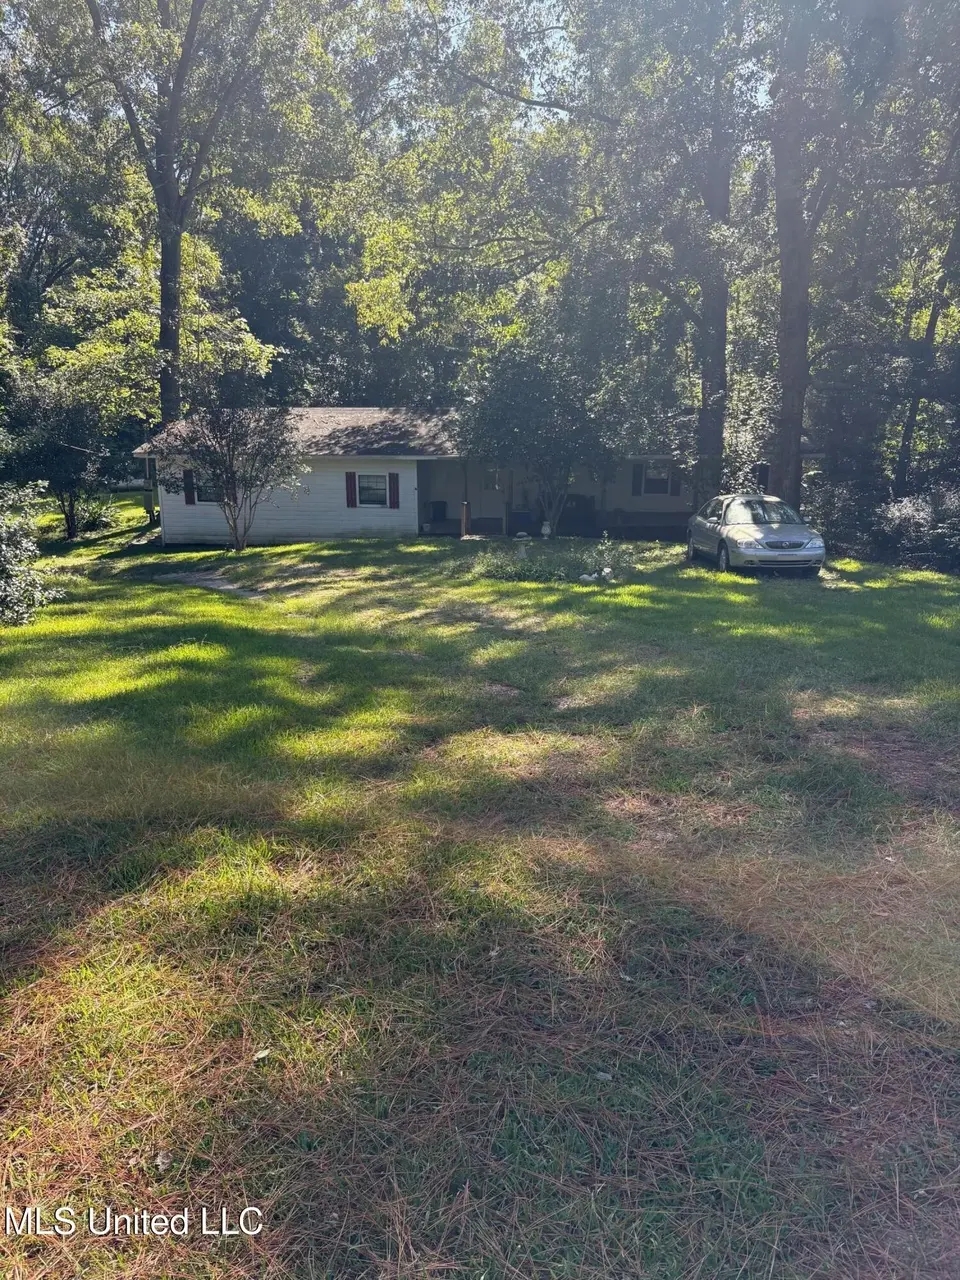
77 Magnolia Acres Rd · Natchez, MS
Flood risk No data
- FEMA flood zone
- —
- Chance of flooding over 30 yrs
- —
- Est. flood insurance / yr
- —
Fire risk No data
- Est. fire insurance / yr
- —
Heat risk No data
- Hot days now (above threshold)
- —
- Hot days in 30 yrs
- —
Wind risk No data
- Chance of severe wind over 30 yrs
- —
Air-quality risk No data
- Unhealthy air days now
- —
- Unhealthy air days in 30 yrs
- —
Risk factors via First Street. Map © Google.
Why this score? — see what drove the B- grade
The composite is a weighted blend of 9 inputs, each scored 0–100. Each bar is that input's sub-score; the figure is the points it added to the 100-point composite (weight × sub-score).
- Cash flow +30.0/30.0
- 1% rule +10.0/10.0
- DSCR +10.0/10.0
- ARV discount +7.5/15.0
- Livability +3.2/5.0
- Rent growth +2.5/5.0
- Condition / age +2.5/5.0
- Schools +1.0/10.0
- Appreciation +0.0/10.0
$39,900
🖨 Deal sheet 📄 Offer letter ✓ Due diligence
Listing remarks MLS
Plenty of space to garden or work in the yard on this beautiful 2.87 acres near Kingston. 1972 model Mobile home with metal roof is on the property. Needs septic system and some work to the trailer.
Key facts
- 2.6 acres
- 2.5 acre lot
- 10 parking spots
Tags
Neighborhood map
What this means for you Summary
Snapshot
- This is a 3-bed/1.0-bath manufactured listed at $40k.
Deal economics
- At list price, monthly cash flow is $686 ($8k/yr) — positive.
- The deal already cash-flows at list — no discount required.
- Meets the 1% rule at list price ($1k rent vs $40k).
- Cap rate 26.9% vs local median 4.4% in Natchez — top-decile yield for the area; either an underpriced asset or a hidden risk that comps aren't pricing in. Stress-test before assuming the spread holds.
Location & tenants
- Location reads 63/100 on livability (#156 in MS) — a middle-class / working-renter tenant base. Strengths: cost of living A+, crime B, housing B; Watch: health & safety C-, schools F, amenities F.
- Natchez-Adams School District (town): math 8% / reading 19% proficiency, ranked #114 of 130 in MS (top 88%) — low school quality limits family demand, transient renter base, plan for 1-2y turnover; 90% free/reduced lunch — lower-income household profile, screen leases tightly.
- Market conditions: 281 active listings in the ZIP; 6 units permitted in Adams County in 2024 (0 in 5+ unit buildings).
Forward outlook
- Local home prices are declining (-3.0%/yr); year-one equity from $276 of loan paydown is wiped out by about $1k of value loss. Plan a longer hold.
- Adams County population projected at -21% by 2050 — secular population decline; favor cash flow + early exit over multi-decade hold.
- At projected returns (-3.0% appreciation + 3.0% rent growth), your $11k cash investment doubles in ~2 years — after that, you're playing with house money.
Negotiation context
- Only 12 days on market — expect competitive offers; lowballing is unlikely to land.
- 2 sale attempts; this cycle's ask has dropped $29k (42%) from the opening price — seller is motivated, your offer sets the floor, not the list.
Questions for the listing agent
- Built in 1970 — when were the roof, HVAC, electrical panel, plumbing, and water heater last replaced?
- Is there a deadline driving the sale (1031 exchange, divorce, estate, relocation)? That informs how much negotiation room exists.
- Schools are F-rated, which usually means shorter tenancies and higher turnover. Who's the typical renter profile here, and what's been the actual vacancy rate?
- What's the average days-on-market for RENTAL listings here right now (not sales)? A rising rental-DOM trend means longer vacancies and softer asking-rent achievability than the comps imply.
- What's the recent tenant-quality profile in this submarket — average credit score on applications, eviction rate, late-payment / NSF rate, and stable-employment percentage? A property-management company in the area should have these aggregated.
- How much new for-sale + rental construction is in the pipeline within 1–3 miles? Heavy new supply typically softens prices + rents 12–24 months out; constrained supply supports both.
Investment metrics
- 1% rule
- 3.16% ✓
- Cap rate
- 26.93%
- Cash-on-cash
- 73.71%
- DSCR
- 4.28
- GRM
- 2.6
CMA / ARV
No comps found within radius.
Projected returns pro-forma
-3.0% appreciation · 3.0% rent growth · sell at horizon
- IRR
- 73.5%
- Equity multiple
- 4.34×
- Total profit
- $37,279
- Equity at exit
- $5,949
- IRR
- 77.3%
- Equity multiple
- 8.96×
- Total profit
- $88,898
- Equity at exit
- $3,450
Cash invested: $11,172 (down + closing). Projections, not guarantees.
Landlord ↔ Tenant lean methodology
- Overall (STATE)
- 90 Strongly Landlord-Friendly
- State Mississippi
- 90 Strongly Landlord-Friendly · R+11
- County
- — inherits STATE
- City
- — inherits STATE
ZIP-level market 39120
- Active inventory
- 281
- Price-to-rent
- 2.6×
Monthly cashflow live
- Estimated rent
- $1,259 medium interval (Pro) →
- Mortgage (P&I)
- −$209
- Tax from tax record
- −$83 /mo · $992/yr
- Insurance
- −$17
- HOA
- −$0
- Vacancy / Maint / Mgmt
- −$264
- Net cashflow
- $686
Break-even live
UW: 25.0% down · 7.5% · 30yr · 1.5% tax · 5.0% vac · 8.0% maint · 8.0% mgmt
Financing live
Cash to close
- Down payment
- $9,975
- Closing costs
- $1,197
- Reserves months
- —
- Total cash needed
- —
Loan-product check · same deal, 3 products live
Conventional
25% down · 7.5% · 30yr
- Down + closing
- —
- Monthly P&I
- —
- Monthly cashflow
- —
- DSCR
- —
- Eligible?
- —
Personal DTI + credit; lowest rate.
DSCR
20% down · 8.5% · 30yr
- Down + closing
- —
- Monthly P&I
- —
- Monthly cashflow
- —
- DSCR
- —
- Eligible?
- —
No personal income docs; deal must DSCR.
Hard money
10% down · 12.0% · 12mo
- Down + closing
- —
- Monthly P&I
- —
- Monthly cashflow
- —
- DSCR
- —
- Eligible?
- —
Short-term bridge; refi at stabilization.
Listing history 14 events
-
2026-06-18days on market $39,900 Active 12 DOM
-
2026-06-17days on market $39,900 Active 11 DOM
-
2026-06-16days on market $39,900 Active 10 DOM
-
2026-06-15days on market $39,900 Active 9 DOM
-
2026-06-13days on market $39,900 Active 7 DOM
-
2026-06-12days on market $39,900 Active 6 DOM
-
2026-06-09days on market $39,900 Active 3 DOM
-
2026-06-08days on market $39,900 Active 2 DOM
-
2026-06-07pricestatusdays on market $39,900 Active 1 DOM
-
2026-03-31price $39,999 200-char remark
Show marketing remark (200 chars)
Plenty of space to garden or work in the yard on this beautiful 2.87 acres near Kingston. 1972 model Mobile home with metal roof is on the property. Needs septic system and some work to the trailer.
-
2026-03-30status Active 200-char remark
Show marketing remark (200 chars)
Plenty of space to garden or work in the yard on this beautiful 2.87 acres near Kingston. 1972 model Mobile home with metal roof is on the property. Needs septic system and some work to the trailer.
-
2026-03-02status Pending 200-char remark
Show marketing remark (200 chars)
Plenty of space to garden or work in the yard on this beautiful 2.87 acres near Kingston. 1972 model Mobile home with metal roof is on the property. Needs septic system and some work to the trailer.
-
2025-10-21price $49,999 200-char remark
Show marketing remark (200 chars)
Plenty of space to garden or work in the yard on this beautiful 2.87 acres near Kingston. 1972 model Mobile home with metal roof is on the property. Needs septic system and some work to the trailer.
-
2025-09-21$69,000 Active 200-char remark
Show marketing remark (200 chars)
Plenty of space to garden or work in the yard on this beautiful 2.87 acres near Kingston. 1972 model Mobile home with metal roof is on the property. Needs septic system and some work to the trailer.
ⓘ Source: listings_history table (triggers on properties + properties_extension) + one-shot
backfill from property_details.listing_events for pre-trigger history.
Tax reassessment forecast MS · Resets to sale price
- Current annual tax
- $992 · $83/mo
- Projected year-2 tax
- $992 · $83/mo
- Expected delta
- $0/yr ($0/mo · 0.0%)
ⓘ Screening estimate from a state-policy table — verify with the county assessor before closing.
Nearby sold comps map
Loading sold comps map…
Walkable amenities ~0.75 mi
Loading nearby amenities…
Taxation est. · year 1
- Rental income
- $15,110
- − Mortgage interest
- −$2,235
- − Property taxes
- −$992
- − Insurance
- −$200
- − Repairs & maintenance
- −$1,209
- − Management
- −$1,209
- − Depreciation
- −$1,161
- Taxable income
- $8,105
- Est. tax owed @ 24.0%
- −$1,945
- After-tax cash flow
- $6,289/yr
For passive investors: Depreciation is non-cash, so a rental often shows a tax loss while cash-flowing — sheltering income. Rental losses are passive: they offset passive income freely, and up to $25,000/yr can offset ordinary (W-2) income if you actively participate and your MAGI is under $100k (phasing out to $0 by $150k); unused losses carry forward. On sale, claimed depreciation is recaptured at up to 25%, and gains may owe capital-gains tax (a 1031 exchange can defer both). Figures are a year-1 estimate at your 24.0% rate — not tax advice; consult a CPA.
Schools (NCES district)
- District
- Natchez-Adams School District
- NCES district ID
- 2803030
- Math proficiency
- 8% ▼ -16.00%
- Reading proficiency
- 19% ▼ -5.00%
- Median HH income
- $28,288
- Composite
- 10.41/100
- National rank
- #9785
- State rank
- #114 of 130 in MS
Livability — Natchez
- Score
- 63/100
- State rank
- #156
- US rank
- #15334
Category grades
Schools grade is shown separately in the Schools card above.
Census & demographics
- Population (ZIP)
- 29,212
Population outlook (Adams County) Hauer SSP2
- Today (2025)
- 28,614 people
- By 2030
- 27,405 · -4.2%
- By 2040
- 24,914 · -12.9%
- By 2050
- 22,554 · -21.2%
- By 2075
- 17,096 · -40.3%
- By 2100
- 12,156 · -57.5%
Race, ethnicity, and origin ACS 2023
- Neighborhood character
- Diverse neighborhood (Simpson 0.55)
- Race & ethnicity
- Black 56% White 37% Hispanic / Latino 4% Two or more races 2%
- Common ancestry
- Lithuanian 2% Slovak 1% Serbian 1%
- Foreign-born
- 5% · Canada
- Languages at home
- 94% English-only · Spanish 4% Other Asian/Pacific 1%
Political lean MEDSL · Adams
- 2024 margin
- D (+13.9) · D 56.5% · R 42.6%
- 2008→2024 swing
- -1.7pp toward R · 2008: 15.6pp · 2024: 13.9pp
- All cycles
- 2024: D+13.9 2020: D+16.1 2016: D+14.7 2012: D+18.0 2008: D+15.6
Not yet ingested
- Civics
- —
Market trends
- HPI YoY
- ▼ -93.67%
- Current HPI
- 112.2371
- Rent YoY
- —
- Metro
- —
- State GDP YoY
- —
- F500 in state
- 0
Price history
-42.0% since first listed5 events — show timeline
- 2026-03-31 Price Changed $39,999 MLSU
- 2026-03-30 Relisted — MLSU
- 2026-03-02 Pending — MLSU
- 2025-10-21 Price Changed $49,999 MLSU
- 2025-09-21 Listed $69,000 MLSU
Cash-flow waterfall
monthlySold comps — $/sqft
last 12 mo · ≤1 miLoading sold comps…