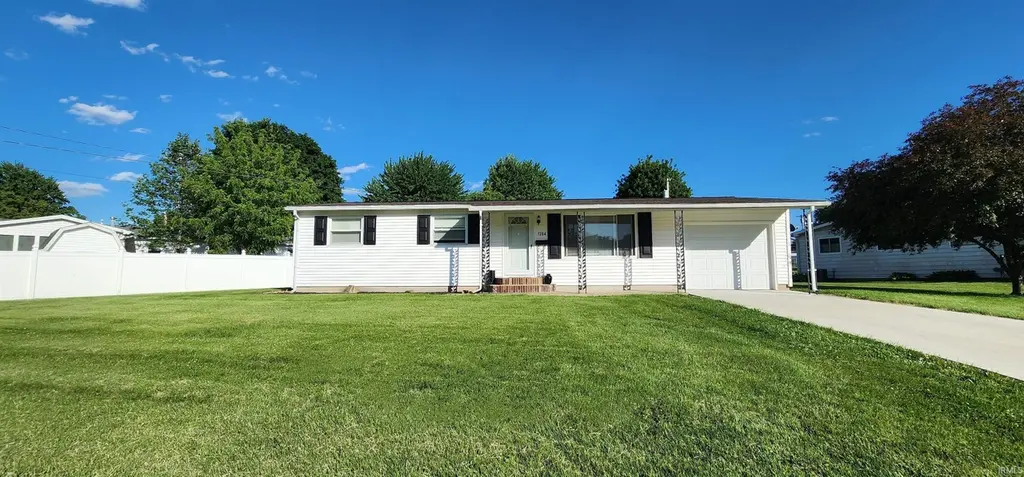
1204 NE 2nd St · Washington, IN
Flood risk 1/10 · Minimal
- FEMA flood zone
- —
- Chance of flooding over 30 yrs
- 0.0%
- Est. flood insurance / yr
- —
Fire risk 3/10 · Minor
- Est. fire insurance / yr
- $717 – $1,331
Heat risk 5/10 · Moderate
- Hot days now (above 106°F)
- 7 days/yr
- Hot days in 30 yrs
- 19 days/yr
Wind risk 2/10 · Minimal
- Chance of severe wind over 30 yrs
- 3.0%
Air-quality risk 4/10 · Minor
- Unhealthy air days now
- 3 days/yr
- Unhealthy air days in 30 yrs
- 5 days/yr
Risk factors via First Street. Map © Google.
Why this score? — see what drove the C- grade
The composite is a weighted blend of 9 inputs, each scored 0–100. Each bar is that input's sub-score; the figure is the points it added to the 100-point composite (weight × sub-score).
- Cash flow +22.1/30.0
- DSCR +7.1/10.0
- ARV discount +6.4/15.0
- 1% rule +4.5/10.0
- Livability +3.6/5.0
- Schools +3.2/10.0
- Rent growth +2.5/5.0
- Condition / age +2.5/5.0
- Appreciation +0.0/10.0
$167,900
🖨 Deal sheet 📄 Offer letter ✓ Due diligence
Listing remarks
Step into easy one-level living in this move-in-ready home designed for comfort and convenience. The functional layout offers a spacious living room that flows into a bright kitchen with a breakfast bar and adjoining dining area - perfect for everyday living. Three bedrooms feature beautiful hardwood floors, while the full bath has been tastefully refreshed with updated flooring, vanity, lighting, and toilet. An attached garage adds convenience, along with valuable extra storage. Recent upgrades including a newer furnace, air conditioning unit, and water heater, provide peace of mind and enhance the home’s overall value & appeal. Ideal for first-time buyers, downsizers, or anyon
Key facts
- Bright kitchen
- One level living
- Breakfast bar
Tags
Property features AI
Finance
- Other: Property type: Residential
Exterior
- Parking: Attached garage with garage door opener; Concrete driveway/area; 1 garage space
- Security: Smoke detector(s)
- Utilities: Public water; Public sewer
- Home design: Single-family residence; Site-built home; One story
- Construction: Vinyl siding; Asphalt shingle roof; Crawl space foundation; Built as site-built construction
- Exterior features: Covered porch; Porch; Storm door(s); Irregular lot
Interior
- Kitchen: Disposal; Microwave; Refrigerator; Electric cooktop; Oven; Exhaust fan
- Bedrooms: Total rooms: 5
- Flooring: Hardwood; Carpet; Vinyl
- Bathrooms: 1 full bathroom (main level)
- Heating & cooling: Natural gas forced-air heating; Central air conditioning
- Interior features: Breakfast bar; Laminate countertops; Smoke detector(s)
- Laundry & utility: Washer hookup (main level); Electric dryer hookup (main level); Washer; Dryer; Gas water heater; Water heater
Neighborhood map
What this means for you Summary
Snapshot
- This is a 3-bed/1.0-bath single-family listed at $168k.
Deal economics
- At list price, monthly cash flow is $271 ($3k/yr) — positive.
- The deal already cash-flows at list — no discount required.
- To meet the 1% rule (rent ≥ 1% of price), the offer needs to be $160k (4.9% below list).
- Recommended offer: $160k (4.9% below list) — sets the bar for 1% rule.
- Cap rate 8.2% vs local median 4.9% in Washington — top-decile yield for the area; either an underpriced asset or a hidden risk that comps aren't pricing in. Stress-test before assuming the spread holds.
Location & tenants
- Location reads 72/100 on livability (#110 in IN) — a middle-class / working-renter tenant base. Strengths: cost of living A+, housing A+, health & safety A+; Watch: amenities F, commute F, employment F.
- Washington Community Schools (town): math 36% / reading 38% proficiency, ranked #174 of 301 in IN (top 58%) — families likely to look elsewhere, expect single-tenant / working-renter base with shorter leases.
- Zoned schools: Washington Upper Elementary (math 44% / reading 43%, grade D, #90 of 330 statewide, top 27%, 361 students, 62% FRL); Washington High School (math 27% / reading 57%, grade F, #197 of 369 statewide, top 57%, 780 students, 58% FRL) — zoned schools at 60% FRL track the district average.
- Market conditions: 112 active listings in the ZIP; 71 units permitted in Daviess County in 2024 (0 in 5+ unit buildings).
Forward outlook
- Local home prices are declining (-3.0%/yr); year-one equity from $1k of loan paydown is wiped out by about $5k of value loss. Plan a longer hold.
- Daviess County population projected at +6% by 2050 — modest demand growth; plan on rents tracking national, not racing it.
Negotiation context
- It's been on market 36 days — a 3% lower offer ($163k) is reasonable based on typical stale-listing flexibility.
Risks & watch-outs
- Climate carrying-cost: extreme-heat days projected 7→19/yr by 2055 (HVAC capex compounding) — expect insurance premiums to compound above CPI over the hold.
Questions for the listing agent
- It's been on market 36 days. Have you received any prior offers? Is the seller open to a 5% concession, seller financing, or rate buy-down credit?
- Built in 1964 — when were the roof, HVAC, electrical panel, plumbing, and water heater last replaced?
- Is there a deadline driving the sale (1031 exchange, divorce, estate, relocation)? That informs how much negotiation room exists.
- What's the average days-on-market for RENTAL listings here right now (not sales)? A rising rental-DOM trend means longer vacancies and softer asking-rent achievability than the comps imply.
- What's the recent tenant-quality profile in this submarket — average credit score on applications, eviction rate, late-payment / NSF rate, and stable-employment percentage? A property-management company in the area should have these aggregated.
- How much new for-sale + rental construction is in the pipeline within 1–3 miles? Heavy new supply typically softens prices + rents 12–24 months out; constrained supply supports both.
Investment metrics
- 1% rule
- 0.95% ✗
- Cap rate
- 8.23%
- Cash-on-cash
- 6.91%
- DSCR
- 1.31
- GRM
- 8.8
CMA / ARV
- ARV (median comp)
- $163,867
- List price
- $167,900
- Delta
- 2.46%
- Verdict
- FAIR
- Comps
- 20 within 1.0 mi
Show comp detail 12 sales within ~0.75 mi
| Address | Dist | Beds/Ba | Sqft | Sold | Price | $/sf | Match |
|---|---|---|---|---|---|---|---|
| 201 E John St | 0.21mi | 3/1.5 | 1,412 (+2%) | 2mo | $61,000 | $43 | 83 |
| 514 N Meridian St | 0.41mi | 3/1.5 | 1,258 (-9%) | 1mo | $155,000 | $123 | 63 |
| 1001 NE 6th St | 0.23mi | 3/1.0 | 1,560 (+13%) | 7mo | $180,000 | $115 | 61 |
| 903 NE 2nd St | 0.16mi | 3/1.0 | 1,172 (-15%) | 8mo | $165,000 | $141 | 60 |
| 603 E John St | 0.32mi | 3/2.5 | 1,516 (+10%) | 4mo | $209,500 | $138 | 58 |
| 500 E Maple St | 0.39mi | 3/1.5 | 1,208 (-12%) | 4mo | $110,000 | $91 | 56 |
| 310 N Meridian St | 0.55mi | 3/1.5 | 1,229 (-11%) | 5mo | $82,000 | $67 | 51 |
| 415 E William St | 0.49mi | 2/1.0 (-1) | 1,211 (-12%) | 2mo | $138,000 | $114 | 50 |
| 307 W Flora St | 0.63mi | 3/2.0 | 1,280 (-7%) | 8mo | $155,000 | $121 | 48 |
| 107 NE 2nd St | 0.67mi | 2/1.0 (-1) | 1,228 (-11%) | 2mo | $95,000 | $77 | 44 |
| 407 Ogdon St | 0.71mi | 3/2.0 | 1,190 (-14%) | 2mo | $193,000 | $162 | 39 |
| 207 NW 6th St | 0.72mi | 4/2.0 (+1) | 1,560 (+13%) | 8mo | $157,000 | $101 | 29 |
Match score weights: distance 35% · size 25% · config 20% · recency 20%. Top-matched comps best support the ARV.
Projected returns pro-forma
-3.0% appreciation · 3.0% rent growth · sell at horizon
- IRR
- -5.8%
- Equity multiple
- 0.79×
- Total profit
- $-10,053
- Equity at exit
- $25,034
- IRR
- 3.8%
- Equity multiple
- 1.28×
- Total profit
- $13,112
- Equity at exit
- $14,517
Cash invested: $47,012 (down + closing). Projections, not guarantees.
Landlord ↔ Tenant lean methodology
- Overall (STATE)
- 90 Strongly Landlord-Friendly
- State Indiana
- 90 Strongly Landlord-Friendly · R+11
- County
- — inherits STATE
- City
- — inherits STATE
ZIP-level market 47501
- Home prices YoY
- -23.2%
- Active inventory
- 112
- Price-to-rent
- 8.8×
Monthly cashflow live
- Estimated rent
- $1,597 medium interval (Pro) →
- Mortgage (P&I)
- −$880
- Tax from tax record
- −$40 /mo · $486/yr
- Insurance
- −$70
- HOA
- −$0
- Vacancy / Maint / Mgmt
- −$335
- Net cashflow
- $271
Break-even live
UW: 25.0% down · 7.5% · 30yr · 1.5% tax · 5.0% vac · 8.0% maint · 8.0% mgmt
Financing live
Cash to close
- Down payment
- $41,975
- Closing costs
- $5,037
- Reserves months
- —
- Total cash needed
- —
Loan-product check · same deal, 3 products live
Conventional
25% down · 7.5% · 30yr
- Down + closing
- —
- Monthly P&I
- —
- Monthly cashflow
- —
- DSCR
- —
- Eligible?
- —
Personal DTI + credit; lowest rate.
DSCR
20% down · 8.5% · 30yr
- Down + closing
- —
- Monthly P&I
- —
- Monthly cashflow
- —
- DSCR
- —
- Eligible?
- —
No personal income docs; deal must DSCR.
Hard money
10% down · 12.0% · 12mo
- Down + closing
- —
- Monthly P&I
- —
- Monthly cashflow
- —
- DSCR
- —
- Eligible?
- —
Short-term bridge; refi at stabilization.
Listing history 16 events
-
2026-06-18days on market $167,900 Active 36 DOM
-
2026-06-17days on market $167,900 Active 35 DOM
-
2026-06-16days on market $167,900 Active 34 DOM
-
2026-06-15days on market $167,900 Active 33 DOM
-
2026-06-13days on market $167,900 Active 31 DOM
-
2026-06-12pricedays on market $167,900 Active 30 DOM
-
2026-06-09days on market $172,900 Active 27 DOM
-
2026-06-08days on market $172,900 Active 26 DOM
-
2026-06-07days on market $172,900 Active 25 DOM
-
2026-06-07days on market $172,900 Active 24 DOM
-
2026-06-04days on market $172,900 Active 21 DOM
-
2026-06-02days on market $172,900 Active 20 DOM
-
2026-06-01days on market $172,900 Active 19 DOM
-
2026-05-31days on market $172,900 Active 18 DOM
-
2026-05-31days on market $172,900 Active 17 DOM
-
2026-05-11$172,900 Active 773-char remark
ⓘ Source: listings_history table (triggers on properties + properties_extension) + one-shot
backfill from property_details.listing_events for pre-trigger history.
Tax reassessment forecast IN · Partial reset (capped growth)
- Current annual tax
- $486 · $40/mo
- Projected year-2 tax
- $957 · $80/mo
- Expected delta
- +$471/yr (+$39/mo · 96.8%)
ⓘ Screening estimate from a state-policy table — verify with the county assessor before closing.
Climate risk First Street
- Flood 1/10 Low 0% chance over 30 yrs
- Wildfire 3/10 Moderate
- Heat 5/10 Major 7 d/yr ≥106°F today · 19 d/yr by 30 yrs out
- Wind 2/10 Low 3% chance of damaging wind over 30 yrs
- Air quality 4/10 Moderate 3 unhealthy d/yr today · 5 by 30 yrs out
Nearby sold comps map
Loading sold comps map…
Walkable amenities ~0.75 mi
Loading nearby amenities…
Taxation est. · year 1
- Rental income
- $19,162
- − Mortgage interest
- −$9,405
- − Property taxes
- −$486
- − Insurance
- −$840
- − Repairs & maintenance
- −$1,533
- − Management
- −$1,533
- − Depreciation
- −$4,884
- Taxable income
- $482
- Est. tax owed @ 24.0%
- −$116
- After-tax cash flow
- $3,131/yr
For passive investors: Depreciation is non-cash, so a rental often shows a tax loss while cash-flowing — sheltering income. Rental losses are passive: they offset passive income freely, and up to $25,000/yr can offset ordinary (W-2) income if you actively participate and your MAGI is under $100k (phasing out to $0 by $150k); unused losses carry forward. On sale, claimed depreciation is recaptured at up to 25%, and gains may owe capital-gains tax (a 1031 exchange can defer both). Figures are a year-1 estimate at your 24.0% rate — not tax advice; consult a CPA.
Schools (NCES district)
- District
- Washington Community Schools
- NCES district ID
- 1812450
- Math proficiency
- 36% ▼ -1.00%
- Reading proficiency
- 38% ▼ -3.00%
- Median HH income
- $45,422
- Composite
- 31.57/100
- National rank
- #5952
- State rank
- #174 of 301 in IN
Livability — Washington
- Score
- 72/100
- State rank
- #110
- US rank
- #5706
Category grades
Schools grade is shown separately in the Schools card above.
Census & demographics
- Census place
- Washington, IN
- City population
- 18,335
- Population (ZIP)
- 18,335
Population outlook (Daviess County) Hauer SSP2
- Today (2025)
- 33,940 people
- By 2030
- 34,457 · +1.5%
- By 2040
- 35,412 · +4.3%
- By 2050
- 35,803 · +5.5%
- By 2075
- 35,173 · +3.6%
- By 2100
- 29,799 · -12.2%
Race, ethnicity, and origin ACS 2023
- Neighborhood character
- Predominantly White (81%)
- Race & ethnicity
- White 81% Hispanic / Latino 11% Two or more races 8% Black 3%
- Hispanic origin (detail)
- Mexican 9%
- Common ancestry
- Hispanic 4% Lithuanian 2% Slovak 1%
- Foreign-born
- 7% · Canada
- Languages at home
- 89% English-only · Spanish 5% French/Haitian/Cajun 3% German/W. Germanic 1%
Political lean MEDSL · Daviess
- 2024 margin
- Solid R (+64.3) · D 17.1% · R 81.5% · Other 1.4%
- 2008→2024 swing
- -29.1pp toward R · 2008: -35.2pp · 2024: -64.3pp
- All cycles
- 2024: R+64.3 2020: R+62.0 2016: R+62.8 2012: R+50.8 2008: R+35.2
Not yet ingested
- Civics
- —
Market trends
- HPI YoY
- ▼ -64.30%
- Current HPI
- 213.3049
- Rent YoY
- —
- Metro
- —
- State GDP YoY
- ▲ 2.90%
- F500 in state
- 18
Industry mix (Fortune 500 HQ in IN)
| Industry | F500 HQs | Revenue |
|---|---|---|
| Industrial Machinery | 2 | $37B |
|
||
| Healthcare | 1 | $177B |
|
||
| Pharmaceuticals | 1 | $45B |
|
||
| Metals / Steel | 1 | $18B |
|
||
| Agriculture | 1 | $17B |
|
||
| Packaging | 1 | $12B |
|
||
Price history
-2.9% since first listed2 events — show timeline
- 2026-06-10 Price Changed $167,900 IRMLS
- 2026-05-11 Listed $172,900 IRMLS
Property tax history
+11.8%/yrLatest (2024): $486 · +23.5% YoY. Source: county tax records.
Cash-flow waterfall
monthlySold comps — $/sqft
last 12 mo · ≤1 miLoading sold comps…