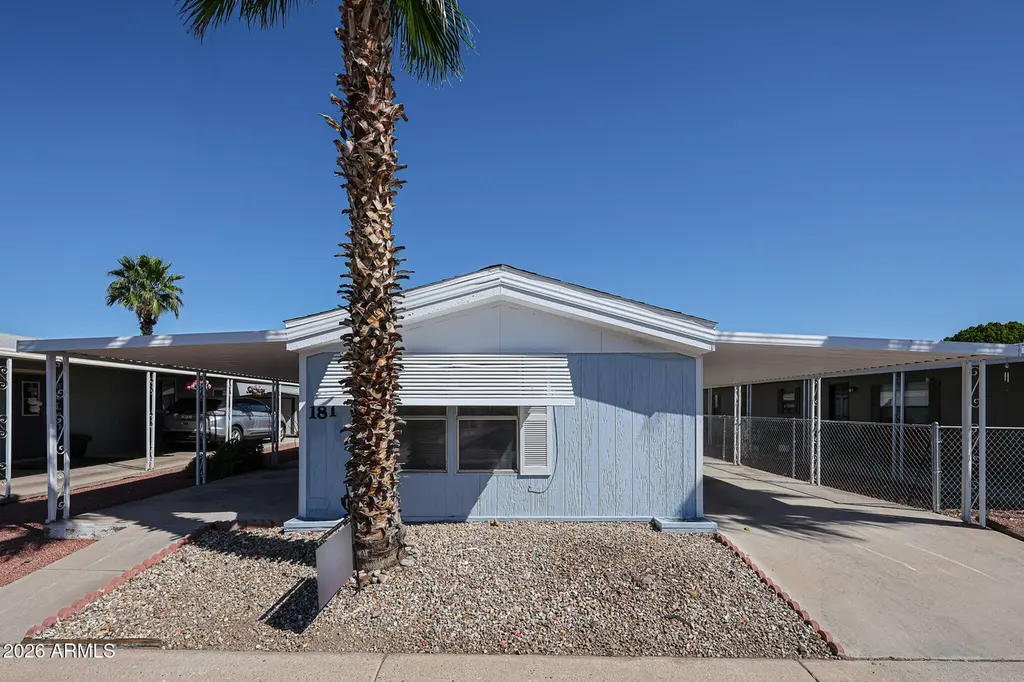
8301 N 103rd Ave #181 · Peoria, AZ
Flood risk 3/10 · Minor
- FEMA flood zone
- X (shaded)
- Chance of flooding over 30 yrs
- 0.1%
- Est. flood insurance / yr
- $507 – $1,088
Fire risk 3/10 · Minor
- Est. fire insurance / yr
- $610 – $1,132
Heat risk 9/10 · Severe
- Hot days now (above 113°F)
- 7 days/yr
- Hot days in 30 yrs
- 17 days/yr
Wind risk 1/10 · Minimal
- Chance of severe wind over 30 yrs
- —
Air-quality risk 2/10 · Minimal
- Unhealthy air days now
- 1 days/yr
- Unhealthy air days in 30 yrs
- 1 days/yr
Risk factors via First Street. Map © Google.
Why this score? — see what drove the B grade
The composite is a weighted blend of 9 inputs, each scored 0–100. Each bar is that input's sub-score; the figure is the points it added to the 100-point composite (weight × sub-score).
- Cash flow +30.0/30.0
- 1% rule +10.0/10.0
- DSCR +10.0/10.0
- ARV discount +7.5/15.0
- Livability +3.8/5.0
- Condition / age +3.8/5.0
- Schools +3.5/10.0
- Rent growth +2.7/5.0
- Appreciation +0.0/10.0
$75,000
🖨 Deal sheet (PDF) 📄 Offer letter ✓ Due diligence
Listing remarks
Charming single-wide in Sun Gardens MH Park offering a surprisingly functional layout and comfortable feel throughout. The inviting kitchen opens to the main living space, creating a warm, at-home atmosphere perfect for everyday living. Recent updates include new interior paint, new carpet in the bedrooms, tasteful flooring, and a beautifully updated guest shower. The primary suite stands out with two closets and dual entrances to the bathroom for added convenience. Enjoy the benefit of double pane windows and a brand-new roof for peace of mind. A separate laundry room adds practicality, while the covered exterior seating area is perfect for relaxing outdoors. Located in a beautiful communi
Key facts
- Inviting kitchen
- Brand new roof
- Double pane windows
Tags
Neighborhood map
What this means for you Summary
Snapshot
- This is a 3-bed/2.0-bath manufactured listed at $75k. Condition is rated good.
Deal economics
- At list price, monthly cash flow is $1k ($13k/yr) — positive.
- The deal already cash-flows at list — no discount required.
- Meets the 1% rule at list price ($2k rent vs $75k).
- Recommended offer: $74k (1.5% below list) — sets the bar for market timing.
- Cap rate 23.5% vs local median 3.3% in Peoria — top-decile yield for the area; either an underpriced asset or a hidden risk that comps aren't pricing in. Stress-test before assuming the spread holds.
Location & tenants
- Location reads 76/100 on livability (#14 in AZ, #3,603 nationally) — a middle-class / working-renter tenant base. Strengths: housing A+, commute A, employment A; Watch: cost of living C-, amenities D, health & safety F.
- Peoria Unified School District (4237) (suburban): math 36% / reading 42% proficiency, ranked #64 of 249 in AZ (top 26%) — families likely to look elsewhere, expect single-tenant / working-renter base with shorter leases.
- Zoned schools: Country Meadows Elementary School (math 19% / reading 31%, grade F, #638 of 1,109 statewide, top 58%, 1,015 students, 66% FRL); Raymond S. Kellis (math 27% / reading 34%, grade F, #114 of 381 statewide, top 30%, 1,817 students, 48% FRL) — zoned schools average 57% FRL vs 35% district-wide (22 pts higher); higher-poverty schools than district average — tighter screening recommended.
- Market conditions: Rents flat; 333 active listings in the ZIP; 33 comparable units currently listed for rent nearby; rentals leasing fast (median 6d on market — plan ~1-2 weeks tenant-placement turnaround); 36,011 units permitted in Maricopa County in 2024 (12,801 in 5+ unit buildings).
- This rent runs 36% of the median local income ($67k/yr) — at the standard rent-burdened threshold; future hikes will face affordability resistance.
Forward outlook
- Local home prices are declining (-3.0%/yr); year-one equity from $519 of loan paydown is wiped out by about $2k of value loss. Plan a longer hold.
- Maricopa County population projected at +38% by 2050 — long-run rental-demand tailwind backs the buy-and-hold thesis.
- At projected returns (-3.0% appreciation + 0.6% rent growth), your $21k cash investment doubles in ~2 years — after that, you're playing with house money.
Negotiation context
- It's been on market 18 days — a 2% lower offer ($74k) is reasonable based on typical stale-listing flexibility.
Risks & watch-outs
- Climate carrying-cost: extreme-heat days projected 7→17/yr by 2055 (HVAC capex compounding) — expect insurance premiums to compound above CPI over the hold.
Questions for the listing agent
- Is there a deadline driving the sale (1031 exchange, divorce, estate, relocation)? That informs how much negotiation room exists.
- Schools are B-rated — typically a magnet for longer-tenancy family renters. What's the average tenant stay here, and is there a school-zone premium baked into asking?
- What's the average days-on-market for RENTAL listings here right now (not sales)? A rising rental-DOM trend means longer vacancies and softer asking-rent achievability than the comps imply.
- What's the recent tenant-quality profile in this submarket — average credit score on applications, eviction rate, late-payment / NSF rate, and stable-employment percentage? A property-management company in the area should have these aggregated.
- How much new for-sale + rental construction is in the pipeline within 1–3 miles? Heavy new supply typically softens prices + rents 12–24 months out; constrained supply supports both.
Investment metrics
- 1% rule
- 2.69% ✓
- Cap rate
- 23.46%
- Cash-on-cash
- 61.30%
- DSCR
- 3.73
- GRM
- 3.1
CMA / ARV
- ARV (on-the-fly)
- $227,392
- Comps found
- 12
Show comp detail 12 sales within ~0.75 mi
| Address | Dist | Beds/Ba | Sqft | Sold | Price | $/sf | Match |
|---|---|---|---|---|---|---|---|
| 8301 N 103rd Ave #181 | 0.00mi | 3/2.0 | 1,216 (0%) | 1mo | $75,000 | $62 | 99 |
| 8301 N 103rd Ave #177 | 0.02mi | 3/2.0 | 1,152 (-5%) | 3mo | $91,500 | $79 | 88 |
| 8301 N 103rd Ave #108 | 0.13mi | 3/2.0 | 1,248 (+3%) | 9mo | $109,700 | $88 | 82 |
| 8301 N 103 Ave #203 | 0.14mi | 3/2.0 | 1,120 (-8%) | 0mo | $53,000 | $47 | 80 |
| 8301 N 103rd Ave #206 | 0.16mi | 2/2.0 (-1) | 1,152 (-5%) | 5mo | $85,000 | $74 | 75 |
| 8601 N 103rd Ave #54 | 0.25mi | 3/2.0 | 1,249 (+3%) | 12mo | $280,000 | $224 | 74 |
| 8601 N 103rd Ave #77 | 0.25mi | 2/2.0 (-1) | 1,310 (+8%) | 2mo | $176,000 | $134 | 68 |
| 8601 N 103rd Ave #72 | 0.25mi | 3/2.0 | 1,362 (+12%) | 2mo | $255,000 | $187 | 67 |
| 8601 N 103rd Ave #274 | 0.25mi | 3/2.0 | 1,344 (+10%) | 8mo | $280,000 | $208 | 64 |
| 8601 N 103rd Ave #284 | 0.25mi | 3/2.0 | 1,056 (-13%) | 4mo | $275,000 | $260 | 63 |
| 8601 N 103rd Ave #263 | 0.25mi | 3/2.0 | 1,344 (+10%) | 11mo | $296,000 | $220 | 61 |
| 8601 N 103rd Ave #55 | 0.25mi | 3/2.0 | 1,353 (+11%) | 13mo | $280,000 | $207 | 58 |
Match score weights: distance 35% · size 25% · config 20% · recency 20%. Top-matched comps best support the ARV.
Projected returns pro-forma
-3.0% appreciation · 0.62% rent growth · sell at horizon
- IRR
- 57.4%
- Equity multiple
- 3.45×
- Total profit
- $51,494
- Equity at exit
- $11,183
- IRR
- 61.5%
- Equity multiple
- 6.45×
- Total profit
- $114,516
- Equity at exit
- $6,485
Cash invested: $21,000 (down + closing). Projections, not guarantees.
Landlord ↔ Tenant lean methodology
- Overall (STATE)
- 87 Strongly Landlord-Friendly
- State Arizona
- 87 Strongly Landlord-Friendly · R+3
- County
- — inherits STATE
- City
- — inherits STATE
ZIP-level market 85345
- Home prices YoY
- -19.8%
- Rents YoY
- 0.6%
- Active inventory
- 333
- Price-to-rent
- 3.1×
Monthly cashflow live
- Estimated rent
- $2,014 high interval (Pro) →
- Mortgage (P&I)
- −$393
- Tax est. 1.5%
- −$94 /mo · $1,125/yr
- Insurance
- −$31
- HOA
- −$0
- Vacancy / Maint / Mgmt
- −$423
- Net cashflow
- $1,073
Break-even live
Sensitivity live
| Price | -10% $1,125 | -5% $1,099 | +0% $1,073 | +5% $1,047 | +10% $1,021 |
|---|---|---|---|---|---|
| Rent | -10% $914 | -5% $993 | +0% $1,073 | +5% $1,152 | +10% $1,232 |
| Rate | -1.0pp $1,111 | -0.5pp $1,092 | base $1,073 | +0.5pp $1,053 | +1.0pp $1,034 |
UW: 25.0% down · 7.5% · 30yr · 1.5% tax · 5.0% vac · 8.0% maint · 8.0% mgmt
Financing live
Cash to close
- Down payment
- $18,750
- Closing costs
- $2,250
- Reserves months
- —
- Total cash needed
- —
Loan-product check · same deal, 3 products live
Conventional
25% down · 7.5% · 30yr
- Down + closing
- —
- Monthly P&I
- —
- Monthly cashflow
- —
- DSCR
- —
- Eligible?
- —
Personal DTI + credit; lowest rate.
DSCR
20% down · 8.5% · 30yr
- Down + closing
- —
- Monthly P&I
- —
- Monthly cashflow
- —
- DSCR
- —
- Eligible?
- —
No personal income docs; deal must DSCR.
Hard money
10% down · 12.0% · 12mo
- Down + closing
- —
- Monthly P&I
- —
- Monthly cashflow
- —
- DSCR
- —
- Eligible?
- —
Short-term bridge; refi at stabilization.
Rent comps 33 comps
| Address | Beds | Baths | Sqft | Rent | $/sqft | DOM | Units | Dist |
|---|---|---|---|---|---|---|---|---|
| 10421 W Puget Ave Peoria, AZ | 3.0 | 2.0 | 1424 | $1,750 | $1.23 | 25d | 1 | 0.53mi |
| 8575 N 107th Dr Peoria, AZ | 3.0 | 2.0 | 1469 | $2,800 | $1.91 | 13d | 1 | 0.65mi |
| 8131 N 107th Ave Peoria, AZ | 2.0 | 2.0 | 863 | $1,350 | $1.56 | 25d | 1 | 0.67mi |
| 8587 N 107th Ln Peoria, AZ | 3.0 | 2.0 | 1198 | $1,900 | $1.59 | 44d | 1 | 0.71mi |
| 8800 N 107th Ave Peoria, AZ | 3.0 | 2.0 | 1193 | $1,948 | $1.63 | 13d | 2 | 0.73mi |
| 8800 N 107th Ave Peoria, AZ | 2.0–3.0 | 1.0–2.0 | 1075 | $2,500 | $2.33 | 44d | 2 | 0.73mi |
| 9680 W Northern Ave Peoria, AZ | 3.0 | 1.0–2.0 | 1007 | $1,895 | $1.88 | 5d | 15 | 0.73mi |
| 7811 N 99th Ave Glendale, AZ | 3.0 | 1.0–2.0 | 1044 | $2,805 | $2.69 | 2d | 21 | 0.78mi |
| 9550 W Northern Ave Peoria, AZ | 2.0 | 1.0–2.0 | 930 | $2,000 | $2.15 | 2d | 48 | 0.81mi |
| 9514 W El Caminito Dr Peoria, AZ | 3.0 | 2.0 | 1382 | $1,850 | $1.34 | 44d | 1 | 0.83mi |
| 8140 N 107th Ave #134 Peoria, AZ | 2.0 | 2.0 | 862 | $1,500 | $1.74 | 6d | 1 | 0.84mi |
| 9625 W Olive Ave Peoria, AZ | 1.0–3.0 | 1.0–3.0 | 1485 | $2,674 | $1.80 | 6d | 7 | 0.86mi |
| 9503 W Las Palmaritas Dr Peoria, AZ | 3.0 | 2.0 | 1283 | $1,200 | $0.94 | 6d | 1 | 0.87mi |
| 7430 N 100th Ave Glendale, AZ | 2.0 | 2.0 | 1095 | $1,849 | $1.69 | 6d | 1 | 0.89mi |
| 10847 W Olive Ave Peoria, AZ | 1.0–2.0 | 1.0–2.0 | 869 | $1,485 | $1.71 | 2d | 9 | 0.89mi |
| 10856 W Ruth Ave Peoria, AZ | 3.0 | 2.0 | 1458 | $1,945 | $1.33 | 44d | 1 | 0.89mi |
| 10807 W Northern Ave #121 Glendale, AZ | 2.0 | 2.0 | 993 | $1,399 | $1.41 | 25d | 1 | 0.92mi |
| 7430 W 100th Ave Glendale, AZ | 1.0–2.0 | 1.0–2.0 | 940 | $1,857 | $1.98 | 3d | 6 | 0.93mi |
| 10935 W Ruth Ave Peoria, AZ | 3.0 | 2.0 | 1358 | $1,950 | $1.44 | 6d | 1 | 0.97mi |
| 10815 W Northern Ave #124 Glendale, AZ | 2.0 | 2.0 | 993 | $1,500 | $1.51 | 25d | 1 | 0.97mi |
| 9680 W Olive Ave Peoria, AZ | 1.0–3.0 | 1.0–2.0 | 850 | $1,880 | $2.21 | 2d | 9 | 0.99mi |
| 10945 W Loma Ln Peoria, AZ | 3.0 | 2.0 | 1500 | $2,000 | $1.33 | 18d | 1 | 1.01mi |
| 10060 W Desert River Blvd Glendale, AZ | 1.0–3.0 | 1.0–2.0 | 1049 | $2,235 | $2.13 | 3d | 40 | 1.03mi |
| 11185 W El Caminito Dr Peoria, AZ | 3.0 | 2.0 | 1301 | $1,925 | $1.48 | 13d | 1 | 1.23mi |
| 9626 W Mountain View Rd Unit A Peoria, AZ | 2.0 | 2.0 | 1156 | $1,500 | $1.30 | 44d | 1 | 1.27mi |
| 8130 N 112th Ave Peoria, AZ | 3.0 | 2.0 | 1301 | $1,775 | $1.36 | 3d | 1 | 1.28mi |
| 10350 W Camden Ave Sun City, AZ | 2.0 | 2.0 | 1413 | $2,850 | $2.02 | 25d | 1 | 1.29mi |
| 8723 N 112th Ave Peoria, AZ | 3.0 | 2.0 | 1301 | $1,800 | $1.38 | 5d | 1 | 1.29mi |
| 10020 W Glendale Ave Glendale, AZ | 3.0 | 1.0–2.0 | 1007 | $2,170 | $2.15 | 2d | 29 | 1.33mi |
| 10110 N 97th Dr Unit A Peoria, AZ | 2.0 | 1.5 | 1025 | $1,500 | $1.46 | 25d | 1 | 1.36mi |
| 7455 N 95th Ave Glendale, AZ | 1.0–3.0 | 1.0–2.0 | 1080 | $2,162 | $2.00 | 2d | 16 | 1.38mi |
| 10104 N 96th Dr Unit A Peoria, AZ | 2.0 | 2.0 | 1072 | $1,750 | $1.63 | 25d | 1 | 1.40mi |
| 9450 W Cabela Dr Glendale, AZ | 3.0 | 1.0–2.0 | 1027 | $2,073 | $2.02 | 2d | 13 | 1.47mi |
Listing history 2 events
-
2026-04-27status Pending
-
2026-04-09$75,000 Active
ⓘ Source: listings_history table (triggers on properties + properties_extension) + one-shot
backfill from property_details.listing_events for pre-trigger history.
Climate risk First Street
- Flood 3/10 Moderate FEMA zone X (shaded) · 10% chance over 30 yrs
- Wildfire 3/10 Moderate
- Heat 9/10 Extreme 7 d/yr ≥113°F today · 17 d/yr by 30 yrs out
- Wind 1/10 Low
- Air quality 2/10 Low 1 unhealthy d/yr today · 1 by 30 yrs out
Nearby sold comps map
Loading sold comps map…
Walkable amenities ~0.75 mi
Loading nearby amenities…
Taxation est. · year 1
- Rental income
- $24,169
- − Mortgage interest
- −$4,201
- − Property taxes
- −$1,125
- − Insurance
- −$375
- − Repairs & maintenance
- −$1,934
- − Management
- −$1,934
- − Depreciation
- −$2,182
- Taxable income
- $12,419
- Est. tax owed @ 24.0%
- −$2,981
- After-tax cash flow
- $9,893/yr
For passive investors: Depreciation is non-cash, so a rental often shows a tax loss while cash-flowing — sheltering income. Rental losses are passive: they offset passive income freely, and up to $25,000/yr can offset ordinary (W-2) income if you actively participate and your MAGI is under $100k (phasing out to $0 by $150k); unused losses carry forward. On sale, claimed depreciation is recaptured at up to 25%, and gains may owe capital-gains tax (a 1031 exchange can defer both). Figures are a year-1 estimate at your 24.0% rate — not tax advice; consult a CPA.
Condition & rehab AI · 12 photos
This single-wide manufactured home in Sun Gardens MH Park is in good condition with recent updates. It has a good roof, double-pane windows, and a covered patio. The kitchen and bathrooms need updates, and painting the exterior would significantly increase its value.
Repairs flagged
- Moderate kitchen cabinets — dated and in need of updating
- Moderate bathroom fixtures — dated and in need of updating
- Minor kitchen flooring — slight wear
Value-add opportunities
- Resale update kitchen cabinets and flooring — modernizing the kitchen would significantly increase its appeal
- Resale update bathroom fixtures and flooring — modernizing the bathrooms would significantly increase its appeal
- Both paint exterior — painting the exterior would improve curb appeal and increase both resale and rental value
Renovation cost estimate screening
| Repair item | Severity | Est. cost |
|---|---|---|
| kitchen cabinets · dated and in need of updating | Moderate | $3,000–15,000 |
| bathroom fixtures · dated and in need of updating | Moderate | $3,000–15,000 |
| kitchen flooring · slight wear | Minor | $500–3,000 |
| Total estimated repair cost · 3 items | $6,500–33,000 |
Value-add ROI direction
- Resale update kitchen cabinets and flooring — modernizing the kitchen would significantly increase its appeal ↑
- Resale update bathroom fixtures and flooring — modernizing the bathrooms would significantly increase its appeal ↑
- Both paint exterior — painting the exterior would improve curb appeal and increase both resale and rental value ↑
ⓘ Cost ranges are severity-bucket heuristics (US national rule-of-thumb). Get contractor quotes + a written scope before underwriting a rehab budget.
Schools (NCES district)
- District
- Peoria Unified School District (4237)
- NCES district ID
- 0406250
- Math proficiency
- 36% ▼ -14.00%
- Reading proficiency
- 42% ▼ -8.00%
- Median HH income
- $60,171
- Composite
- 34.62/100
- National rank
- #5152
- State rank
- #64 of 249 in AZ
Livability — Peoria
- Score
- 76/100
- State rank
- #14
- US rank
- #3603
Category grades
Schools grade is shown separately in the Schools card above.
Census & demographics
- Census place
- Peoria, AZ
- County
- Maricopa County · 4,537,380 people
- City population
- 206,687
- Metro
- Phoenix-Mesa-Chandler, AZ
- Population (ZIP)
- 60,918
- Household income
- $67,380
- Rent vs Own
- Severe rent burden
- 1879.0
Population outlook (Maricopa County) Hauer SSP2
- Today (2025)
- 4,979,203 people
- By 2030
- 5,378,229 · +8.0%
- By 2040
- 6,156,598 · +23.6%
- By 2050
- 6,872,376 · +38.0%
- By 2075
- 8,401,270 · +68.7%
- By 2100
- 9,247,439 · +85.7%
Race, ethnicity, and origin ACS 2023
- Neighborhood character
- Diverse neighborhood (Simpson 0.62)
- Race & ethnicity
- White 51% Hispanic / Latino 34% Two or more races 14% Black 5% Asian 4% Native American 2%
- Hispanic origin (detail)
- Mexican 29%
- Common ancestry
- Romanian 2% Italian 2% Slovak 1%
- Foreign-born
- 13% · Canada, Vietnam
- Languages at home
- 76% English-only · Spanish 18% Other Indo-European 1% Vietnamese 1%
Political lean MEDSL · Maricopa
- 2024 margin
- Toss-up / Even · D 47.7% · R 51.2% · Other 1.1%
- 2008→2024 swing
- +7.1pp toward D · 2008: -10.6pp · 2024: -3.5pp
- All cycles
- 2024: R+3.5 2020: D+2.2 2016: R+3.5 2012: R+12.0 2008: R+10.6
Not yet ingested
- Civics
- —
Market trends
- HPI YoY
- ▼ -80.77%
- Current HPI
- 328.1069
- Rent YoY
- ▲ 0.62%
- Metro
- Phoenix-Mesa-Chandler, AZ
- State GDP YoY
- ▲ 4.54%
- F500 in state
- 20
Industry mix (Fortune 500 HQ in AZ)
| Industry | F500 HQs | Revenue |
|---|---|---|
| Technology | 2 | $13B |
|
||
| Mining / Metals | 1 | $23B |
|
||
| Environmental Services | 1 | $16B |
|
||
| Metals / Steel | 1 | $14B |
|
||
| Technology Distribution | 1 | $9B |
|
||
| Homebuilding | 1 | $8B |
|
||
Price history
2 events — show timeline
- 2026-04-27 Pending — ARMLS
- 2026-04-09 Listed $75,000 ARMLS
Cash-flow waterfall
monthlySold comps — $/sqft
last 12 mo · ≤1 miLoading sold comps…