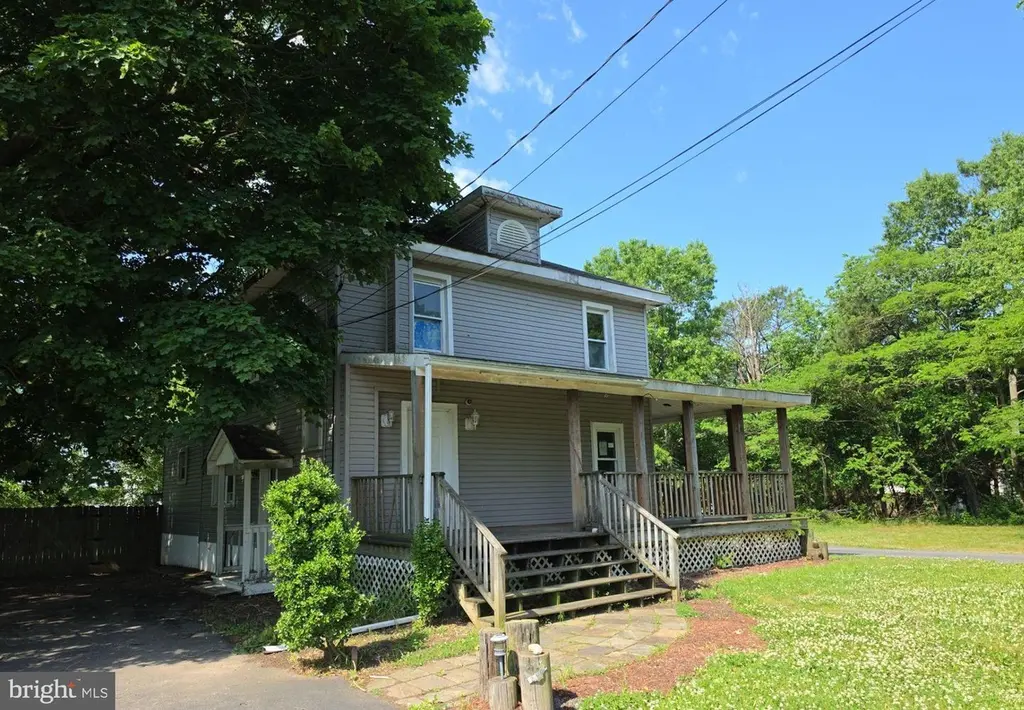
2755 Palermo Ave · Vineland, NJ
Flood risk 1/10 · Minimal
- FEMA flood zone
- X (unshaded)
- Chance of flooding over 30 yrs
- 0.0%
- Est. flood insurance / yr
- $507 – $1,088
Fire risk 6/10 · Moderate
- Est. fire insurance / yr
- $526 – $976
Heat risk 7/10 · Major
- Hot days now (above 102°F)
- 7 days/yr
- Hot days in 30 yrs
- 15 days/yr
Wind risk 6/10 · Moderate
- Chance of severe wind over 30 yrs
- 69.0%
Air-quality risk 3/10 · Minor
- Unhealthy air days now
- 2 days/yr
- Unhealthy air days in 30 yrs
- 4 days/yr
Risk factors via First Street. Map © Google.
Why this score? — see what drove the C- grade
The composite is a weighted blend of 9 inputs, each scored 0–100. Each bar is that input's sub-score; the figure is the points it added to the 100-point composite (weight × sub-score).
- Cash flow +15.2/30.0
- ARV discount +15.0/15.0
- 1% rule +5.1/10.0
- DSCR +4.7/10.0
- Livability +3.3/5.0
- Rent growth +2.5/5.0
- Condition / age +2.5/5.0
- Schools +1.9/10.0
- Appreciation +0.0/10.0
$225,000
🖨 Deal sheet 📄 Offer letter ✓ Due diligence
Listing remarks MLS
RENOVATED LARGE 2 STORY HOME WITH ABOVE GROUND POOL AND LARGE POLE BARN. POLE BARN HAS ELECTRIC AND WOOD STOVE. ADJACENT LOT (100X175) INCLUDED
Key facts
- Wrap around porch
- Open staircase
- Tile floors
Tags
Property features AI
Exterior
- Parking: Detached front-entry garage with 2 garage spaces; Driveway parking (total 2 garage/parking spaces)
- Utilities: Public water; Natural gas service; Forced air heating
- Home design: Detached structure; Frame construction
- Construction: Frame construction; Block foundation; Above grade and below grade structures
- Exterior features: Lot dimensions approximately 113 x 150; No tidal water
Interior
- Kitchen: Kitchen (appliance specifics not provided)
- Bedrooms: Three bedrooms on the upper level; One bedroom on the main level
- Bathrooms: Two full bathrooms (one on main level, one on upper level)
- Heating & cooling: Forced air heating; Natural gas hot water
- Interior features: Full, unfinished basement with interior access; Living room; Dining room; Kitchen
- Laundry & utility: Laundry area in the basement
Neighborhood map
What this means for you Summary
Snapshot
- This is a 4-bed/2.0-bath single-family listed at $225k.
Deal economics
- At list price, monthly cash flow is $80 ($956/yr) — positive.
- The deal already cash-flows at list — no discount required.
- Meets the 1% rule at list price ($2k rent vs $225k).
- Recommended offer: $222k (1.5% below list) — sets the bar for market timing.
- Cap rate 6.7% vs local median 4.5% in Vineland — top-decile yield for the area; either an underpriced asset or a hidden risk that comps aren't pricing in. Stress-test before assuming the spread holds.
Location & tenants
- Location reads 66/100 on livability (#363 in NJ) — a middle-class / working-renter tenant base. Strengths: housing A+, health & safety A+; Watch: employment D+, schools D, crime F.
- Vineland Public School District (urban): math 9% / reading 34% proficiency, ranked #418 of 472 in NJ (top 89%) — low school quality limits family demand, transient renter base, plan for 1-2y turnover.
- Market conditions: 87 active listings in the ZIP; 216 units permitted in Cumberland County in 2024 (73 in 5+ unit buildings).
Forward outlook
- Local home prices are declining (-3.0%/yr); year-one equity from $2k of loan paydown is wiped out by about $7k of value loss. Plan a longer hold.
- Cumberland County population projected to shrink 7% by 2050 — rents likely to lag national; underwrite the cash flow, not the appreciation.
Negotiation context
- It's been on market 16 days — a 2% lower offer ($222k) is reasonable based on typical stale-listing flexibility.
- 2 sale attempts since 27y ago with the ask held roughly flat each time — persistent listings suggest the price (not the market) is what's stuck; bring a comps-based counter.
Risks & watch-outs
- Watch-outs: built in 1920 — expect roof / HVAC / electrical / plumbing capex.
- Climate carrying-cost: major wind risk, 69% chance of damaging wind over 30y; major wildfire risk; extreme-heat days projected 7→15/yr by 2055 (HVAC capex compounding) — expect insurance premiums to compound above CPI over the hold.
Questions for the listing agent
- Built in 1920 — when were the roof, HVAC, electrical panel, plumbing, and water heater last replaced?
- Is there a deadline driving the sale (1031 exchange, divorce, estate, relocation)? That informs how much negotiation room exists.
- Schools are D-rated, which usually means shorter tenancies and higher turnover. Who's the typical renter profile here, and what's been the actual vacancy rate?
- Crime grade is F in this area — have there been break-ins, vandalism, or insurance claims at this property in the last 3 years? What carrier currently insures it and at what premium?
- What's the average days-on-market for RENTAL listings here right now (not sales)? A rising rental-DOM trend means longer vacancies and softer asking-rent achievability than the comps imply.
- What's the recent tenant-quality profile in this submarket — average credit score on applications, eviction rate, late-payment / NSF rate, and stable-employment percentage? A property-management company in the area should have these aggregated.
- How much new for-sale + rental construction is in the pipeline within 1–3 miles? Heavy new supply typically softens prices + rents 12–24 months out; constrained supply supports both.
Investment metrics
- 1% rule
- 1.01% ✓
- Cap rate
- 6.72%
- Cash-on-cash
- 1.52%
- DSCR
- 1.07
- GRM
- 8.2
CMA / ARV
- ARV (on-the-fly)
- $398,784
- Comps found
- 12
Show comp detail 12 sales within ~0.75 mi
| Address | Dist | Beds/Ba | Sqft | Sold | Price | $/sf | Match |
|---|---|---|---|---|---|---|---|
| 2994 Daphne Dr | 0.39mi | 4/2.5 | 1,708 (+6%) | 4mo | $425,000 | $249 | 67 |
| 3176 S Hance Bridge Rd | 0.50mi | 3/1.0 (-1) | 1,610 (+0%) | 1mo | $300,000 | $186 | 67 |
| 2454 Bella Rosa Ct | 0.34mi | 3/2.0 (-1) | 1,388 (-14%) | 1mo | $393,025 | $283 | 56 |
| 2270 Gettysburg Dr | 0.58mi | 3/2.5 (-1) | 1,656 (+3%) | 6mo | $411,000 | $248 | 56 |
| 2233 Musterel Ln | 0.60mi | 3/2.0 (-1) | 1,680 (+4%) | 9mo | $350,000 | $208 | 52 |
| 2297 Swan Dr | 0.41mi | 4/2.5 | 1,764 (+10%) | 14mo | $465,000 | $264 | 51 |
| 2303 Palermo Ave | 0.54mi | 3/2.0 (-1) | 1,523 (-5%) | 13mo | $410,000 | $269 | 50 |
| 2320 Brookfield St | 0.53mi | 3/2.0 (-1) | 1,742 (+8%) | 9mo | $325,000 | $187 | 49 |
| 2307 Musterel Ln | 0.62mi | 3/2.5 (-1) | 1,558 (-3%) | 12mo | $415,000 | $266 | 49 |
| 2281 Gettysburg Dr | 0.55mi | 3/2.0 (-1) | 1,702 (+6%) | 16mo | $320,000 | $188 | 47 |
| 3294 Hance Bridge Rd | 0.56mi | 4/2.5 | 1,376 (-14%) | 7mo | $197,000 | $143 | 42 |
| 2925 Rome Rd | 0.54mi | 3/1.0 (-1) | 1,404 (-13%) | 18mo | $255,000 | $182 | 30 |
Match score weights: distance 35% · size 25% · config 20% · recency 20%. Top-matched comps best support the ARV.
Projected returns pro-forma
-3.0% appreciation · 3.0% rent growth · sell at horizon
- IRR
- -13.8%
- Equity multiple
- 0.50×
- Total profit
- $-31,250
- Equity at exit
- $33,548
- IRR
- -4.9%
- Equity multiple
- 0.68×
- Total profit
- $-20,129
- Equity at exit
- $19,454
Cash invested: $63,000 (down + closing). Projections, not guarantees.
Landlord ↔ Tenant lean methodology
- Overall (STATE)
- 21 Tenant-Leaning
- State New Jersey
- 21 Tenant-Leaning · D+6
- County
- — inherits STATE
- City
- — inherits STATE
ZIP-level market 08361
- Active inventory
- 87
- Price-to-rent
- 8.2×
Monthly cashflow live
- Estimated rent
- $2,277 medium interval (Pro) →
- Mortgage (P&I)
- −$1,180
- Tax from tax record
- −$445 /mo · $5,344/yr
- Insurance
- −$94
- HOA
- −$0
- Vacancy / Maint / Mgmt
- −$478
- Net cashflow
- $80
Break-even live
UW: 25.0% down · 7.5% · 30yr · 1.5% tax · 5.0% vac · 8.0% maint · 8.0% mgmt
Financing live
Cash to close
- Down payment
- $56,250
- Closing costs
- $6,750
- Reserves months
- —
- Total cash needed
- —
Loan-product check · same deal, 3 products live
Conventional
25% down · 7.5% · 30yr
- Down + closing
- —
- Monthly P&I
- —
- Monthly cashflow
- —
- DSCR
- —
- Eligible?
- —
Personal DTI + credit; lowest rate.
DSCR
20% down · 8.5% · 30yr
- Down + closing
- —
- Monthly P&I
- —
- Monthly cashflow
- —
- DSCR
- —
- Eligible?
- —
No personal income docs; deal must DSCR.
Hard money
10% down · 12.0% · 12mo
- Down + closing
- —
- Monthly P&I
- —
- Monthly cashflow
- —
- DSCR
- —
- Eligible?
- —
Short-term bridge; refi at stabilization.
Listing history 13 events
-
2026-06-19days on market $225,000 Active 16 DOM
-
2026-06-18days on market $225,000 Active 15 DOM
-
2026-06-17days on market $225,000 Active 14 DOM
-
2026-06-16days on market $225,000 Active 13 DOM
-
2026-06-15days on market $225,000 Active 12 DOM
-
2026-06-14days on market $225,000 Active 10 DOM
-
2026-06-13days on market $225,000 Active 9 DOM
-
2026-06-10days on market $225,000 Active 7 DOM
-
2026-06-09days on market $225,000 Active 6 DOM
-
2026-06-08days on market $225,000 Active 5 DOM
-
2026-06-07days on market $225,000 Active 4 DOM
-
2026-06-03remarks 351-char remark
-
2026-06-03$225,000 Active 1 DOM
ⓘ Source: listings_history table (triggers on properties + properties_extension) + one-shot
backfill from property_details.listing_events for pre-trigger history.
Tax reassessment forecast NJ · Partial reset (capped growth)
- Current annual tax
- $5,344 · $445/mo
- Projected year-2 tax
- $5,473 · $456/mo
- Expected delta
- +$129/yr (+$11/mo · 2.4%)
ⓘ Screening estimate from a state-policy table — verify with the county assessor before closing.
Climate risk First Street
- Flood 1/10 Low FEMA zone X (unshaded) · 0% chance over 30 yrs
- Wildfire 6/10 Major
- Heat 7/10 Severe 7 d/yr ≥102°F today · 15 d/yr by 30 yrs out
- Wind 6/10 Major 69% chance of damaging wind over 30 yrs
- Air quality 3/10 Moderate 2 unhealthy d/yr today · 4 by 30 yrs out
Nearby sold comps map
Loading sold comps map…
Walkable amenities ~0.75 mi
Loading nearby amenities…
Taxation est. · year 1
- Rental income
- $27,322
- − Mortgage interest
- −$12,603
- − Property taxes
- −$5,344
- − Insurance
- −$1,125
- − Repairs & maintenance
- −$2,186
- − Management
- −$2,186
- − Depreciation
- −$6,545
- Taxable loss
- −$2,668
- Est. tax savings @ 24.0%
- +$640
- After-tax cash flow
- $1,596/yr
For passive investors: Depreciation is non-cash, so a rental often shows a tax loss while cash-flowing — sheltering income. Rental losses are passive: they offset passive income freely, and up to $25,000/yr can offset ordinary (W-2) income if you actively participate and your MAGI is under $100k (phasing out to $0 by $150k); unused losses carry forward. On sale, claimed depreciation is recaptured at up to 25%, and gains may owe capital-gains tax (a 1031 exchange can defer both). Figures are a year-1 estimate at your 24.0% rate — not tax advice; consult a CPA.
Schools (NCES district)
- District
- Vineland Public School District
- NCES district ID
- 3416800
- Math proficiency
- 9% ▼ -17.00%
- Reading proficiency
- 34% ▬ 0.00%
- Median HH income
- $51,168
- Composite
- 19.17/100
- National rank
- #8819
- State rank
- #418 of 472 in NJ
Livability — Vineland
- Score
- 66/100
- State rank
- #363
- US rank
- #12180
Category grades
Schools grade is shown separately in the Schools card above.
Census & demographics
- Census place
- Vineland, NJ
- City population
- 45,038
- Population (ZIP)
- 18,375
Population outlook (Cumberland County) Hauer SSP2
- Today (2025)
- 152,743 people
- By 2030
- 150,373 · -1.6%
- By 2040
- 146,881 · -3.8%
- By 2050
- 142,653 · -6.6%
- By 2075
- 129,468 · -15.2%
- By 2100
- 107,456 · -29.6%
Race, ethnicity, and origin ACS 2023
- Neighborhood character
- Diverse neighborhood (Simpson 0.59)
- Race & ethnicity
- White 57% Hispanic / Latino 27% Two or more races 13% Black 10% Asian 3% Native American 2%
- Hispanic origin (detail)
- Mexican 2% Puerto Rican 20% Dominican 3%
- Common ancestry
- Romanian 2% Scotch-Irish 2% Subsaharan African 2%
- Foreign-born
- 9% · Canada
- Languages at home
- 75% English-only · Spanish 16% Other Indo-European 4% Russian/Polish/Slavic 2%
Political lean MEDSL · Cumberland
- 2024 margin
- Toss-up / Even · D 47.6% · R 51.3% · Other 1.1%
- 2008→2024 swing
- -25.4pp toward R · 2008: 21.6pp · 2024: -3.8pp
- All cycles
- 2024: R+3.8 2020: D+6.0 2016: D+5.3 2012: D+23.1 2008: D+21.6
Not yet ingested
- Civics
- —
Market trends
- HPI YoY
- ▼ -215.80%
- Current HPI
- 291.3404
- Rent YoY
- —
- Metro
- —
- State GDP YoY
- ▲ 2.05%
- F500 in state
- 34
Industry mix (Fortune 500 HQ in NJ)
| Industry | F500 HQs | Revenue |
|---|---|---|
| Consumer Goods | 3 | $31B |
|
||
| Pharmaceuticals | 2 | $153B |
|
||
| Technology | 2 | $21B |
|
||
| Insurance | 2 | $20B |
|
||
| Healthcare | 2 | $19B |
|
||
| Financial Services | 1 | $70B |
|
||
Price history
+221.4% since first listed8 events — show timeline
- 2026-06-03 Listed $225,000 BRIGHT MLS
- 2007-12-20 Sold (Public Records) $275,000 Public Records
- 1999-12-06 Sold (Public Records) $112,500 Public Records
- 1999-11-24 Sold (MLS) $112,500 SJSRMLS
- 1999-10-07 Listing Removed — SJSRMLS
- 1999-09-11 Listed $114,000 SJSRMLS
- 1995-09-27 Sold (Public Records) $45,000 Public Records
- 1991-09-06 Sold (Public Records) $70,000 Public Records
Property tax history
+3.2%/yrLatest (2025): $5,344 · +3.9% YoY. Source: county tax records.
Cash-flow waterfall
monthlySold comps — $/sqft
last 12 mo · ≤1 miLoading sold comps…