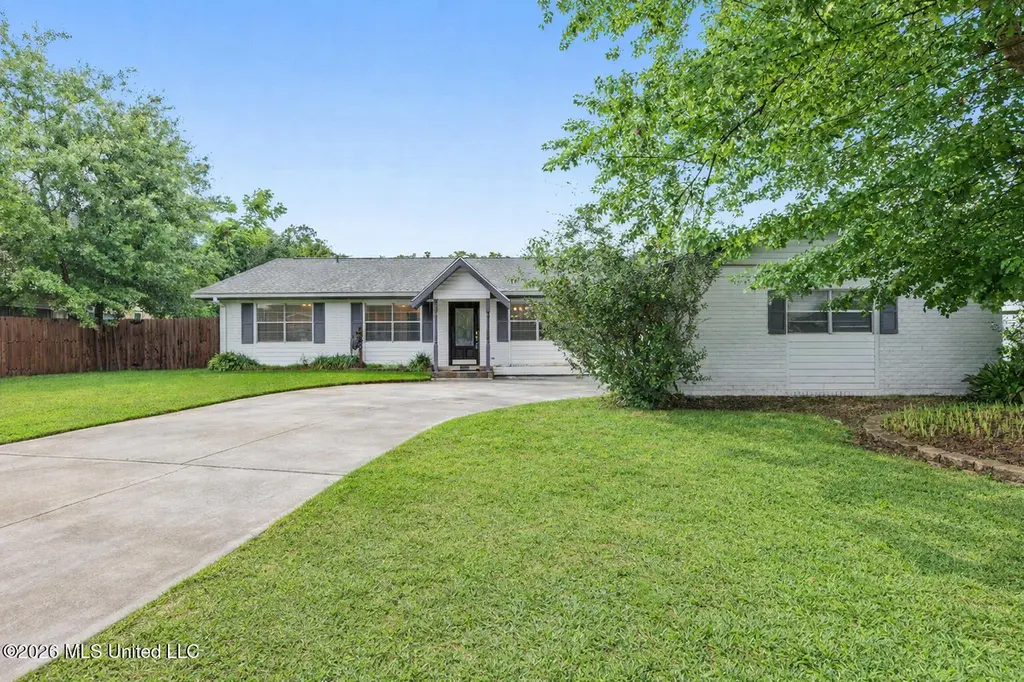
15250 Royal St · Gulfport, MS
Flood risk 1/10 · Minimal
- FEMA flood zone
- X (unshaded)
- Chance of flooding over 30 yrs
- 0.0%
- Est. flood insurance / yr
- $507 – $1,088
Fire risk 3/10 · Minor
- Est. fire insurance / yr
- $1,241 – $2,305
Heat risk 10/10 · Severe
- Hot days now (above 107°F)
- 7 days/yr
- Hot days in 30 yrs
- 23 days/yr
Wind risk 9/10 · Severe
- Chance of severe wind over 30 yrs
- 99.0%
Air-quality risk 1/10 · Minimal
- Unhealthy air days now
- 0 days/yr
- Unhealthy air days in 30 yrs
- 0 days/yr
Risk factors via First Street. Map © Google.
Why this score? — see what drove the D grade
The composite is a weighted blend of 9 inputs, each scored 0–100. Each bar is that input's sub-score; the figure is the points it added to the 100-point composite (weight × sub-score).
- Cash flow +12.7/30.0
- ARV discount +10.3/15.0
- Rent growth +4.2/5.0
- Schools +4.2/10.0
- DSCR +3.8/10.0
- Livability +3.7/5.0
- 1% rule +2.7/10.0
- Condition / age +2.5/5.0
- Appreciation +0.0/10.0
$230,000
🖨 Deal sheet 📄 Offer letter ✓ Due diligence
Listing remarks MLS
Welcome home! A spacious 3 bedroom, 2.5 bath home which includes two living rooms and a nice sized Florida room with a/c. This property has a beautiful backyard with an in ground pool, perfect for beating the Mississippi heat! Located in the well established neighborhood of Northwood Hills, near shopping, restaurants and only a few miles from I10 or beaches.
Key facts
- Short drive from i10
- Florida room
- Inground pool
Tags
Property features AI
Exterior
- Parking: 2 total parking spaces; 2-car garage; Driveway; Garage door opener
- Security: Prewired security
- Utilities: Public water; Public sewer; Electricity connected
- Home design: Single family residence (house); One level
- Construction: Solid masonry and wood siding construction; Asphalt shingle roof; Slab foundation; Built (year per public records)
- Exterior features: Private in-ground pool; Rain gutters; Fenced yard; Front yard fencing; Other exterior features (see remarks)
Interior
- Kitchen: Cooktop; Dishwasher; Disposal; Double oven; Oven
- Flooring: Carpet; Ceramic tile; See remarks
- Bathrooms: 2 full bathrooms and 1 half bathroom (3 total)
- Heating & cooling: Central heating (electric and natural gas); Central air; Ceiling fans; Window unit(s)
- Interior features: Ceiling fan(s); Stone counters; Walk-in closet(s); Window treatments; Sliding doors; Fireplace (see remarks)
Neighborhood map
What this means for you Summary
Snapshot
- This is a 3-bed/1.0-bath single-family listed at $230k.
Deal economics
- At list price, monthly cash flow is $-25 ($-301/yr) — negative.
- To cash-flow at today's rent, offer at most $226k (1.9% below list).
- To meet the 1% rule (rent ≥ 1% of price), the offer needs to be $176k (23.5% below list).
- Recommended offer: $176k (23.5% below list) — sets the bar for 1% rule.
- Cap rate 6.2% vs local median 4.9% in Gulfport — meaningfully above typical; check what's discounted (condition, days-on-market, listing class) to confirm the premium yield is real.
Location & tenants
- Location reads 73/100 on livability (#15 in MS) — a middle-class / working-renter tenant base. Strengths: cost of living A+, housing A+, health & safety A+; Watch: schools D, amenities F, commute F.
- Harrison County School District (rural): math 52% / reading 46% proficiency, ranked #14 of 130 in MS (top 11%) — families likely to look elsewhere, expect single-tenant / working-renter base with shorter leases; 62% free/reduced lunch — lower-income household profile, screen leases tightly.
- Market conditions: Rents rising fast (+7.0%/yr); 763 active listings in the ZIP; 12 comparable units currently listed for rent nearby; rentals at typical pace (median 21d on market — plan ~3-4 weeks tenant-placement turnaround); 42% of comp listings sitting > 30 days — soft ceiling on asking rent; 2,194 units permitted in Harrison County in 2024 (0 in 5+ unit buildings).
- This rent runs 34% of the median local income ($63k/yr) — at the standard rent-burdened threshold; future hikes will face affordability resistance.
Forward outlook
- Local home prices are declining (-3.0%/yr); year-one equity from $2k of loan paydown is wiped out by about $7k of value loss. Plan a longer hold.
- Harrison County population projected at +27% by 2050 — long-run rental-demand tailwind backs the buy-and-hold thesis.
Negotiation context
- It's been on market 16 days — a 2% lower offer ($227k) is reasonable based on typical stale-listing flexibility.
- 5 sale attempts since 14y ago with the ask held roughly flat each time — persistent listings suggest the price (not the market) is what's stuck; bring a comps-based counter.
- Current owner paid $128k; list at $230k implies a 80% gain — meaningful room to come down on a strong offer.
Risks & watch-outs
- Climate carrying-cost: severe wind risk, 99% chance of damaging wind over 30y; extreme-heat days projected 7→23/yr by 2055 (HVAC capex compounding) — expect insurance premiums to compound above CPI over the hold.
Questions for the listing agent
- What do current leases actually rent for vs. the listed asking? Can we see a recent rent roll and the last 12 months of T-12 income?
- Built in 1966 — when were the roof, HVAC, electrical panel, plumbing, and water heater last replaced?
- Is there a deadline driving the sale (1031 exchange, divorce, estate, relocation)? That informs how much negotiation room exists.
- Schools are D-rated, which usually means shorter tenancies and higher turnover. Who's the typical renter profile here, and what's been the actual vacancy rate?
- The area grade is low — what's the realistic commute time and amenity access for the typical tenant pool here? Any planned neighborhood developments (good or bad) we should know about?
- What's the average days-on-market for RENTAL listings here right now (not sales)? A rising rental-DOM trend means longer vacancies and softer asking-rent achievability than the comps imply.
- What's the recent tenant-quality profile in this submarket — average credit score on applications, eviction rate, late-payment / NSF rate, and stable-employment percentage? A property-management company in the area should have these aggregated.
- How much new for-sale + rental construction is in the pipeline within 1–3 miles? Heavy new supply typically softens prices + rents 12–24 months out; constrained supply supports both.
Investment metrics
- 1% rule
- 0.77% ✗
- Cap rate
- 6.16%
- Cash-on-cash
- -0.47%
- DSCR
- 0.98
- GRM
- 10.9
CMA / ARV
- ARV (on-the-fly)
- $244,986
- Comps found
- 12
Show comp detail 12 sales within ~0.75 mi
| Address | Dist | Beds/Ba | Sqft | Sold | Price | $/sf | Match |
|---|---|---|---|---|---|---|---|
| 15299 Oakwood Ct | 0.31mi | 3/2.0 | 1,845 (+0%) | 0mo | $215,000 | $117 | 81 |
| 11523 Lafitte Pl | 0.19mi | 4/2.0 (+1) | 1,933 (+5%) | 2mo | $225,000 | $116 | 72 |
| 15176 Royal St | 0.14mi | 3/2.0 | 1,621 (-12%) | 0mo | $214,900 | $133 | 69 |
| 14663 Dawn Cv | 0.31mi | 4/2.0 (+1) | 1,778 (-4%) | 3mo | $255,000 | $143 | 68 |
| 15208 Cindy Cv | 0.21mi | 3/3.0 | 1,664 (-10%) | 3mo | $150,000 | $90 | 64 |
| 15236 Ginger Cv | 0.26mi | 3/2.0 | 1,632 (-11%) | 2mo | $249,200 | $153 | 63 |
| 15030 Government St | 0.43mi | 3/2.0 | 1,750 (-5%) | 6mo | $194,900 | $111 | 62 |
| 15044 Dedeaux Rd | 0.68mi | 3/1.0 | 1,739 (-6%) | 6mo | $127,200 | $73 | 54 |
| 12231 Charwood Ave | 0.42mi | 3/2.0 | 1,630 (-12%) | 6mo | $245,000 | $150 | 53 |
| 12317 Charwood Ave | 0.55mi | 4/3.0 (+1) | 1,724 (-6%) | 1mo | $259,900 | $151 | 50 |
| 11309 Klein Rd | 0.68mi | 3/2.0 | 1,643 (-11%) | 0mo | $158,950 | $97 | 46 |
| 15410 N Parkwood Dr | 0.65mi | 3/2.0 | 1,654 (-10%) | 3mo | $224,900 | $136 | 46 |
Match score weights: distance 35% · size 25% · config 20% · recency 20%. Top-matched comps best support the ARV.
Projected returns pro-forma
-3.0% appreciation · 6.99% rent growth · sell at horizon
- IRR
- -13.2%
- Equity multiple
- 0.51×
- Total profit
- $-31,600
- Equity at exit
- $34,294
- IRR
- 0.5%
- Equity multiple
- 1.04×
- Total profit
- $2,848
- Equity at exit
- $19,886
Cash invested: $64,400 (down + closing). Projections, not guarantees.
Landlord ↔ Tenant lean methodology
- Overall (STATE)
- 90 Strongly Landlord-Friendly
- State Mississippi
- 90 Strongly Landlord-Friendly · R+11
- County
- — inherits STATE
- City
- — inherits STATE
ZIP-level market 39503
- Home prices YoY
- -21.5%
- Rents YoY
- 7.0%
- Active inventory
- 763
- Price-to-rent
- 10.9×
Monthly cashflow live
- Estimated rent
- $1,760 high interval (Pro) →
- Mortgage (P&I)
- −$1,206
- Tax from tax record
- −$114 /mo · $1,365/yr
- Insurance
- −$96
- HOA
- −$0
- Vacancy / Maint / Mgmt
- −$370
- Net cashflow
- $-25
Break-even live
UW: 25.0% down · 7.5% · 30yr · 1.5% tax · 5.0% vac · 8.0% maint · 8.0% mgmt
Financing live
Cash to close
- Down payment
- $57,500
- Closing costs
- $6,900
- Reserves months
- —
- Total cash needed
- —
Loan-product check · same deal, 3 products live
Conventional
25% down · 7.5% · 30yr
- Down + closing
- —
- Monthly P&I
- —
- Monthly cashflow
- —
- DSCR
- —
- Eligible?
- —
Personal DTI + credit; lowest rate.
DSCR
20% down · 8.5% · 30yr
- Down + closing
- —
- Monthly P&I
- —
- Monthly cashflow
- —
- DSCR
- —
- Eligible?
- —
No personal income docs; deal must DSCR.
Hard money
10% down · 12.0% · 12mo
- Down + closing
- —
- Monthly P&I
- —
- Monthly cashflow
- —
- DSCR
- —
- Eligible?
- —
Short-term bridge; refi at stabilization.
Rent comps 12 comps
| Address | Beds | Baths | Sqft | Rent | $/sqft | DOM | Units | Dist |
|---|---|---|---|---|---|---|---|---|
| 15373 Saint Charles St Gulfport, MS | 3.0 | 1.0–3.0 | 1075 | $1,350 | $1.26 | 43d | 2 | 0.25mi |
| 11502 Camden Court Cir Gulfport, MS | 3.0 | 2.0 | 1495 | $1,775 | $1.19 | 21d | 1 | 0.37mi |
| 11487 Camden Court Cir Gulfport, MS | 3.0 | 2.0 | 1495 | $1,775 | $1.19 | 43d | 1 | 0.42mi |
| 11425 Camden Court Cir Gulfport, MS | 3.0 | 2.0 | 1495 | $1,775 | $1.19 | 21d | 1 | 0.42mi |
| 11405 Camden Court Cir Gulfport, MS | 3.0 | 2.0 | 1495 | $1,775 | $1.19 | 43d | 1 | 0.42mi |
| 11413 Camden Court Cir Gulfport, MS | 3.0 | 2.0 | 1495 | $1,775 | $1.19 | 43d | 1 | 0.42mi |
| 125 Clarence Dr Gulfport, MS | 3.0 | 2.0 | 1300 | $1,500 | $1.15 | 13d | 1 | 0.72mi |
| 12237 Vada Dr Gulfport, MS | 3.0 | 1.0 | 1350 | $1,349 | $1.00 | 13d | 1 | 1.05mi |
| 1009 Michelle Dr Gulfport, MS | 4.0 | 2.0 | 1254 | $1,650 | $1.32 | 43d | 1 | 1.10mi |
| 11601 Oaklane Dr Gulfport, MS | 3.0 | 2.0 | 1568 | $1,525 | $0.97 | 13d | 1 | 1.27mi |
| 15334 Oak Creek Cv Gulfport, MS | 4.0 | 2.0 | 1730 | $2,149 | $1.24 | 21d | 1 | 1.29mi |
| 10466 Steeplechase Dr Gulfport, MS | 3.0 | 2.0 | 1677 | $1,800 | $1.07 | 13d | 1 | 1.47mi |
Listing history 12 events
-
2026-06-18status $230,000 Pending 16 DOM
-
2026-06-17days on market $230,000 Active 16 DOM
-
2026-06-16days on market $230,000 Active 15 DOM
-
2026-06-15days on market $230,000 Active 14 DOM
-
2026-06-14days on market $230,000 Active 12 DOM
-
2026-06-13days on market $230,000 Active 11 DOM
-
2026-06-10days on market $230,000 Active 9 DOM
-
2026-06-09days on market $230,000 Active 8 DOM
-
2026-06-08days on market $230,000 Active 7 DOM
-
2026-06-07days on market $230,000 Active 6 DOM
-
2026-06-01remarks 478-char remark
-
2026-06-01$230,000 Active 1 DOM
ⓘ Source: listings_history table (triggers on properties + properties_extension) + one-shot
backfill from property_details.listing_events for pre-trigger history.
Tax reassessment forecast MS · Resets to sale price
- Current annual tax
- $1,365 · $114/mo
- Projected year-2 tax
- $1,817 · $151/mo
- Expected delta
- +$452/yr (+$38/mo · 33.1%)
ⓘ Screening estimate from a state-policy table — verify with the county assessor before closing.
Climate risk First Street
- Flood 1/10 Low FEMA zone X (unshaded) · 0% chance over 30 yrs
- Wildfire 3/10 Moderate
- Heat 10/10 Extreme 7 d/yr ≥107°F today · 23 d/yr by 30 yrs out
- Wind 9/10 Extreme 99% chance of damaging wind over 30 yrs
- Air quality 1/10 Low 0 unhealthy d/yr today · 0 by 30 yrs out
Nearby sold comps map
Loading sold comps map…
Walkable amenities ~0.75 mi
Loading nearby amenities…
Taxation est. · year 1
- Rental income
- $21,124
- − Mortgage interest
- −$12,884
- − Property taxes
- −$1,365
- − Insurance
- −$1,150
- − Repairs & maintenance
- −$1,690
- − Management
- −$1,690
- − Depreciation
- −$6,691
- Taxable loss
- −$4,346
- Est. tax savings @ 24.0%
- +$1,043
- After-tax cash flow
- $742/yr
For passive investors: Depreciation is non-cash, so a rental often shows a tax loss while cash-flowing — sheltering income. Rental losses are passive: they offset passive income freely, and up to $25,000/yr can offset ordinary (W-2) income if you actively participate and your MAGI is under $100k (phasing out to $0 by $150k); unused losses carry forward. On sale, claimed depreciation is recaptured at up to 25%, and gains may owe capital-gains tax (a 1031 exchange can defer both). Figures are a year-1 estimate at your 24.0% rate — not tax advice; consult a CPA.
Schools (NCES district)
- District
- Harrison County School District
- NCES district ID
- 2801770
- Math proficiency
- 52% ▼ -4.00%
- Reading proficiency
- 46% ▼ -4.00%
- Median HH income
- $46,504
- Composite
- 41.66/100
- National rank
- #3419
- State rank
- #14 of 130 in MS
Livability — Gulfport
- Score
- 73/100
- State rank
- #15
- US rank
- #5010
Category grades
Schools grade is shown separately in the Schools card above.
Census & demographics
- Census place
- Gulfport, MS
- County
- Harrison County · 178,171 people
- City population
- 96,188
- Metro
- Gulfport-Biloxi, MS
- Population (ZIP)
- 55,059
- Household income
- $62,641
- Rent vs Own
- Severe rent burden
- 1686.0
Population outlook (Harrison County) Hauer SSP2
- Today (2025)
- 228,444 people
- By 2030
- 241,942 · +5.9%
- By 2040
- 267,531 · +17.1%
- By 2050
- 291,062 · +27.4%
- By 2075
- 346,711 · +51.8%
- By 2100
- 378,165 · +65.5%
Race, ethnicity, and origin ACS 2023
- Neighborhood character
- Diverse neighborhood (Simpson 0.58)
- Race & ethnicity
- White 58% Black 27% Two or more races 9% Hispanic / Latino 6% Asian 2%
- Hispanic origin (detail)
- Mexican 2% Puerto Rican 1%
- Common ancestry
- Lithuanian 5% Slovak 1% Portuguese 1%
- Foreign-born
- 3% · Canada
- Languages at home
- 95% English-only · Spanish 3%
Political lean MEDSL · Harrison
- 2024 margin
- Strong R (+28.9) · D 35.0% · R 63.9% · Other 1.1%
- 2008→2024 swing
- -2.9pp toward R · 2008: -26.0pp · 2024: -28.9pp
- All cycles
- 2024: R+28.9 2020: R+25.2 2016: R+30.7 2012: R+26.6 2008: R+26.0
Not yet ingested
- Civics
- —
Market trends
- HPI YoY
- ▼ -51.39%
- Current HPI
- 187.285
- Rent YoY
- ▲ 6.99%
- Metro
- Gulfport-Biloxi, MS
- State GDP YoY
- —
- F500 in state
- 0
Price history
+284.0% since first listed11 events — show timeline
- 2026-06-01 Relisted — MLSU
- 2026-05-28 Listing Removed — MLSU
- 2026-05-28 Listed $230,000 MLSU
- 2021-08-02 Sold (Public Records) — Public Records
- 2021-07-30 Sold (MLS) — MLSU
- 2021-06-03 Listed $184,900 MLSU
- 2013-08-09 Sold (Public Records) $128,000 Public Records
- 2013-08-02 Sold (MLS) — MLSU
- 2013-05-20 Listed $129,999 MLSU
- 2013-03-11 Sold (MLS) — MLSU
- 2012-12-06 Listed $59,900 MLSU
Property tax history
+2.5%/yrLatest (2025): $1,365 · +5.3% YoY. Source: county tax records.
Cash-flow waterfall
monthlySold comps — $/sqft
last 12 mo · ≤1 miLoading sold comps…