 🏗️ New Construction
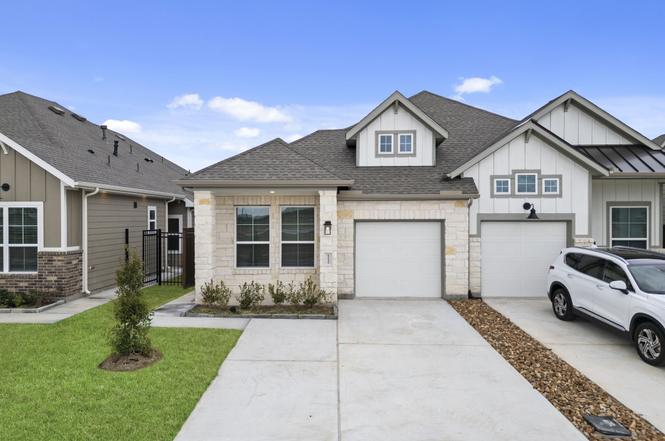
5235 Celestial Ct · Manvel, TX
Flood risk 5/10 · Moderate
- FEMA flood zone
- X (unshaded)
- Chance of flooding over 30 yrs
- 0.67%
- Est. flood insurance / yr
- $507 – $1,088
Fire risk 7/10 · Major
- Est. fire insurance / yr
- $1,222 – $2,270
Heat risk 9/10 · Severe
- Hot days now (above 109°F)
- 7 days/yr
- Hot days in 30 yrs
- 23 days/yr
Wind risk 9/10 · Severe
- Chance of severe wind over 30 yrs
- 99.0%
Air-quality risk 3/10 · Minor
- Unhealthy air days now
- 2 days/yr
- Unhealthy air days in 30 yrs
- 3 days/yr
Risk factors via First Street. Map © Google.
Why this score? — see what drove the D- grade
The composite is a weighted blend of 9 inputs, each scored 0–100. Each bar is that input's sub-score; the figure is the points it added to the 100-point composite (weight × sub-score).
- Cash flow +12.5/30.0
- ARV discount +7.5/15.0
- Schools +3.9/10.0
- DSCR +3.7/10.0
- Livability +3.4/5.0
- 1% rule +3.1/10.0
- Rent growth +2.6/5.0
- Condition / age +2.5/5.0
- Appreciation +0.0/10.0
$274,990
🖨 Deal sheet (PDF) 📄 Offer letter ✓ Due diligence
Listing remarks
MOVE IN READY!! This Stunning Plan, with Luxury Touches throughout, is sure to Impress All! This Home houses 3 Bedrooms, 2 Baths, Covered Patio +1 Car Garage! The Open Concept Features Beautiful Upgraded Cabinets, Upgraded Tile Flooring, Quartz Countertops, Stainless Steel Appliances, and Elevated Kitchen Backsplash. The primary bedroom features a large walk-in shower, Dual Vanities, and a Spectacular Layout. This Stunning Plan, with Luxury Touches throughout, is sure to Impress All! For more info, contact Chesmar Homes in Meridiana.
Key facts
- Quartz countertops
- Covered patio
- Upgraded cabinets
Tags
Property features AI
Finance
- HOA & community: Community managed by Inframark; Annual association fee for recreation facilities; Community amenities include: clubhouse, fitness center, pool, tennis courts, basketball court, sport court, playground, park, trails, picnic area, dog park, and lake/pond
Exterior
- Parking: Attached garage (1 car)
- Security: Owned security system
- Utilities: Public water; Public sewer
- Home design: Single-story residential home; New construction by Chesmar Homes; Full ownership; Entry level: first floor
- Construction: Built in 2025; Brick, cement siding, and stone exterior; Composition roof; Slab foundation
- Exterior features: Sprinkler/Irrigation system; Private yard; Pond on lot; Association pool
Interior
- Kitchen: Convection oven; Gas oven; Gas cooktop; Microwave; Dishwasher; Disposal; Refrigerator; Kitchen island; Granite counters; ENERGY STAR qualified appliances
- Bedrooms: Primary bedroom on the first floor (15' x 12'); Bedroom on the first floor (11'3" x 10'); Bedroom on the first floor (11'0" x 10')
- Flooring: Carpet; Tile
- Bathrooms: 2 full bathrooms
- Heating & cooling: Central heating (gas); Central electric air conditioning
- Interior features: Double vanity; Granite counters; High ceilings; Kitchen island; Tub with shower; Programmable thermostat; Ventilation for improved indoor air quality; Radiant attic barrier
- Laundry & utility: Washer; Dryer
Neighborhood map
What this means for you Summary
Snapshot
- This is a 3-bed/2.0-bath townhouse listed at $275k.
Deal economics
- At list price, monthly cash flow is $-38 ($-459/yr) — negative.
- To cash-flow at today's rent, offer at most $271k (1.5% below list).
- To meet the 1% rule (rent ≥ 1% of price), the offer needs to be $226k (17.9% below list).
- Recommended offer: $226k (17.9% below list) — sets the bar for 1% rule.
- Cap rate 6.1% vs local median 2.2% in Manvel — top-decile yield for the area; either an underpriced asset or a hidden risk that comps aren't pricing in. Stress-test before assuming the spread holds.
Location & tenants
- Location reads 67/100 on livability (#544 in TX) — a middle-class / working-renter tenant base. Strengths: crime A+, employment A+, housing A+; Watch: amenities F, commute F, health & safety F.
- Alvin ISD (suburban): math 39% / reading 48% proficiency, ranked #255 of 826 in TX (top 31%) — families likely to look elsewhere, expect single-tenant / working-renter base with shorter leases.
- Zoned schools: Meridiana El (math 39% / reading 41%, grade F, #1,514 of 4,322 statewide, top 36%, 998 students, 42% FRL); Iowa Colony H S (792 students, 56% FRL) — zoned schools at 49% FRL track the district average.
- Market conditions: Rents flat; 1148 active listings in the ZIP; 1 comparable units currently listed for rent nearby; high-income renter base; 3,960 units permitted in Brazoria County in 2024 (593 in 5+ unit buildings).
Forward outlook
- Local home prices are declining (-3.0%/yr); year-one equity from $2k of loan paydown is wiped out by about $8k of value loss. Plan a longer hold.
- Brazoria County population projected at +44% by 2050 — long-run rental-demand tailwind backs the buy-and-hold thesis.
Negotiation context
- It's been on market 68 days — a 6% lower offer ($258k) is reasonable based on typical stale-listing flexibility.
- 2 sale attempts with the ask held roughly flat each time — persistent listings suggest the price (not the market) is what's stuck; bring a comps-based counter.
Risks & watch-outs
- Climate carrying-cost: moderate flood risk; severe wind risk, 99% chance of damaging wind over 30y; major wildfire risk; extreme-heat days projected 7→23/yr by 2055 (HVAC capex compounding) — expect insurance premiums to compound above CPI over the hold.
Questions for the listing agent
- What do current leases actually rent for vs. the listed asking? Can we see a recent rent roll and the last 12 months of T-12 income?
- It's been on market 68 days. Have you received any prior offers? Is the seller open to a 18% concession, seller financing, or rate buy-down credit?
- What does the HOA fee cover, when was the last increase, and are there any pending special assessments or reserve-fund shortfalls?
- Why hasn't it sold? Are there any deal-killer items the seller is aware of (foundation, flood, title, zoning, code violations)?
- Is there a deadline driving the sale (1031 exchange, divorce, estate, relocation)? That informs how much negotiation room exists.
- The area grade is low — what's the realistic commute time and amenity access for the typical tenant pool here? Any planned neighborhood developments (good or bad) we should know about?
- What's the average days-on-market for RENTAL listings here right now (not sales)? A rising rental-DOM trend means longer vacancies and softer asking-rent achievability than the comps imply.
- What's the recent tenant-quality profile in this submarket — average credit score on applications, eviction rate, late-payment / NSF rate, and stable-employment percentage? A property-management company in the area should have these aggregated.
- How much new for-sale + rental construction is in the pipeline within 1–3 miles? Heavy new supply typically softens prices + rents 12–24 months out; constrained supply supports both.
Investment metrics
- 1% rule
- 0.81% ✗
- Cap rate
- 6.13%
- Cash-on-cash
- -0.59%
- DSCR
- 0.97
- GRM
- 10.3
CMA / ARV
- ARV (on-the-fly)
- $277,632
- Comps found
- 12
Show comp detail 12 sales within ~0.75 mi
| Address | Dist | Beds/Ba | Sqft | Sold | Price | $/sf | Match |
|---|---|---|---|---|---|---|---|
| 5235 Celestial Ct | 0.00mi | 3/2.0 | 1,446 (0%) | 1mo | $274,990 | $190 | 99 |
| 5255 Celestial Ct | 0.02mi | 3/2.0 | 1,508 (+4%) | 2mo | $284,990 | $189 | 90 |
| 5246 Big Dipper Dr | 0.13mi | 3/2.0 | 1,508 (+4%) | 2mo | $275,990 | $183 | 85 |
| 10115 Crescendo Way | 0.30mi | 3/2.0 | 1,446 (0%) | 4mo | $274,000 | $189 | 83 |
| 5231 Celestial Ct | 0.04mi | 2/2.0 (-1) | 1,360 (-6%) | 1mo | $267,015 | $196 | 82 |
| 10119 Crescendo Way | 0.30mi | 3/2.0 | 1,508 (+4%) | 3mo | $280,000 | $186 | 76 |
| 10035 Crescendo Way | 0.25mi | 3/2.0 | 1,446 (0%) | 18mo | $260,000 | $180 | 73 |
| 10027 Crescendo Way | 0.24mi | 3/2.0 | 1,446 (0%) | 20mo | $277,865 | $192 | 72 |
| 10019 Crescendo Way | 0.24mi | 3/2.0 | 1,446 (0%) | 21mo | $278,790 | $193 | 72 |
| 10018 Crescendo Way | 0.26mi | 3/2.0 | 1,446 (0%) | 23mo | $287,840 | $199 | 69 |
| 10026 Crescendo Way | 0.27mi | 3/2.0 | 1,446 (0%) | 23mo | $288,565 | $200 | 68 |
| 10015 Crescendo Way | 0.23mi | 2/2.0 (-1) | 1,360 (-6%) | 19mo | $268,240 | $197 | 58 |
Match score weights: distance 35% · size 25% · config 20% · recency 20%. Top-matched comps best support the ARV.
Projected returns pro-forma
-3.0% appreciation · 0.44% rent growth · sell at horizon
- IRR
- -20.0%
- Equity multiple
- 0.32×
- Total profit
- $-53,121
- Equity at exit
- $41,396
- IRR
- -19.4%
- Equity multiple
- 0.08×
- Total profit
- $-71,600
- Equity at exit
- $24,005
Cash invested: $77,737 (down + closing). Projections, not guarantees.
Landlord ↔ Tenant lean methodology
- Overall (STATE)
- 87 Strongly Landlord-Friendly
- State Texas
- 87 Strongly Landlord-Friendly · R+5
- County
- — inherits STATE
- City
- — inherits STATE
ZIP-level market 77583
- Rents YoY
- 0.4%
- Active inventory
- 1148
- Price-to-rent
- 10.2×
Monthly cashflow live
- Estimated rent
- $2,257 medium interval (Pro) →
- Mortgage (P&I)
- −$1,456
- Tax from tax record
- −$139 /mo · $1,664/yr
- Insurance
- −$116
- HOA
- −$111
- Vacancy / Maint / Mgmt
- −$474
- Net cashflow
- $-38
Break-even live
Sensitivity live
| Price | -10% $119 | -5% $40 | +0% $-38 | +5% $-117 | +10% $-195 |
|---|---|---|---|---|---|
| Rent | -10% $-217 | -5% $-127 | +0% $-38 | +5% $51 | +10% $140 |
| Rate | -1.0pp $102 | -0.5pp $32 | base $-38 | +0.5pp $-110 | +1.0pp $-183 |
UW: 25.0% down · 7.5% · 30yr · 1.5% tax · 5.0% vac · 8.0% maint · 8.0% mgmt
Financing live
Cash to close
- Down payment
- $69,408
- Closing costs
- $8,329
- Reserves months
- —
- Total cash needed
- —
Loan-product check · same deal, 3 products live
Conventional
25% down · 7.5% · 30yr
- Down + closing
- —
- Monthly P&I
- —
- Monthly cashflow
- —
- DSCR
- —
- Eligible?
- —
Personal DTI + credit; lowest rate.
DSCR
20% down · 8.5% · 30yr
- Down + closing
- —
- Monthly P&I
- —
- Monthly cashflow
- —
- DSCR
- —
- Eligible?
- —
No personal income docs; deal must DSCR.
Hard money
10% down · 12.0% · 12mo
- Down + closing
- —
- Monthly P&I
- —
- Monthly cashflow
- —
- DSCR
- —
- Eligible?
- —
Short-term bridge; refi at stabilization.
Rent comps 1 comps
| Address | Beds | Baths | Sqft | Rent | $/sqft | DOM | Units | Dist |
|---|---|---|---|---|---|---|---|---|
| 4143 Champlain Way Rosharon, TX | 3.0 | 3.0 | 1839 | $2,400 | $1.31 | 45d | 1 | 1.25mi |
HOA detail
- Monthly dues
- $111 · $1,332/yr
Listing history 10 events
-
2026-04-27status Pending
-
2026-03-22price $274,990
-
2026-02-18$279,990 Active
-
2026-02-17historical
-
2026-02-09price $279,990
-
2026-01-12price $298,665
-
2026-01-12price $298,415
-
2026-01-10price $298,665
-
2025-12-08price $303,665
-
2025-08-31$298,665 Active
ⓘ Source: listings_history table (triggers on properties + properties_extension) + one-shot
backfill from property_details.listing_events for pre-trigger history.
Tax reassessment forecast TX · Resets to sale price
- Current annual tax
- $1,664 · $139/mo
- Projected year-2 tax
- $5,032 · $419/mo
- Expected delta
- +$3,369/yr (+$281/mo · 202.5%)
ⓘ Screening estimate from a state-policy table — verify with the county assessor before closing.
Climate risk First Street
- Flood 5/10 Major FEMA zone X (unshaded) · 67% chance over 30 yrs
- Wildfire 7/10 Severe
- Heat 9/10 Extreme 7 d/yr ≥109°F today · 23 d/yr by 30 yrs out
- Wind 9/10 Extreme 99% chance of damaging wind over 30 yrs
- Air quality 3/10 Moderate 2 unhealthy d/yr today · 3 by 30 yrs out
Nearby sold comps map
Loading sold comps map…
Walkable amenities ~0.75 mi
Loading nearby amenities…
Taxation est. · year 1
- Rental income
- $27,083
- − Mortgage interest
- −$15,552
- − Property taxes
- −$1,664
- − Insurance
- −$1,388
- − Repairs & maintenance
- −$2,167
- − Management
- −$2,167
- − HOA
- −$1,332
- − Depreciation
- −$8,077
- Taxable loss
- −$5,262
- Est. tax savings @ 24.0%
- +$1,263
- After-tax cash flow
- $804/yr
For passive investors: Depreciation is non-cash, so a rental often shows a tax loss while cash-flowing — sheltering income. Rental losses are passive: they offset passive income freely, and up to $25,000/yr can offset ordinary (W-2) income if you actively participate and your MAGI is under $100k (phasing out to $0 by $150k); unused losses carry forward. On sale, claimed depreciation is recaptured at up to 25%, and gains may owe capital-gains tax (a 1031 exchange can defer both). Figures are a year-1 estimate at your 24.0% rate — not tax advice; consult a CPA.
Schools (NCES district)
- District
- Alvin ISD
- NCES district ID
- 4808090
- Math proficiency
- 39% ▼ -11.00%
- Reading proficiency
- 48% ▬ 0.00%
- Median HH income
- $66,740
- Composite
- 38.96/100
- National rank
- #4080
- State rank
- #255 of 826 in TX
Livability — Manvel
- Score
- 67/100
- State rank
- #544
- US rank
- #10576
Category grades
Schools grade is shown separately in the Schools card above.
Census & demographics
- Census place
- Manvel, TX
- County
- Brazoria County · 374,982 people
- City population
- 30,210
- Metro
- Houston-The Woodlands-Sugar Land, TX
- Population (ZIP)
- 52,747
- Household income
- $119,287
- Rent vs Own
- Severe rent burden
- 251.0
Population outlook (Brazoria County) Hauer SSP2
- Today (2025)
- 420,414 people
- By 2030
- 457,585 · +8.8%
- By 2040
- 532,232 · +26.6%
- By 2050
- 605,399 · +44.0%
- By 2075
- 779,358 · +85.4%
- By 2100
- 883,759 · +110.2%
Race, ethnicity, and origin ACS 2023
- Neighborhood character
- Highly diverse neighborhood (Simpson 0.70)
- Race & ethnicity
- Hispanic / Latino 38% Black 34% White 20% Two or more races 18% Asian 5%
- Hispanic origin (detail)
- Mexican 31% Puerto Rican 2%
- Common ancestry
- Lithuanian 1% Slovak 1% Romanian 1%
- Foreign-born
- 16% · Canada, Vietnam, China
- Languages at home
- 64% English-only · Spanish 28% Other Asian/Pacific 2% Vietnamese 1%
Political lean MEDSL · Brazoria
- 2024 margin
- R (+19.7) · D 39.5% · R 59.2% · Other 1.3%
- 2008→2024 swing
- +9.9pp toward D · 2008: -29.6pp · 2024: -19.7pp
- All cycles
- 2024: R+19.7 2020: R+18.2 2016: R+24.6 2012: R+34.2 2008: R+29.6
Not yet ingested
- Civics
- —
Market trends
- HPI YoY
- ▼ -120.19%
- Current HPI
- 198.6559
- Rent YoY
- ▲ 0.44%
- Metro
- Houston-The Woodlands-Sugar Land, TX
- State GDP YoY
- ▲ 3.95%
- F500 in state
- 110
Industry mix (Fortune 500 HQ in TX)
| Industry | F500 HQs | Revenue |
|---|---|---|
| Energy | 16 | $1,198B |
|
||
| Technology | 5 | $198B |
|
||
| Engineering / Construction | 4 | $72B |
|
||
| Energy Services | 3 | $60B |
|
||
| Utilities | 3 | $41B |
|
||
| Healthcare | 2 | $330B |
|
||
Price history
-7.9% since first listed10 events — show timeline
- 2026-04-27 Pending — HARMLS
- 2026-03-22 Price Changed $274,990 HARMLS
- 2026-02-18 Listed $279,990 HARMLS
- 2026-02-17 Listing Removed — HARMLS
- 2026-02-09 Price Changed $279,990 HARMLS
- 2026-01-12 Price Changed $298,665 HARMLS
- 2026-01-12 Price Changed $298,415 HARMLS
- 2026-01-10 Price Changed $298,665 HARMLS
- 2025-12-08 Price Changed $303,665 HARMLS
- 2025-08-31 Listed $298,665 HARMLS
Cash-flow waterfall
monthlySold comps — $/sqft
last 12 mo · ≤1 miLoading sold comps…