 Multi-family
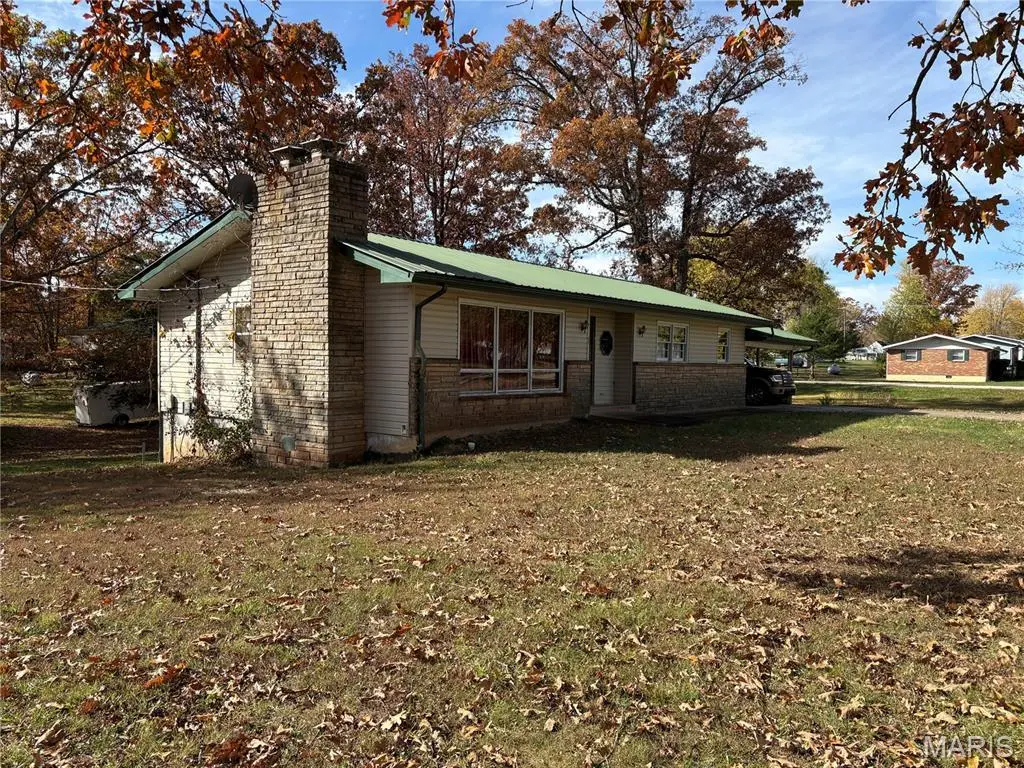
29 Spruce · Viburnum, MO
Flood risk 1/10 · Minimal
- FEMA flood zone
- X (unshaded)
- Chance of flooding over 30 yrs
- 0.0%
- Est. flood insurance / yr
- $473 – $860
Fire risk 5/10 · Moderate
- Est. fire insurance / yr
- $1,054 – $1,958
Heat risk 5/10 · Moderate
- Hot days now (above 105°F)
- 7 days/yr
- Hot days in 30 yrs
- 21 days/yr
Wind risk 2/10 · Minimal
- Chance of severe wind over 30 yrs
- 1.0%
Air-quality risk 2/10 · Minimal
- Unhealthy air days now
- 0 days/yr
- Unhealthy air days in 30 yrs
- 1 days/yr
Risk factors via First Street. Map © Google.
Why this score? — see what drove the D grade
The composite is a weighted blend of 9 inputs, each scored 0–100. Each bar is that input's sub-score; the figure is the points it added to the 100-point composite (weight × sub-score).
- Cash flow +11.6/30.0
- Appreciation +7.2/10.0
- ARV discount +4.7/15.0
- Schools +3.7/10.0
- DSCR +3.4/10.0
- Livability +2.8/5.0
- Rent growth +2.5/5.0
- Condition / age +2.5/5.0
- 1% rule +2.4/10.0
$139,995
🖨 Deal sheet 📄 Offer letter ✓ Due diligence
Multi-family units
County records classify this as Multi-Family (2-4 Unit). Listing-text estimate: 1 unit. estimate disagrees with records
Listing remarks MLS
List at $139,995 - What a nice corner lot in the city of Viburnum. More to come on this property with details and interior photos. Viburnum is a community sitting in the middle of the Mark Twain National Forest with Dillard Mill State Park just 5 miles away. Council Bluff Lake with about 500 acres of great Pristine Ozark waters with great camping, manmade beach and great fishing. Less than an hour to Elephant Rocks and Johnson Shut Ins State Parks. Missouri is known for its great whitetail deer population, Wild Turkeys, even Elk about an hour south and Eagles have become common place in the Ozark Foothills.
Key facts
- Great fishing
- Manmade beach
- Corner lot
Tags
Neighborhood map
What this means for you Summary
Snapshot
- This is a 3-bed/2.0-bath multifamily listed at $140k.
Deal economics
- At list price, monthly cash flow is $-44 ($-526/yr) — negative.
- To cash-flow at today's rent, offer at most $132k (5.5% below list).
- To meet the 1% rule (rent ≥ 1% of price), the offer needs to be $104k (25.6% below list).
- Recommended offer: $104k (25.6% below list) — sets the bar for 1% rule.
Location & tenants
- Location reads 55/100 on livability (#752 in MO) — a working-class tenant base; expect higher turnover. Strengths: cost of living A+, housing A+; Watch: schools D, employment D, crime F.
- Iron County C-4 (rural): math 36% / reading 46% proficiency, ranked #299 of 535 in MO (top 56%) — families likely to look elsewhere, expect single-tenant / working-renter base with shorter leases.
- Market conditions: 8 active listings in the ZIP; 6 units permitted in Iron County in 2024 (0 in 5+ unit buildings).
Forward outlook
- In year one you build about $7k of equity ($968 loan paydown + $6k appreciation (4.5% local appreciation)).
- Iron County population projected at -25% by 2050 — secular population decline; favor cash flow + early exit over multi-decade hold.
- At projected returns (4.5% appreciation + 3.0% rent growth), your $39k cash investment doubles in ~5 years — after that, you're playing with house money.
- By year 5, paydown + projected appreciation supports a ~$31k cash-out refi (75% LTV) — recoverable capital for the next deal without selling this one.
Negotiation context
- It's been on market 182 days — a 12% lower offer ($123k) is reasonable based on typical stale-listing flexibility.
Risks & watch-outs
- Climate carrying-cost: moderate wildfire risk; extreme-heat days projected 7→21/yr by 2055 (HVAC capex compounding) — expect insurance premiums to compound above CPI over the hold.
Questions for the listing agent
- What do current leases actually rent for vs. the listed asking? Can we see a recent rent roll and the last 12 months of T-12 income?
- It's been on market 182 days. Have you received any prior offers? Is the seller open to a 26% concession, seller financing, or rate buy-down credit?
- Built in 1970 — when were the roof, HVAC, electrical panel, plumbing, and water heater last replaced?
- Why hasn't it sold? Are there any deal-killer items the seller is aware of (foundation, flood, title, zoning, code violations)?
- Is there a deadline driving the sale (1031 exchange, divorce, estate, relocation)? That informs how much negotiation room exists.
- Schools are D-rated, which usually means shorter tenancies and higher turnover. Who's the typical renter profile here, and what's been the actual vacancy rate?
- Crime grade is F in this area — have there been break-ins, vandalism, or insurance claims at this property in the last 3 years? What carrier currently insures it and at what premium?
- The area grade is low — what's the realistic commute time and amenity access for the typical tenant pool here? Any planned neighborhood developments (good or bad) we should know about?
- What's the average days-on-market for RENTAL listings here right now (not sales)? A rising rental-DOM trend means longer vacancies and softer asking-rent achievability than the comps imply.
- What's the recent tenant-quality profile in this submarket — average credit score on applications, eviction rate, late-payment / NSF rate, and stable-employment percentage? A property-management company in the area should have these aggregated.
- How much new apartment / multifamily construction is in the pipeline within 1–3 miles? Heavy new supply (>2% of stock underway) typically softens rents 12–24 months out; light construction supports rent growth.
Investment metrics
- 1% rule
- 0.74% ✗
- Cap rate
- 5.92%
- Cash-on-cash
- -1.34%
- DSCR
- 0.94
- GRM
- 11.2
CMA / ARV
- ARV (median comp)
- $131,718
- List price
- $139,995
- Delta
- 6.28%
- Verdict
- FAIR
- Comps
- 20 within 1.0 mi
Projected returns pro-forma
4.47% appreciation · 3.0% rent growth · sell at horizon
- IRR
- 10.3%
- Equity multiple
- 1.64×
- Total profit
- $25,187
- Equity at exit
- $74,823
- IRR
- 11.9%
- Equity multiple
- 3.06×
- Total profit
- $80,628
- Equity at exit
- $125,551
Cash invested: $39,199 (down + closing). Projections, not guarantees.
Landlord ↔ Tenant lean methodology
- Overall (STATE)
- 81 Strongly Landlord-Friendly
- State Missouri
- 81 Strongly Landlord-Friendly · R+10
- County
- — inherits STATE
- City
- — inherits STATE
ZIP-level market 65566
- Home prices YoY
- 2.7%
- Active inventory
- 8
- Price-to-rent
- 11.2×
Monthly cashflow live
- Estimated rent
- $1,042 medium interval (Pro) →
- Mortgage (P&I)
- −$734
- Tax from tax record
- −$74 /mo · $892/yr
- Insurance
- −$58
- HOA
- −$0
- Vacancy / Maint / Mgmt
- −$219
- Net cashflow
- $-44
Break-even live
UW: 25.0% down · 7.5% · 30yr · 1.5% tax · 5.0% vac · 8.0% maint · 8.0% mgmt
Financing live
Cash to close
- Down payment
- $34,999
- Closing costs
- $4,200
- Reserves months
- —
- Total cash needed
- —
Loan-product check · same deal, 3 products live
Conventional
25% down · 7.5% · 30yr
- Down + closing
- —
- Monthly P&I
- —
- Monthly cashflow
- —
- DSCR
- —
- Eligible?
- —
Personal DTI + credit; lowest rate.
DSCR
20% down · 8.5% · 30yr
- Down + closing
- —
- Monthly P&I
- —
- Monthly cashflow
- —
- DSCR
- —
- Eligible?
- —
No personal income docs; deal must DSCR.
Hard money
10% down · 12.0% · 12mo
- Down + closing
- —
- Monthly P&I
- —
- Monthly cashflow
- —
- DSCR
- —
- Eligible?
- —
Short-term bridge; refi at stabilization.
Listing history 11 events
-
2026-06-13days on market $139,995 Active 182 DOM
-
2026-06-12days on market $139,995 Active 181 DOM
-
2026-06-09days on market $139,995 Active 178 DOM
-
2026-06-08days on market $139,995 Active 177 DOM
-
2026-06-07days on market $139,995 Active 176 DOM
-
2026-06-07days on market $139,995 Active 175 DOM
-
2026-06-04days on market $139,995 Active 172 DOM
-
2026-06-02days on market $139,995 Active 171 DOM
-
2026-06-01days on market $139,995 Active 170 DOM
-
2026-05-31days on market $139,995 Active 169 DOM
-
2025-12-13$139,995 Active 614-char remark
Show marketing remark (614 chars)
List at $139,995 - What a nice corner lot in the city of Viburnum. More to come on this property with details and interior photos. Viburnum is a community sitting in the middle of the Mark Twain National Forest with Dillard Mill State Park just 5 miles away. Council Bluff Lake with about 500 acres of great Pristine Ozark waters with great camping, manmade beach and great fishing. Less than an hour to Elephant Rocks and Johnson Shut Ins State Parks. Missouri is known for its great whitetail deer population, Wild Turkeys, even Elk about an hour south and Eagles have become common place in the Ozark Foothills.
ⓘ Source: listings_history table (triggers on properties + properties_extension) + one-shot
backfill from property_details.listing_events for pre-trigger history.
Tax reassessment forecast MO · Resets to sale price
- Current annual tax
- $892 · $74/mo
- Projected year-2 tax
- $1,358 · $113/mo
- Expected delta
- +$466/yr (+$39/mo · 52.2%)
ⓘ Screening estimate from a state-policy table — verify with the county assessor before closing.
Climate risk First Street
- Flood 1/10 Low FEMA zone X (unshaded) · 0% chance over 30 yrs
- Wildfire 5/10 Major
- Heat 5/10 Major 7 d/yr ≥105°F today · 21 d/yr by 30 yrs out
- Wind 2/10 Low 100% chance of damaging wind over 30 yrs
- Air quality 2/10 Low 0 unhealthy d/yr today · 1 by 30 yrs out
Nearby sold comps map
Loading sold comps map…
Walkable amenities ~0.75 mi
Loading nearby amenities…
Taxation est. · year 1
- Rental income
- $12,501
- − Mortgage interest
- −$7,842
- − Property taxes
- −$892
- − Insurance
- −$700
- − Repairs & maintenance
- −$1,000
- − Management
- −$1,000
- − Depreciation
- −$4,073
- Taxable loss
- −$3,006
- Est. tax savings @ 24.0%
- +$721
- After-tax cash flow
- $195/yr
For passive investors: Depreciation is non-cash, so a rental often shows a tax loss while cash-flowing — sheltering income. Rental losses are passive: they offset passive income freely, and up to $25,000/yr can offset ordinary (W-2) income if you actively participate and your MAGI is under $100k (phasing out to $0 by $150k); unused losses carry forward. On sale, claimed depreciation is recaptured at up to 25%, and gains may owe capital-gains tax (a 1031 exchange can defer both). Figures are a year-1 estimate at your 24.0% rate — not tax advice; consult a CPA.
Schools (NCES district)
- District
- Iron County C-4
- NCES district ID
- 2915510
- Math proficiency
- 36% ▼ -4.00%
- Reading proficiency
- 46% ▲ 1.00%
- Median HH income
- $39,736
- Composite
- 36.71/100
- National rank
- #9210
- State rank
- #299 of 535 in MO
Livability — Viburnum
- Score
- 55/100
- State rank
- #752
- US rank
- #23441
Category grades
Schools grade is shown separately in the Schools card above.
Census & demographics
- Census place
- Viburnum, MO
- Population (ZIP)
- 888
Population outlook (Iron County) Hauer SSP2
- Today (2025)
- 9,245 people
- By 2030
- 8,745 · -5.4%
- By 2040
- 7,808 · -15.5%
- By 2050
- 6,944 · -24.9%
- By 2075
- 5,320 · -42.5%
- By 2100
- 4,245 · -54.1%
Race, ethnicity, and origin ACS 2023
- Neighborhood character
- Predominantly White (88%)
- Race & ethnicity
- White 88% Hispanic / Latino 7% Two or more races 6%
- Hispanic origin (detail)
- Mexican 7%
- Common ancestry
- Lithuanian 5% Slovak 3% Italian 1%
- Foreign-born
- 2%
- Languages at home
- 93% English-only · German/W. Germanic 4% Spanish 2%
Political lean MEDSL · Iron
- 2024 margin
- Solid R (+62.4) · D 18.2% · R 80.7% · Other 1.1%
- 2008→2024 swing
- -65.2pp toward R · 2008: 2.8pp · 2024: -62.4pp
- All cycles
- 2024: R+62.4 2020: R+57.7 2016: R+52.6 2012: R+14.5 2008: D+2.8
Not yet ingested
- Civics
- —
Market trends
- HPI YoY
- ▲ 4.47%
- Current HPI
- 169.4431
- Rent YoY
- —
- Metro
- —
- State GDP YoY
- ▲ 1.84%
- F500 in state
- 20
Industry mix (Fortune 500 HQ in MO)
| Industry | F500 HQs | Revenue |
|---|---|---|
| Healthcare | 1 | $163B |
|
||
| Insurance | 1 | $21B |
|
||
| Industrial Technology | 1 | $17B |
|
||
| Retail | 1 | $16B |
|
||
| Industrial Distribution | 1 | $10B |
|
||
| Utilities | 1 | $9B |
|
||
Price history
1 event — show timeline
- 2025-12-13 Listed $139,995 MARIS as Distributed by MLS Grid
Property tax history
+6.1%/yrLatest (2025): $892 · +14.9% YoY. Source: county tax records.
Cash-flow waterfall
monthlySold comps — $/sqft
last 12 mo · ≤1 miLoading sold comps…