18411 Copperhead Ct N #317 · Lehigh Acres, FL
Flood risk No data
- FEMA flood zone
- —
- Chance of flooding over 30 yrs
- —
- Est. flood insurance / yr
- —
Fire risk No data
- Est. fire insurance / yr
- —
Heat risk No data
- Hot days now (above threshold)
- —
- Hot days in 30 yrs
- —
Wind risk No data
- Chance of severe wind over 30 yrs
- —
Air-quality risk No data
- Unhealthy air days now
- —
- Unhealthy air days in 30 yrs
- —
Risk factors via First Street. Map © Google.
Why this score? — see what drove the D+ grade
The composite is a weighted blend of 9 inputs, each scored 0–100. Each bar is that input's sub-score; the figure is the points it added to the 100-point composite (weight × sub-score).
- Cash flow +18.7/30.0
- DSCR +5.9/10.0
- 1% rule +5.0/10.0
- Schools +4.1/10.0
- Condition / age +4.0/5.0
- ARV discount +3.2/15.0
- Livability +3.0/5.0
- Rent growth +2.3/5.0
- Appreciation +0.0/10.0
$166,999
🖨 Deal sheet 📄 Offer letter ✓ Due diligence
Listing remarks
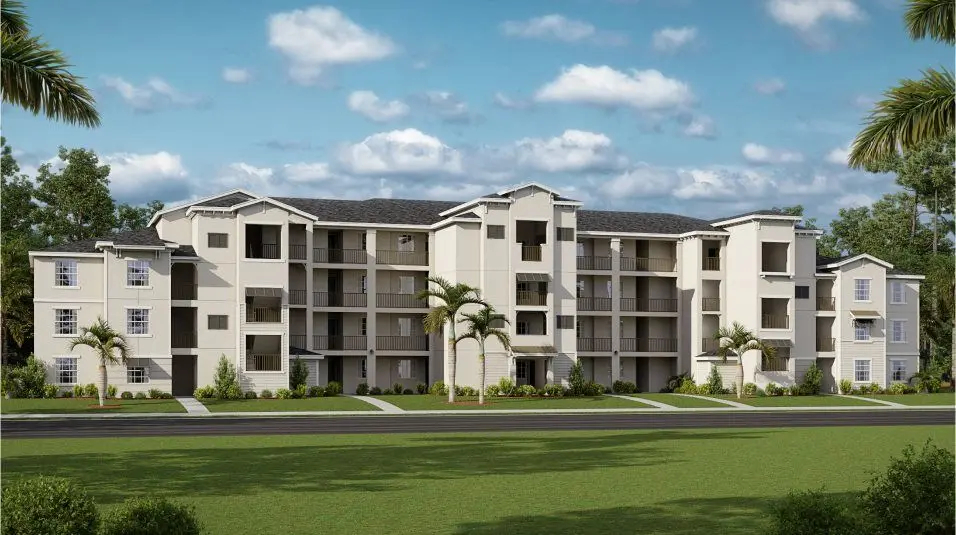
Welcome to Ibis Landing-a true golfer's paradise in Lehigh Acres, FL. This single-level condominium features an open kitchen, dining room and living room, with lanai access for outdoor living. Near the foyer is the luxe owner's suite and a comfortable spare bedroom perfect for younger residents or guests. Centered around a Gordon Lewis III-designed course, this scenic community features the highest elevated green in Fort Myers and sweeping panoramic views. With year-round sunshine, enjoy an effortless country club lifestyle in a natural oasis designed for your next chapter. The resort-style amenities include a sprawling pool, fully equipped fitness center, and well-maintained tennis and pic
Key facts
- Luxe owner's suite
- Open kitchen
- Lanai access
Tags
Property features AI
Finance
- Financial info: List price $173,999
Exterior
- Home design: Spec inventory, Plan name: Birkdale; Condominium at 18411 Copperhead Ct N #317, Lehigh Acres, FL 33936
Interior
- Bedrooms: 2 bedrooms
- Bathrooms: 2 full bathrooms
- Interior features: Living area of 1154 (listed under property information)
Neighborhood map
What this means for you Summary
Snapshot
- This is a 2-bed/2.0-bath townhouse listed at $167k. Condition is rated good.
Deal economics
- At list price, monthly cash flow is $165 ($2k/yr) — positive.
- The deal already cash-flows at list — no discount required.
- To meet the 1% rule (rent ≥ 1% of price), the offer needs to be $167k (0.0% below list).
- Recommended offer: $162k (3.0% below list) — sets the bar for market timing.
- Cap rate 7.5% vs local median 4.7% in Lehigh Acres — top-decile yield for the area; either an underpriced asset or a hidden risk that comps aren't pricing in. Stress-test before assuming the spread holds.
Location & tenants
- Location reads 59/100 on livability (#826 in FL) — a working-class tenant base; expect higher turnover. Strengths: cost of living A+, housing A+; Watch: crime C-, employment D+, schools D-.
- Lee (suburban): math 47% / reading 50% proficiency, ranked #42 of 73 in FL (top 58%) — families likely to look elsewhere, expect single-tenant / working-renter base with shorter leases.
- Market conditions: Rents soft (-0.8%/yr); 641 active listings in the ZIP; 40 comparable units currently listed for rent nearby; rentals at typical pace (median 24d on market — plan ~3-4 weeks tenant-placement turnaround); 15,411 units permitted in Lee County in 2024 (4,686 in 5+ unit buildings).
- This rent runs 39% of the median local income ($51k/yr) — at the standard rent-burdened threshold; future hikes will face affordability resistance.
Forward outlook
- Local home prices are declining (-3.0%/yr); year-one equity from $1k of loan paydown is wiped out by about $5k of value loss. Plan a longer hold.
- Lee County population projected at +44% by 2050 — long-run rental-demand tailwind backs the buy-and-hold thesis.
Negotiation context
- It's been on market 54 days — a 3% lower offer ($162k) is reasonable based on typical stale-listing flexibility.
Questions for the listing agent
- It's been on market 54 days. Have you received any prior offers? Is the seller open to a 3% concession, seller financing, or rate buy-down credit?
- Is there a deadline driving the sale (1031 exchange, divorce, estate, relocation)? That informs how much negotiation room exists.
- Schools are D-rated, which usually means shorter tenancies and higher turnover. Who's the typical renter profile here, and what's been the actual vacancy rate?
- The area grade is low — what's the realistic commute time and amenity access for the typical tenant pool here? Any planned neighborhood developments (good or bad) we should know about?
- What's the average days-on-market for RENTAL listings here right now (not sales)? A rising rental-DOM trend means longer vacancies and softer asking-rent achievability than the comps imply.
- What's the recent tenant-quality profile in this submarket — average credit score on applications, eviction rate, late-payment / NSF rate, and stable-employment percentage? A property-management company in the area should have these aggregated.
- How much new for-sale + rental construction is in the pipeline within 1–3 miles? Heavy new supply typically softens prices + rents 12–24 months out; constrained supply supports both.
Investment metrics
- 1% rule
- 1.00% ✗
- Cap rate
- 7.48%
- Cash-on-cash
- 4.23%
- DSCR
- 1.19
- GRM
- 8.3
CMA / ARV
- ARV (on-the-fly)
- $152,328
- Comps found
- 1
Show comp detail 1 sale within ~0.75 mi
| Address | Dist | Beds/Ba | Sqft | Sold | Price | $/sf | Match |
|---|---|---|---|---|---|---|---|
| 10615 Roxbury Ct | 0.74mi | 2/2.0 | 1,004 (-13%) | 2mo | $132,500 | $132 | 42 |
Match score weights: distance 35% · size 25% · config 20% · recency 20%. Top-matched comps best support the ARV.
Projected returns pro-forma
-3.0% appreciation · 0.0% rent growth · sell at horizon
- IRR
- -13.1%
- Equity multiple
- 0.54×
- Total profit
- $-21,440
- Equity at exit
- $24,900
- IRR
- -9.7%
- Equity multiple
- 0.49×
- Total profit
- $-23,968
- Equity at exit
- $14,439
Cash invested: $46,760 (down + closing). Projections, not guarantees.
Landlord ↔ Tenant lean methodology
- Overall (STATE)
- 87 Strongly Landlord-Friendly
- State Florida
- 87 Strongly Landlord-Friendly · R+3
- County
- — inherits STATE
- City
- — inherits STATE
ZIP-level market 33936
- Home prices YoY
- -19.9%
- Rents YoY
- -0.8%
- Active inventory
- 641
- Price-to-rent
- 8.3×
Monthly cashflow live
- Estimated rent
- $1,669 high interval (Pro) →
- Mortgage (P&I)
- −$876
- Tax est. 1.5%
- −$209 /mo · $2,505/yr
- Insurance
- −$70
- HOA
- −$0
- Vacancy / Maint / Mgmt
- −$351
- Net cashflow
- $165
Break-even live
UW: 25.0% down · 7.5% · 30yr · 1.5% tax · 5.0% vac · 8.0% maint · 8.0% mgmt
Financing live
Cash to close
- Down payment
- $41,750
- Closing costs
- $5,010
- Reserves months
- —
- Total cash needed
- —
Loan-product check · same deal, 3 products live
Conventional
25% down · 7.5% · 30yr
- Down + closing
- —
- Monthly P&I
- —
- Monthly cashflow
- —
- DSCR
- —
- Eligible?
- —
Personal DTI + credit; lowest rate.
DSCR
20% down · 8.5% · 30yr
- Down + closing
- —
- Monthly P&I
- —
- Monthly cashflow
- —
- DSCR
- —
- Eligible?
- —
No personal income docs; deal must DSCR.
Hard money
10% down · 12.0% · 12mo
- Down + closing
- —
- Monthly P&I
- —
- Monthly cashflow
- —
- DSCR
- —
- Eligible?
- —
Short-term bridge; refi at stabilization.
Rent comps 40 comps
| Address | Beds | Baths | Sqft | Rent | $/sqft | DOM | Units | Dist |
|---|---|---|---|---|---|---|---|---|
| 18421 Copperhead Dr #222 Lehigh Acres, FL | 2.0 | 2.0 | 1154 | $1,700 | $1.47 | 23d | 1 | 0.02mi |
| 18411 Copperhead Dr #346 Lehigh Acres, FL | 2.0 | 2.0 | 1061 | $1,695 | $1.60 | 21d | 1 | 0.03mi |
| 18461 Copperhead Dr Unit 1546499P Lehigh Acres, FL | 2.0 | 2.0 | 1194 | $1,941 | $1.63 | 14d | 1 | 0.07mi |
| 18461 Copperhead Ct N #444 Lehigh Acres, FL | 2.0 | 2.0 | 1120 | $2,300 | $2.05 | 23d | 1 | 0.07mi |
| 18451 Copperhead Ct N #535 Lehigh Acres, FL | 2.0 | 2.0 | 1130 | $4,950 | $4.38 | 23d | 1 | 0.09mi |
| 18261 Minorea Ln Lehigh Acres, FL | 2.0 | 2.0 | 1402 | $1,595 | $1.14 | 3d | 1 | 0.15mi |
| 18261 Minorea Ln Lehigh Acres, FL | 2.0 | 2.0 | 1402 | $1,800 | $1.28 | 23d | 1 | 0.15mi |
| 18266 Minorea Ln Lehigh Acres, FL | 3.0 | 2.0 | 1408 | $1,650 | $1.17 | 23d | 1 | 0.18mi |
| 9249 Aegean Cir Lehigh Acres, FL | 2.0 | 2.0 | 1320 | $1,800 | $1.36 | 23d | 1 | 0.22mi |
| 18461 Copperhead Dr #421 Lehigh Acres, FL | 3.0 | 2.0 | 1301 | $1,895 | $1.46 | 23d | 1 | 0.25mi |
| 18461 Copperhead Dr #436 Lehigh Acres, FL | 2.0 | 2.0 | 1154 | $3,495 | $3.03 | 23d | 1 | 0.25mi |
| 18461 Copperhead Dr #431 Lehigh Acres, FL | 3.0 | 2.0 | 1301 | $3,995 | $3.07 | 23d | 1 | 0.25mi |
| 9112 Aegean Cir Lehigh Acres, FL | 3.0 | 2.0 | 1409 | $1,600 | $1.14 | 3d | 1 | 0.33mi |
| 59 Camelot Gardens Blvd #110 Lehigh Acres, FL | 2.0 | 2.0 | 1166 | $1,800 | $1.54 | 23d | 1 | 0.35mi |
| 9099 Aegean Cir Lehigh Acres, FL | 2.0 | 2.0 | 1120 | $1,499 | $1.34 | 23d | 1 | 0.35mi |
| 9161 Aegean Cir Lehigh Acres, FL | 2.0 | 2.0 | 1120 | $1,650 | $1.47 | 14d | 1 | 0.35mi |
| 9123 Aegean Cir Lehigh Acres, FL | 2.0 | 2.0 | 1120 | $1,474 | $1.32 | 3d | 1 | 0.36mi |
| 9131 Aegean Cir Lehigh Acres, FL | 3.0 | 2.0 | 1400 | $1,574 | $1.12 | 23d | 1 | 0.37mi |
| 9131 Aegean Cir Lehigh Acres, FL | 3.0 | 2.0 | 1400 | $1,574 | $1.12 | 21d | 1 | 0.37mi |
| 9137 Aegean Cir Lehigh Acres, FL | 2.0 | 2.0 | 1120 | $1,474 | $1.32 | 3d | 1 | 0.38mi |
| 9137 Aegean Cir Lehigh Acres, FL | 2.0 | 2.0 | 1120 | $1,474 | $1.32 | 23d | 1 | 0.38mi |
| 10 Beth Stacey Blvd #206 Lehigh Acres, FL | 2.0 | 2.0 | 1012 | $1,100 | $1.09 | 3d | 1 | 0.40mi |
| 18451 Copperhead Dr #522 Lehigh Acres, FL | 2.0 | 2.0 | 1120 | $1,895 | $1.69 | 23d | 1 | 0.41mi |
| 201 Alabama Rd S Lehigh Acres, FL | 3.0 | 1.0 | 920 | $1,275 | $1.39 | 3d | 1 | 0.48mi |
| 28 Cosmopolitan Dr #13 Lehigh Acres, FL | 2.0 | 2.0 | 973 | $1,375 | $1.41 | 14d | 1 | 0.52mi |
| 9 Hamlin Ct Lehigh Acres, FL | 1.0 | 1.5 | 807 | $950 | $1.18 | 3d | 1 | 0.57mi |
| 26 Alabama Rd S Lehigh Acres, FL | 2.0 | 1.0 | 920 | $1,650 | $1.79 | 21d | 1 | 0.57mi |
| 1423 Caywood Cir S Lehigh Acres, FL | 2.0 | 2.0 | 960 | $1,376 | $1.43 | 3d | 1 | 0.59mi |
| 47 Tangelo Ct Lehigh Acres, FL | 2.0 | 2.0 | 812 | $1,150 | $1.42 | 23d | 1 | 0.59mi |
| 44 Tangelo Ct Lehigh Acres, FL | 2.0 | 2.0 | 812 | $1,150 | $1.42 | 3d | 1 | 0.60mi |
| 46 Hamlin Ct Lehigh Acres, FL | 2.0 | 2.0 | 812 | $1,050 | $1.29 | 23d | 1 | 0.60mi |
| 10 Tangerine Ct Lehigh Acres, FL | 2.0 | 2.0 | 812 | $1,200 | $1.48 | 19d | 1 | 0.61mi |
| 423 Morgan Cir S Lehigh Acres, FL | 3.0 | 1.0 | 920 | $1,450 | $1.58 | 23d | 1 | 0.64mi |
| 10554 Quincy Ct Lehigh Acres, FL | 2.0 | 2.0 | 1004 | $1,300 | $1.29 | 19d | 1 | 0.66mi |
| 1112 Gifford Ave S Lehigh Acres, FL | 2.0 | 2.0 | 880 | $1,350 | $1.53 | 3d | 1 | 0.66mi |
| 1112 Gifford Ave S Lehigh Acres, FL | 2.0 | 2.0 | 880 | $1,350 | $1.53 | 23d | 1 | 0.66mi |
| 1120 Vineyard St Lehigh Acres, FL | 2.0 | 1.0 | 1028 | $1,300 | $1.26 | 23d | 1 | 0.68mi |
| 10578 Quincy Ct Unit 1 Lehigh Acres, FL | 2.0 | 2.0 | 899 | $1,275 | $1.42 | 23d | 1 | 0.68mi |
| 10525 Putnam Ct Lehigh Acres, FL | 2.0 | 2.0 | 1014 | $1,250 | $1.23 | 19d | 1 | 0.71mi |
| 2602 24th St SW Lehigh Acres, FL | 3.0 | 2.0 | 1358 | $1,800 | $1.33 | 3d | 1 | 0.72mi |
Listing history 2 events
-
2026-06-01days on market $166,999 Active 54 DOM
-
2026-06-01days on market $166,999 Active 53 DOM
ⓘ Source: listings_history table (triggers on properties + properties_extension) + one-shot
backfill from property_details.listing_events for pre-trigger history.
Nearby sold comps map
Loading sold comps map…
Walkable amenities ~0.75 mi
Loading nearby amenities…
Taxation est. · year 1
- Rental income
- $20,032
- − Mortgage interest
- −$9,355
- − Property taxes
- −$2,505
- − Insurance
- −$835
- − Repairs & maintenance
- −$1,603
- − Management
- −$1,603
- − Depreciation
- −$4,858
- Taxable loss
- −$726
- Est. tax savings @ 24.0%
- +$174
- After-tax cash flow
- $2,150/yr
For passive investors: Depreciation is non-cash, so a rental often shows a tax loss while cash-flowing — sheltering income. Rental losses are passive: they offset passive income freely, and up to $25,000/yr can offset ordinary (W-2) income if you actively participate and your MAGI is under $100k (phasing out to $0 by $150k); unused losses carry forward. On sale, claimed depreciation is recaptured at up to 25%, and gains may owe capital-gains tax (a 1031 exchange can defer both). Figures are a year-1 estimate at your 24.0% rate — not tax advice; consult a CPA.
Condition & rehab AI · 12 photos
This well-maintained townhouse in a golf course community offers a good condition with minimal repairs needed. Upgrades to landscaping and exterior paint can significantly increase its value.
Value-add opportunities
- Both Landscaping improvements — Enhance curb appeal and attract more buyers
- Both Painting exterior walls — Fresh paint can make the home look more appealing
- Both Upgrade window treatments — Modern window treatments can improve the home's curb appeal and energy efficiency
Renovation cost estimate screening
Value-add ROI direction
- Both Landscaping improvements — Enhance curb appeal and attract more buyers ↑
- Both Painting exterior walls — Fresh paint can make the home look more appealing ↑
- Both Upgrade window treatments — Modern window treatments can improve the home's curb appeal and energy efficiency ↑
ⓘ Cost ranges are severity-bucket heuristics (US national rule-of-thumb). Get contractor quotes + a written scope before underwriting a rehab budget.
Schools (NCES district)
- District
- Lee
- NCES district ID
- 1201080
- Math proficiency
- 47% ▼ -11.00%
- Reading proficiency
- 50% ▼ -4.00%
- Median HH income
- $49,518
- Composite
- 41.49/100
- National rank
- #3458
- State rank
- #42 of 73 in FL
Livability — Lehigh Acres
- Score
- 59/100
- State rank
- #826
- US rank
- #20055
Category grades
Schools grade is shown separately in the Schools card above.
Census & demographics
- Census place
- Lehigh Acres, FL
- County
- Lee County · 788,662 people
- City population
- 130,638
- Metro
- Cape Coral-Fort Myers, FL
- Population (ZIP)
- 27,967
- Household income
- $51,417
- Rent vs Own
- Severe rent burden
- 1027.0
Population outlook (Lee County) Hauer SSP2
- Today (2025)
- 871,946 people
- By 2030
- 955,468 · +9.6%
- By 2040
- 1,113,587 · +27.7%
- By 2050
- 1,256,891 · +44.1%
- By 2075
- 1,560,270 · +78.9%
- By 2100
- 1,726,848 · +98.0%
Race, ethnicity, and origin ACS 2023
- Neighborhood character
- Diverse neighborhood (Simpson 0.63)
- Race & ethnicity
- Hispanic / Latino 44% White 41% Two or more races 21% Black 9% Asian 1%
- Hispanic origin (detail)
- Mexican 7% Puerto Rican 9% Cuban 18% Dominican 2%
- Common ancestry
- Hispanic 3% Romanian 2% Lithuanian 1%
- Foreign-born
- 28% · Canada, Jamaica
- Languages at home
- 59% English-only · Spanish 36% French/Haitian/Cajun 3% Tagalog/Filipino 1%
Political lean MEDSL · Lee
- 2024 margin
- Strong R (+28.4) · D 35.5% · R 63.9%
- 2008→2024 swing
- -18.0pp toward R · 2008: -10.4pp · 2024: -28.4pp
- All cycles
- 2024: R+28.4 2020: R+19.2 2016: R+20.4 2012: R+16.6 2008: R+10.4
Not yet ingested
- Civics
- —
Market trends
- HPI YoY
- ▼ -86.78%
- Current HPI
- 348.8631
- Rent YoY
- ▼ -0.77%
- Metro
- Cape Coral-Fort Myers, FL
- State GDP YoY
- ▲ 3.28%
- F500 in state
- 36
Industry mix (Fortune 500 HQ in FL)
| Industry | F500 HQs | Revenue |
|---|---|---|
| Industrial Technology | 2 | $29B |
|
||
| Insurance | 2 | $17B |
|
||
| Retail | 1 | $60B |
|
||
| Technology Distribution | 1 | $58B |
|
||
| Homebuilding | 1 | $35B |
|
||
| Technology Manufacturing | 1 | $35B |
|
||
Cash-flow waterfall
monthlySold comps — $/sqft
last 12 mo · ≤1 miLoading sold comps…