153 Ranch Rd · East Palatka, FL
Flood risk 1/10 · Minimal
- FEMA flood zone
- X (unshaded)
- Chance of flooding over 30 yrs
- 0.0%
- Est. flood insurance / yr
- $507 – $1,088
Fire risk 6/10 · Moderate
- Est. fire insurance / yr
- $947 – $1,759
Heat risk 9/10 · Severe
- Hot days now (above 108°F)
- 7 days/yr
- Hot days in 30 yrs
- 20 days/yr
Wind risk 9/10 · Severe
- Chance of severe wind over 30 yrs
- 99.0%
Air-quality risk 2/10 · Minimal
- Unhealthy air days now
- 2 days/yr
- Unhealthy air days in 30 yrs
- 2 days/yr
Risk factors via First Street. Map © Google.
Why this score? — see what drove the D grade
The composite is a weighted blend of 9 inputs, each scored 0–100. Each bar is that input's sub-score; the figure is the points it added to the 100-point composite (weight × sub-score).
- Cash flow +11.5/30.0
- ARV discount +7.5/15.0
- Appreciation +4.3/10.0
- DSCR +3.4/10.0
- 1% rule +3.3/10.0
- Livability +3.1/5.0
- Schools +3.0/10.0
- Rent growth +2.5/5.0
- Condition / age +2.2/5.0
$240,000
🖨 Deal sheet 📄 Offer letter ✓ Due diligence
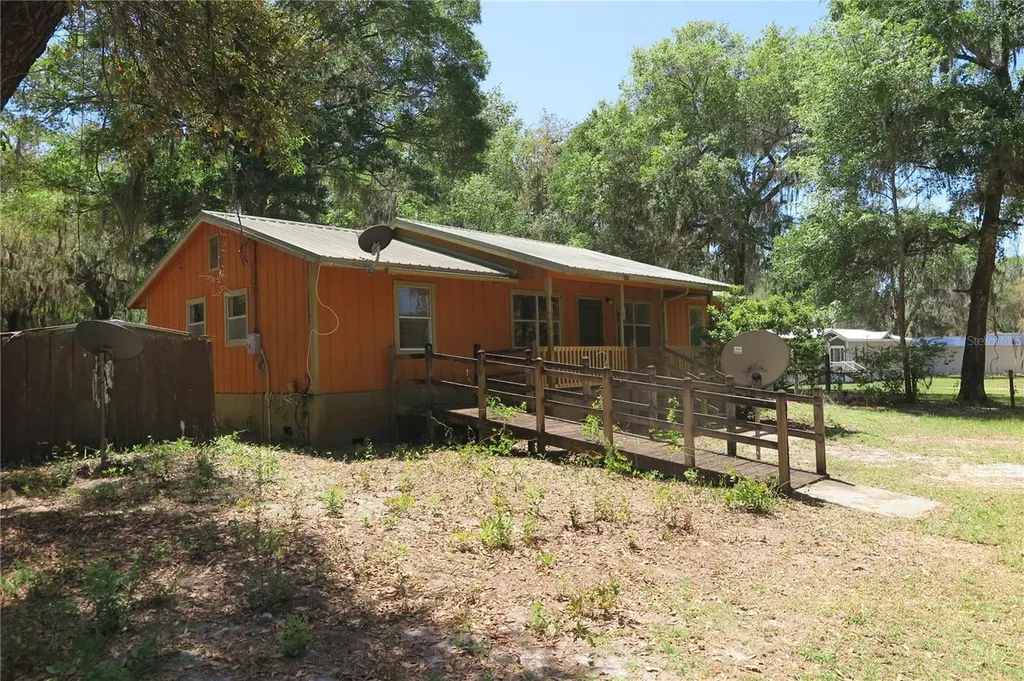
Listing remarks
This ranch-style home in East Palatka offers solid bones and genuine potential for buyers ready to make it their own. With three bedrooms and two bathrooms, the layout provides functional living space for a range of needs. The property presents an opportunity to customize and improve at your own pace. The home's straightforward design and established lot give you a foundation to build upon. Whether you're an investor seeking a project, an owner-occupant with vision, or someone looking for value in the market, this property delivers opportunity without premium pricing. The location provides convenient access to the area while keeping costs manageable. Schedule a showing today and explore wha
Key facts
- 1.84 acre lot
- Built 1976
- Listed 28 days
Property features AI
Finance
- Other: Property type: Residential (Single Family Residence); Zoning: SFR; Property ID available
- Financial info: No additional financial details provided
- HOA & community: No HOA
Exterior
- Parking: No parking details listed
- Security: No security features listed
- Utilities: Well water; Septic tank; Sewer connected
- Home design: Single-family residence; One story; Faces east
- Construction: Frame construction with wood siding; Metal roof; Crawlspace foundation; Built area about 1,422 square feet (public records)
- Exterior features: Corner lot; Approximately 1.84 acres
Interior
- Kitchen: No appliances listed
- Bedrooms: 3 bedrooms
- Flooring: Other flooring
- Bathrooms: 2 full bathrooms
- Heating & cooling: Electric heating; Central air conditioning
- Interior features: No notable interior features listed
- Laundry & utility: Laundry closet
Neighborhood map
What this means for you Summary
Snapshot
- This is a 3-bed/2.0-bath single-family listed at $240k. Condition is rated fair.
Deal economics
- At list price, monthly cash flow is $-79 ($-943/yr) — negative.
- To cash-flow at today's rent, offer at most $229k (4.7% below list).
- To meet the 1% rule (rent ≥ 1% of price), the offer needs to be $200k (16.7% below list).
- Recommended offer: $200k (16.7% below list) — sets the bar for 1% rule.
- Cap rate 5.9% vs local median 3.3% in East Palatka — top-decile yield for the area; either an underpriced asset or a hidden risk that comps aren't pricing in. Stress-test before assuming the spread holds.
Location & tenants
- Location reads 61/100 on livability (#789 in FL) — a middle-class / working-renter tenant base. Strengths: crime A+, cost of living A+; Watch: health & safety C-, schools F, amenities F.
- Putnam (town): math 34% / reading 39% proficiency, ranked #66 of 73 in FL (top 90%) — families likely to look elsewhere, expect single-tenant / working-renter base with shorter leases; 71% free/reduced lunch — lower-income household profile, screen leases tightly.
- Market conditions: 61 active listings in the ZIP; 1 comparable units currently listed for rent nearby; 113 units permitted in Putnam County in 2024 (0 in 5+ unit buildings).
Forward outlook
- Local home prices are declining (-1.3%/yr); year-one equity from $2k of loan paydown is wiped out by about $3k of value loss. Plan a longer hold.
- Putnam County population projected at -31% by 2050 — secular population decline; favor cash flow + early exit over multi-decade hold.
Negotiation context
- It's been on market 28 days — a 2% lower offer ($236k) is reasonable based on typical stale-listing flexibility.
Risks & watch-outs
- Climate carrying-cost: severe wind risk, 99% chance of damaging wind over 30y; major wildfire risk; extreme-heat days projected 7→20/yr by 2055 (HVAC capex compounding) — expect insurance premiums to compound above CPI over the hold.
Questions for the listing agent
- What do current leases actually rent for vs. the listed asking? Can we see a recent rent roll and the last 12 months of T-12 income?
- Have any recent inspections been done? Can we get a copy of the seller's disclosures and any deferred-maintenance estimates?
- Built in 1976 — when were the roof, HVAC, electrical panel, plumbing, and water heater last replaced?
- Is there a deadline driving the sale (1031 exchange, divorce, estate, relocation)? That informs how much negotiation room exists.
- Schools are F-rated, which usually means shorter tenancies and higher turnover. Who's the typical renter profile here, and what's been the actual vacancy rate?
- The area grade is low — what's the realistic commute time and amenity access for the typical tenant pool here? Any planned neighborhood developments (good or bad) we should know about?
- What's the average days-on-market for RENTAL listings here right now (not sales)? A rising rental-DOM trend means longer vacancies and softer asking-rent achievability than the comps imply.
- What's the recent tenant-quality profile in this submarket — average credit score on applications, eviction rate, late-payment / NSF rate, and stable-employment percentage? A property-management company in the area should have these aggregated.
- How much new for-sale + rental construction is in the pipeline within 1–3 miles? Heavy new supply typically softens prices + rents 12–24 months out; constrained supply supports both.
Investment metrics
- 1% rule
- 0.83% ✗
- Cap rate
- 5.90%
- Cash-on-cash
- -1.40%
- DSCR
- 0.94
- GRM
- 10.0
CMA / ARV
No comps found within radius.
Projected returns pro-forma
-1.33% appreciation · 3.0% rent growth · sell at horizon
- IRR
- -9.4%
- Equity multiple
- 0.60×
- Total profit
- $-26,556
- Equity at exit
- $54,199
- IRR
- -2.3%
- Equity multiple
- 0.80×
- Total profit
- $-13,464
- Equity at exit
- $53,789
Cash invested: $67,200 (down + closing). Projections, not guarantees.
Landlord ↔ Tenant lean methodology
- Overall (STATE)
- 87 Strongly Landlord-Friendly
- State Florida
- 87 Strongly Landlord-Friendly · R+3
- County
- — inherits STATE
- City
- — inherits STATE
ZIP-level market 32131
- Home prices YoY
- -0.5%
- Active inventory
- 61
- Price-to-rent
- 10.0×
Monthly cashflow live
- Estimated rent
- $2,000 medium interval (Pro) →
- Mortgage (P&I)
- −$1,259
- Tax est. 1.5%
- −$300 /mo · $3,600/yr
- Insurance
- −$100
- HOA
- −$0
- Vacancy / Maint / Mgmt
- −$420
- Net cashflow
- $-79
Break-even live
UW: 25.0% down · 7.5% · 30yr · 1.5% tax · 5.0% vac · 8.0% maint · 8.0% mgmt
Financing live
Cash to close
- Down payment
- $60,000
- Closing costs
- $7,200
- Reserves months
- —
- Total cash needed
- —
Loan-product check · same deal, 3 products live
Conventional
25% down · 7.5% · 30yr
- Down + closing
- —
- Monthly P&I
- —
- Monthly cashflow
- —
- DSCR
- —
- Eligible?
- —
Personal DTI + credit; lowest rate.
DSCR
20% down · 8.5% · 30yr
- Down + closing
- —
- Monthly P&I
- —
- Monthly cashflow
- —
- DSCR
- —
- Eligible?
- —
No personal income docs; deal must DSCR.
Hard money
10% down · 12.0% · 12mo
- Down + closing
- —
- Monthly P&I
- —
- Monthly cashflow
- —
- DSCR
- —
- Eligible?
- —
Short-term bridge; refi at stabilization.
Rent comps 1 comps
| Address | Beds | Baths | Sqft | Rent | $/sqft | DOM | Units | Dist |
|---|---|---|---|---|---|---|---|---|
| 138 Woods Rd San Mateo, FL | 3.0 | 1.0 | 1000 | $2,000 | $2.00 | 1d | 1 | 0.90mi |
Listing history 14 events
-
2026-06-18days on market $240,000 Active 28 DOM
-
2026-06-17days on market $240,000 Active 27 DOM
-
2026-06-16days on market $240,000 Active 26 DOM
-
2026-06-15days on market $240,000 Active 25 DOM
-
2026-06-13days on market $240,000 Active 23 DOM
-
2026-06-09days on market $240,000 Active 19 DOM
-
2026-06-08days on market $240,000 Active 18 DOM
-
2026-06-07days on market $240,000 Active 17 DOM
-
2026-06-05days on market $240,000 Active 14 DOM
-
2026-06-03days on market $240,000 Active 13 DOM
-
2026-06-02days on market $240,000 Active 12 DOM
-
2026-06-01days on market $240,000 Active 11 DOM
-
2026-05-31days on market $240,000 Active 10 DOM
-
2026-05-21$240,000 Active
ⓘ Source: listings_history table (triggers on properties + properties_extension) + one-shot
backfill from property_details.listing_events for pre-trigger history.
Climate risk First Street
- Flood 1/10 Low FEMA zone X (unshaded) · 0% chance over 30 yrs
- Wildfire 6/10 Major
- Heat 9/10 Extreme 7 d/yr ≥108°F today · 20 d/yr by 30 yrs out
- Wind 9/10 Extreme 99% chance of damaging wind over 30 yrs
- Air quality 2/10 Low 2 unhealthy d/yr today · 2 by 30 yrs out
Nearby sold comps map
Loading sold comps map…
Walkable amenities ~0.75 mi
Loading nearby amenities…
Taxation est. · year 1
- Rental income
- $24,000
- − Mortgage interest
- −$13,444
- − Property taxes
- −$3,600
- − Insurance
- −$1,200
- − Repairs & maintenance
- −$1,920
- − Management
- −$1,920
- − Depreciation
- −$6,982
- Taxable loss
- −$5,066
- Est. tax savings @ 24.0%
- +$1,216
- After-tax cash flow
- $273/yr
For passive investors: Depreciation is non-cash, so a rental often shows a tax loss while cash-flowing — sheltering income. Rental losses are passive: they offset passive income freely, and up to $25,000/yr can offset ordinary (W-2) income if you actively participate and your MAGI is under $100k (phasing out to $0 by $150k); unused losses carry forward. On sale, claimed depreciation is recaptured at up to 25%, and gains may owe capital-gains tax (a 1031 exchange can defer both). Figures are a year-1 estimate at your 24.0% rate — not tax advice; consult a CPA.
Condition & rehab AI · 12 photos
This ranch-style home in East Palatka requires significant repairs and updates to bring it up to current standards, but presents a solid foundation for a potential investor to work with.
Repairs flagged
- Major roof — Signs of significant wear and potential leaks
- Major exterior siding — Severe weathering and damage
- Major flooring — Worn-out and in need of replacement
- Major interior walls/paint — Worn-out and in need of repainting
- Major bathrooms — Worn-out fixtures and need for updates
- Major kitchen — Worn-out appliances and need for updates
- Major landscaping — Overgrown and in need of trimming
Value-add opportunities
- Both Painting and repainting the exterior and interior — Enhances curb appeal and interior aesthetics
- Both Re-roofing the house — Fixes potential leaks and enhances structural integrity
- Both Replacing the flooring — Improves comfort and aesthetics
- Both Updating the kitchen appliances — Enhances functionality and aesthetics
- Both Updating the bathrooms — Enhances functionality and aesthetics
- Both Landscaping and trimming the yard — Enhances curb appeal and property value
Renovation cost estimate screening
| Repair item | Severity | Est. cost |
|---|---|---|
| roof · Signs of significant wear and potential leaks | Major | $15,000–50,000 |
| exterior siding · Severe weathering and damage | Major | $15,000–50,000 |
| flooring · Worn-out and in need of replacement | Major | $15,000–50,000 |
| interior walls/paint · Worn-out and in need of repainting | Major | $15,000–50,000 |
| bathrooms · Worn-out fixtures and need for updates | Major | $15,000–50,000 |
| kitchen · Worn-out appliances and need for updates | Major | $15,000–50,000 |
| landscaping · Overgrown and in need of trimming | Major | $15,000–50,000 |
| Total estimated repair cost · 7 items | $105,000–350,000 |
Value-add ROI direction
- Both Painting and repainting the exterior and interior — Enhances curb appeal and interior aesthetics ↑
- Both Re-roofing the house — Fixes potential leaks and enhances structural integrity ↑
- Both Replacing the flooring — Improves comfort and aesthetics ↑
- Both Updating the kitchen appliances — Enhances functionality and aesthetics ↑
- Both Updating the bathrooms — Enhances functionality and aesthetics ↑
- Both Landscaping and trimming the yard — Enhances curb appeal and property value ↑
ⓘ Cost ranges are severity-bucket heuristics (US national rule-of-thumb). Get contractor quotes + a written scope before underwriting a rehab budget.
Schools (NCES district)
- District
- Putnam
- NCES district ID
- 1201620
- Math proficiency
- 34% ▼ -10.00%
- Reading proficiency
- 39% ▼ -4.00%
- Median HH income
- $33,350
- Composite
- 29.99/100
- National rank
- #6361
- State rank
- #66 of 73 in FL
Livability — East Palatka
- Score
- 61/100
- State rank
- #789
- US rank
- #18035
Category grades
Schools grade is shown separately in the Schools card above.
Census & demographics
- Population (ZIP)
- 4,596
Population outlook (Putnam County) Hauer SSP2
- Today (2025)
- 65,299 people
- By 2030
- 61,255 · -6.2%
- By 2040
- 52,930 · -18.9%
- By 2050
- 45,051 · -31.0%
- By 2075
- 28,720 · -56.0%
- By 2100
- 15,852 · -75.7%
Race, ethnicity, and origin ACS 2023
- Neighborhood character
- Predominantly White (76%)
- Race & ethnicity
- White 76% Black 14% Two or more races 9% Hispanic / Latino 7%
- Hispanic origin (detail)
- Mexican 2% Puerto Rican 2%
- Common ancestry
- Lithuanian 3% Italian 2% Iranian 2%
- Foreign-born
- 3% · Canada
- Languages at home
- 96% English-only · Spanish 3%
Political lean MEDSL · Putnam
- 2024 margin
- Solid R (+47.8) · D 25.8% · R 73.6%
- 2008→2024 swing
- -28.5pp toward R · 2008: -19.3pp · 2024: -47.8pp
- All cycles
- 2024: R+47.8 2020: R+41.2 2016: R+36.6 2012: R+24.5 2008: R+19.3
Not yet ingested
- Civics
- —
Market trends
- HPI YoY
- ▼ -1.33%
- Current HPI
- 277.8522
- Rent YoY
- —
- Metro
- —
- State GDP YoY
- ▲ 3.28%
- F500 in state
- 36
Industry mix (Fortune 500 HQ in FL)
| Industry | F500 HQs | Revenue |
|---|---|---|
| Industrial Technology | 2 | $29B |
|
||
| Insurance | 2 | $17B |
|
||
| Retail | 1 | $60B |
|
||
| Technology Distribution | 1 | $58B |
|
||
| Homebuilding | 1 | $35B |
|
||
| Technology Manufacturing | 1 | $35B |
|
||
Price history
1 event — show timeline
- 2026-05-21 Listed $240,000 Stellar MLS as Distributed by MLS Grid
Cash-flow waterfall
monthlySold comps — $/sqft
last 12 mo · ≤1 miLoading sold comps…