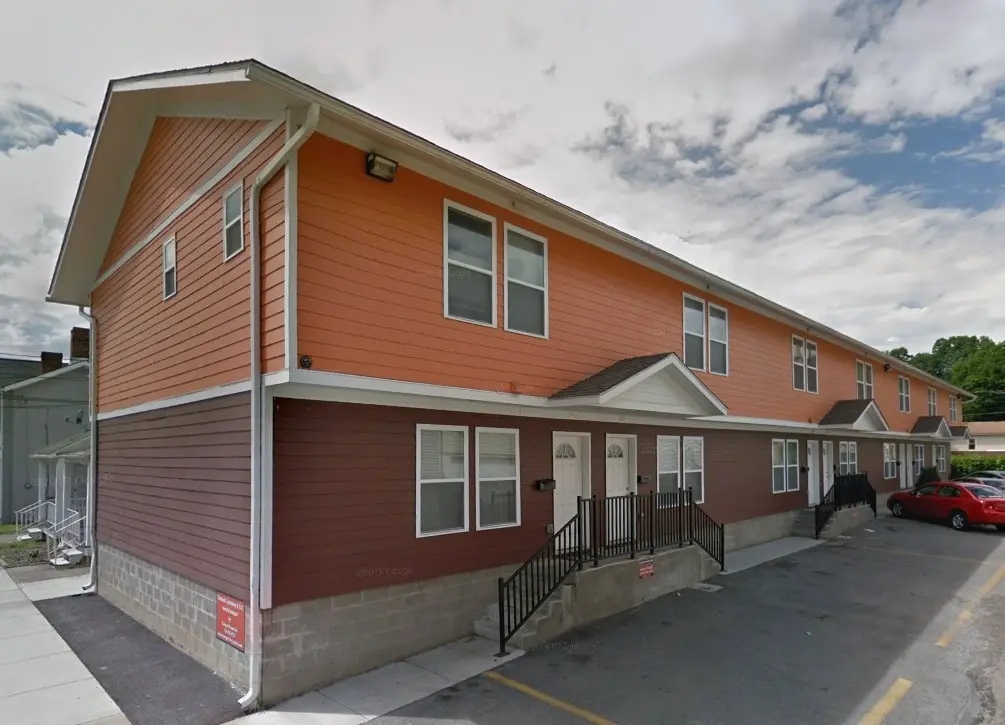
 7-Plex
151 Plum Way · California, PA
Flood risk 10/10 · Severe
- FEMA flood zone
- AE
- Chance of flooding over 30 yrs
- 0.99%
- Est. flood insurance / yr
- $2,026 – $9,024
Fire risk 1/10 · Minimal
- Est. fire insurance / yr
- $511 – $949
Heat risk 5/10 · Moderate
- Hot days now (above 99°F)
- 8 days/yr
- Hot days in 30 yrs
- 20 days/yr
Wind risk 2/10 · Minimal
- Chance of severe wind over 30 yrs
- —
Air-quality risk 2/10 · Minimal
- Unhealthy air days now
- 1 days/yr
- Unhealthy air days in 30 yrs
- 2 days/yr
Risk factors via First Street. Map © Google.
Why this score? — see what drove the B- grade
The composite is a weighted blend of 9 inputs, each scored 0–100. Each bar is that input's sub-score; the figure is the points it added to the 100-point composite (weight × sub-score).
- Cash flow +25.6/30.0
- DSCR +8.5/10.0
- ARV discount +7.5/15.0
- 1% rule +6.7/10.0
- Appreciation +4.7/10.0
- Condition / age +4.0/5.0
- Schools +3.7/10.0
- Livability +2.8/5.0
- Rent growth +2.5/5.0
$639,800
🖨 Deal sheet (PDF) 📄 Offer letter ✓ Due diligence
Multi-family units
County records classify this as Multi-Family (5+ Unit). Listing-text estimate: 7 units. confirmed
5+ unit building — per-unit beds/baths from public records are typically unavailable; the breakdown below (if shown) is an estimate from the listing text.
Listing remarks MLS
Seven-unit building. Walking distance to Cal U(Penn West) Each unit is identical. Three Bedroom, 2.5 Baths. kitchen, family room & laundry. Large kitchens. Spacious living rooms. Half bath on main floor. Primary bedroom on second floor with private bathroom. 2 additional bedrooms, full bathroom & laundry. Large parking area. Each unit has one assigned spot in front of their door. There is an additional parking lot that goes with the property across the street.
Key facts
- Large kitchens
- Private bathroom
- Large parking area
Tags
Neighborhood map
What this means for you Summary
Snapshot
- This is a 7 × 3-bed/2.5-bath units multifamily listed at $640k. Condition is rated good.
Deal economics
- At list price, monthly cash flow is $1k ($13k/yr) — positive. Per door: $150/mo.
- The deal already cash-flows at list — no discount required.
- Meets the 1% rule at list price ($8k rent vs $640k).
- Recommended offer: $563k (12.0% below list) — sets the bar for market timing.
Location & tenants
- Location reads 56/100 on livability (#1,648 in PA) — a working-class tenant base; expect higher turnover. Strengths: cost of living A+, housing A-; Watch: crime C-, schools D, amenities F.
- California Area SD (rural): math 31% / reading 58% proficiency, ranked #295 of 539 in PA (top 55%) — families likely to look elsewhere, expect single-tenant / working-renter base with shorter leases.
- Market conditions: 18 active listings in the ZIP; 489 units permitted in Washington County in 2024 (30 in 5+ unit buildings).
Forward outlook
- In year one you build about $864 of equity ($4k loan paydown + $-4k appreciation (-0.6% local appreciation)).
- Washington County population projected to shrink 6% by 2050 — rents likely to lag national; underwrite the cash flow, not the appreciation.
- At projected returns (-0.6% appreciation + 3.0% rent growth), your $179k cash investment doubles in ~9 years — after that, you're playing with house money.
- By year 10, paydown + projected appreciation supports a ~$37k cash-out refi (75% LTV) — recoverable capital for the next deal without selling this one.
Negotiation context
- It's been on market 121 days — a 12% lower offer ($563k) is reasonable based on typical stale-listing flexibility.
Risks & watch-outs
- Watch-outs: flood insurance adds $460/mo.
- Climate carrying-cost: in FEMA flood zone AE (mandatory federal flood insurance); extreme-heat days projected 8→20/yr by 2055 (HVAC capex compounding) — expect insurance premiums to compound above CPI over the hold.
Questions for the listing agent
- It's been on market 121 days. Have you received any prior offers? Is the seller open to a 12% concession, seller financing, or rate buy-down credit?
- Can we see the unit-by-unit rent roll, current vacancy, and any below-market leases? What's the average tenancy length?
- What capital expenditures (roof, boiler, parking lot, exteriors) have been made in the last 5 years, and what's planned in the next 2?
- What's the actual annual flood-insurance premium (NFIP or private), and is the property in a SFHA with mandatory coverage?
- Why hasn't it sold? Are there any deal-killer items the seller is aware of (foundation, flood, title, zoning, code violations)?
- Is there a deadline driving the sale (1031 exchange, divorce, estate, relocation)? That informs how much negotiation room exists.
- Schools are D-rated, which usually means shorter tenancies and higher turnover. Who's the typical renter profile here, and what's been the actual vacancy rate?
- What's the average days-on-market for RENTAL listings here right now (not sales)? A rising rental-DOM trend means longer vacancies and softer asking-rent achievability than the comps imply.
- What's the recent tenant-quality profile in this submarket — average credit score on applications, eviction rate, late-payment / NSF rate, and stable-employment percentage? A property-management company in the area should have these aggregated.
- How much new apartment / multifamily construction is in the pipeline within 1–3 miles? Heavy new supply (>2% of stock underway) typically softens rents 12–24 months out; light construction supports rent growth.
Investment metrics
- 1% rule
- 1.17% ✓
- Cap rate
- 9.12%
- Cash-on-cash
- 10.11%
- DSCR
- 1.45
- GRM
- 7.1
CMA / ARV
No comps found within radius.
Projected returns pro-forma
-0.56% appreciation · 3.0% rent growth · sell at horizon
- IRR
- 3.9%
- Equity multiple
- 1.18×
- Total profit
- $31,973
- Equity at exit
- $168,179
- IRR
- 9.9%
- Equity multiple
- 2.01×
- Total profit
- $181,223
- Equity at exit
- $188,600
Cash invested: $179,144 (down + closing). Projections, not guarantees.
Landlord ↔ Tenant lean methodology
- Overall (STATE)
- 62 Landlord-Friendly
- State Pennsylvania
- 62 Landlord-Friendly · EVEN
- County
- — inherits STATE
- City
- — inherits STATE
ZIP-level market 15419
- Home prices YoY
- -0.3%
- Active inventory
- 18
- Price-to-rent
- 49.7×
Monthly cashflow live
- Estimated rent
- $7,508 high interval (Pro) →
- Mortgage (P&I)
- −$3,355
- Tax est. 1.5%
- −$800 /mo · $9,597/yr
- Insurance
- −$267
- Flood insurance flood zone
- −$460 /mo · $5,525/yr
- HOA
- −$0
- Vacancy / Maint / Mgmt
- −$1,577
- Net cashflow
- $1,049
Break-even live
Sensitivity live
| Price | -10% $1,492 | -5% $1,270 | +0% $1,049 | +5% $828 | +10% $607 |
|---|---|---|---|---|---|
| Rent | -10% $456 | -5% $753 | +0% $1,049 | +5% $1,346 | +10% $1,643 |
| Rate | -1.0pp $1,372 | -0.5pp $1,212 | base $1,049 | +0.5pp $884 | +1.0pp $715 |
7-unit breakdown (identical units grouped — click to expand)
| Units | Beds | Baths | Est. rent |
|---|---|---|---|
| 7× units | 3 | 2.5 | $7,511 |
| #1 | 3 | 2.5 | $1,073 |
| #2 | 3 | 2.5 | $1,073 |
| #3 | 3 | 2.5 | $1,073 |
| #4 | 3 | 2.5 | $1,073 |
| #5 | 3 | 2.5 | $1,073 |
| #6 | 3 | 2.5 | $1,073 |
| #7 | 3 | 2.5 | $1,073 |
| Total (7 units) | $7,508 | ||
UW: 25.0% down · 7.5% · 30yr · 1.5% tax · 5.0% vac · 8.0% maint · 8.0% mgmt
Financing live
Cash to close
- Down payment
- $159,950
- Closing costs
- $19,194
- Reserves months
- —
- Total cash needed
- —
Loan-product check · same deal, 3 products live
Conventional
25% down · 7.5% · 30yr
- Down + closing
- —
- Monthly P&I
- —
- Monthly cashflow
- —
- DSCR
- —
- Eligible?
- —
Personal DTI + credit; lowest rate.
DSCR
20% down · 8.5% · 30yr
- Down + closing
- —
- Monthly P&I
- —
- Monthly cashflow
- —
- DSCR
- —
- Eligible?
- —
No personal income docs; deal must DSCR.
Hard money
10% down · 12.0% · 12mo
- Down + closing
- —
- Monthly P&I
- —
- Monthly cashflow
- —
- DSCR
- —
- Eligible?
- —
Short-term bridge; refi at stabilization.
Listing history 16 events
-
2026-06-21days on market $639,800 Active 121 DOM
-
2026-06-18days on market $639,800 Active 119 DOM
-
2026-06-17days on market $639,800 Active 118 DOM
-
2026-06-16days on market $639,800 Active 117 DOM
-
2026-06-15days on market $639,800 Active 116 DOM
-
2026-06-13days on market $639,800 Active 114 DOM
-
2026-06-12days on market $639,800 Active 113 DOM
-
2026-06-09days on market $639,800 Active 110 DOM
-
2026-06-08days on market $639,800 Active 109 DOM
-
2026-06-08days on market $639,800 Active 108 DOM
-
2026-06-04days on market $639,800 Active 104 DOM
-
2026-06-02days on market $639,800 Active 103 DOM
-
2026-06-01days on market $639,800 Active 102 DOM
-
2026-05-31days on market $639,800 Active 101 DOM
-
2026-04-06price $639,800 476-char remark
Show marketing remark (476 chars)
Seven-unit building. Walking distance to Cal U(Penn West) Each unit is identical. Three Bedroom, 2.5 Baths. kitchen, family room & laundry. Large kitchens. Spacious living rooms. Half bath on main floor. Primary bedroom on second floor with private bathroom. 2 additional bedrooms, full bathroom & laundry. Large parking area. Each unit has one assigned spot in front of their door. There is an additional parking lot that goes with the property across the street.
-
2026-02-19$639,900 Active 476-char remark
Show marketing remark (476 chars)
Seven-unit building. Walking distance to Cal U(Penn West) Each unit is identical. Three Bedroom, 2.5 Baths. kitchen, family room & laundry. Large kitchens. Spacious living rooms. Half bath on main floor. Primary bedroom on second floor with private bathroom. 2 additional bedrooms, full bathroom & laundry. Large parking area. Each unit has one assigned spot in front of their door. There is an additional parking lot that goes with the property across the street.
ⓘ Source: listings_history table (triggers on properties + properties_extension) + one-shot
backfill from property_details.listing_events for pre-trigger history.
Climate risk First Street
- Flood 10/10 Extreme FEMA zone AE · 99% chance over 30 yrs
- Wildfire 1/10 Low
- Heat 5/10 Major 8 d/yr ≥99°F today · 20 d/yr by 30 yrs out
- Wind 2/10 Low
- Air quality 2/10 Low 1 unhealthy d/yr today · 2 by 30 yrs out
Nearby sold comps map
Loading sold comps map…
Walkable amenities ~0.75 mi
Loading nearby amenities…
Taxation est. · year 1
- Rental income
- $90,096
- − Mortgage interest
- −$35,839
- − Property taxes
- −$9,597
- − Insurance
- −$8,724
- − Repairs & maintenance
- −$7,208
- − Management
- −$7,208
- − Depreciation
- −$18,612
- Taxable income
- $2,909
- Est. tax owed @ 24.0%
- −$698
- After-tax cash flow
- $11,895/yr
For passive investors: Depreciation is non-cash, so a rental often shows a tax loss while cash-flowing — sheltering income. Rental losses are passive: they offset passive income freely, and up to $25,000/yr can offset ordinary (W-2) income if you actively participate and your MAGI is under $100k (phasing out to $0 by $150k); unused losses carry forward. On sale, claimed depreciation is recaptured at up to 25%, and gains may owe capital-gains tax (a 1031 exchange can defer both). Figures are a year-1 estimate at your 24.0% rate — not tax advice; consult a CPA.
Condition & rehab AI · 13 photos
This seven-unit multi-family property is in good condition with minimal repairs needed. Painting and updating the flooring can significantly enhance its resale and rental value.
Value-add opportunities
- Both Painting the exterior and interior walls — Fresh paint can enhance the curb appeal and interior aesthetics, making the property more attractive to potential buyers and renters.
- Both Updating the flooring in the living areas — Replacing worn-out flooring with modern, durable options can improve the overall look and feel of the home, increasing its value.
Renovation cost estimate screening
Value-add ROI direction
- Both Painting the exterior and interior walls — Fresh paint can enhance the curb appeal and interior aesthetics, making the property more attractive to potential buyers and renters. ↑
- Both Updating the flooring in the living areas — Replacing worn-out flooring with modern, durable options can improve the overall look and feel of the home, increasing its value. ↑
ⓘ Cost ranges are severity-bucket heuristics (US national rule-of-thumb). Get contractor quotes + a written scope before underwriting a rehab budget.
Schools (NCES district)
- District
- California Area SD
- NCES district ID
- 4204710
- Math proficiency
- 31% ▼ -19.00%
- Reading proficiency
- 58% ▼ -9.00%
- Median HH income
- $40,621
- Composite
- 37.22/100
- National rank
- #4466
- State rank
- #295 of 539 in PA
Livability — California
- Score
- 56/100
- State rank
- #1648
- US rank
- #22817
Category grades
Schools grade is shown separately in the Schools card above.
Census & demographics
- Census place
- California, PA
- City population
- 5,469
- Population (ZIP)
- 3,527
Population outlook (Washington County) Hauer SSP2
- Today (2025)
- 208,060 people
- By 2030
- 207,168 · -0.4%
- By 2040
- 202,738 · -2.6%
- By 2050
- 195,269 · -6.1%
- By 2075
- 175,588 · -15.6%
- By 2100
- 145,827 · -29.9%
Race, ethnicity, and origin ACS 2023
- Neighborhood character
- Predominantly White (74%)
- Race & ethnicity
- White 74% Black 12% Two or more races 10% Hispanic / Latino 2% Asian 1%
- Common ancestry
- Romanian 6% Slovak 3% Scotch-Irish 2%
- Foreign-born
- 3% · Canada, China
- Languages at home
- 97% English-only · Spanish 1% French/Haitian/Cajun 1% Other Indo-European 1%
Political lean MEDSL · Washington
- 2024 margin
- Strong R (+25.5) · D 36.9% · R 62.4%
- 2008→2024 swing
- -20.8pp toward R · 2008: -4.7pp · 2024: -25.5pp
- All cycles
- 2024: R+25.5 2020: R+22.8 2016: R+25.3 2012: R+13.3 2008: R+4.7
Not yet ingested
- Civics
- —
Market trends
- HPI YoY
- ▼ -0.56%
- Current HPI
- 160.7366
- Rent YoY
- —
- Metro
- —
- State GDP YoY
- ▲ 1.68%
- F500 in state
- 34
Industry mix (Fortune 500 HQ in PA)
| Industry | F500 HQs | Revenue |
|---|---|---|
| Healthcare | 2 | $309B |
|
||
| Insurance | 2 | $27B |
|
||
| Telecommunications / Media | 1 | $124B |
|
||
| Industrial Distribution | 1 | $22B |
|
||
| Financial Services | 1 | $20B |
|
||
| Chemicals / Materials | 1 | $18B |
|
||
Price history
-0.0% since first listed2 events — show timeline
- 2026-04-06 Price Changed $639,800 West Penn MLS
- 2026-02-19 Listed $639,900 West Penn MLS
Cash-flow waterfall
monthlySold comps — $/sqft
last 12 mo · ≤1 miLoading sold comps…