2126 N 115th St · Wauwatosa, WI
Flood risk 1/10 · Minimal
- FEMA flood zone
- X (unshaded)
- Chance of flooding over 30 yrs
- 0.0%
- Est. flood insurance / yr
- $473 – $860
Fire risk 1/10 · Minimal
- Est. fire insurance / yr
- $636 – $1,182
Heat risk 2/10 · Minimal
- Hot days now (above 101°F)
- 7 days/yr
- Hot days in 30 yrs
- 13 days/yr
Wind risk 2/10 · Minimal
- Chance of severe wind over 30 yrs
- —
Air-quality risk 2/10 · Minimal
- Unhealthy air days now
- 1 days/yr
- Unhealthy air days in 30 yrs
- 2 days/yr
Risk factors via First Street. Map © Google.
Why this score? — see what drove the C+ grade
The composite is a weighted blend of 9 inputs, each scored 0–100. Each bar is that input's sub-score; the figure is the points it added to the 100-point composite (weight × sub-score).
- Cash flow +19.1/30.0
- ARV discount +15.0/15.0
- DSCR +6.0/10.0
- 1% rule +5.4/10.0
- Livability +4.4/5.0
- Schools +4.3/10.0
- Rent growth +3.3/5.0
- Condition / age +2.5/5.0
- Appreciation +0.0/10.0
$189,900
🖨 Deal sheet 📄 Offer letter ✓ Due diligence
Listing remarks MLS
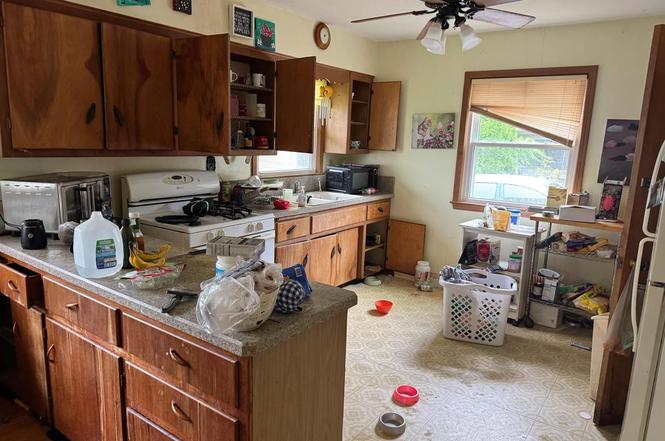
Great house in great location. Quiet tree-lined street is only minutes from shopping & freeway. Gleaming hardwood floors, updated kitchen counters, updated elec. 2004, furnace & CA 2001, roof 2001. Rec room w/ bar, 3 season room off garage. Great brick patio perfect for relaxation. Move in & make this your new home.
Key facts
- 7,405 sq ft lot
- Garage
- Built 1954
Property features AI
Exterior
- Parking: Detached 1-car garage
- Utilities: Municipal water; Municipal sewer
- Home design: Single-family home; One-story
- Construction: Aluminum/steel siding
- Exterior features: Aluminum/steel exterior; Lot less than 1/2 acre; Zoned residential
Interior
- Kitchen: Kitchen on main level approximately 11 x 10
- Bedrooms: Master bedroom on main level approximately 12 x 12; Second bedroom on main level approximately 11 x 9
- Bathrooms: One full bathroom
- Heating & cooling: Forced air heating; Natural gas fuel
- Interior features: Full basement; Living room (main level) approximately 16 x 14; Dining room (main level) approximately 16 x 8
Neighborhood map
What this means for you Summary
Snapshot
- This is a 2-bed/1.0-bath single-family listed at $190k.
Deal economics
- At list price, monthly cash flow is $202 ($2k/yr) — positive.
- The deal already cash-flows at list — no discount required.
- Meets the 1% rule at list price ($2k rent vs $190k).
- Cap rate 7.6% vs local median 2.5% in Wauwatosa — top-decile yield for the area; either an underpriced asset or a hidden risk that comps aren't pricing in. Stress-test before assuming the spread holds.
Location & tenants
- Location reads 87/100 on livability (#19 in WI, #257 nationally) — a professional / high-income tenant draw. Strengths: commute A+, employment A+, housing A+.
- Wauwatosa School District (suburban): math 45% / reading 52% proficiency, ranked #55 of 342 in WI (top 16%) — families likely to look elsewhere, expect single-tenant / working-renter base with shorter leases; only 17% free/reduced lunch — higher-income household profile.
- Market conditions: Rents rising (+3.3%/yr); 36 active listings in the ZIP; 12 comparable units currently listed for rent nearby; rentals leasing fast (median 2d on market — plan ~1-2 weeks tenant-placement turnaround); solid renter incomes; 1,017 units permitted in Milwaukee County in 2024 (803 in 5+ unit buildings).
Forward outlook
- Local home prices are declining (-3.0%/yr); year-one equity from $1k of loan paydown is wiped out by about $6k of value loss. Plan a longer hold.
- Milwaukee County population projected at +4% by 2050 — modest demand growth; plan on rents tracking national, not racing it.
Negotiation context
- Only 1 days on market — expect competitive offers; lowballing is unlikely to land.
Risks & watch-outs
- Watch-outs: built in 1954 — expect roof / HVAC / electrical / plumbing capex.
Questions for the listing agent
- Built in 1954 — when were the roof, HVAC, electrical panel, plumbing, and water heater last replaced?
- Is there a deadline driving the sale (1031 exchange, divorce, estate, relocation)? That informs how much negotiation room exists.
- Schools are B-rated — typically a magnet for longer-tenancy family renters. What's the average tenant stay here, and is there a school-zone premium baked into asking?
- What's the average days-on-market for RENTAL listings here right now (not sales)? A rising rental-DOM trend means longer vacancies and softer asking-rent achievability than the comps imply.
- What's the recent tenant-quality profile in this submarket — average credit score on applications, eviction rate, late-payment / NSF rate, and stable-employment percentage? A property-management company in the area should have these aggregated.
- How much new for-sale + rental construction is in the pipeline within 1–3 miles? Heavy new supply typically softens prices + rents 12–24 months out; constrained supply supports both.
Investment metrics
- 1% rule
- 1.04% ✓
- Cap rate
- 7.57%
- Cash-on-cash
- 4.56%
- DSCR
- 1.20
- GRM
- 8.0
CMA / ARV
- ARV (on-the-fly)
- $286,710
- Comps found
- 3
Show comp detail 3 sales within ~0.75 mi
| Address | Dist | Beds/Ba | Sqft | Sold | Price | $/sf | Match |
|---|---|---|---|---|---|---|---|
| 2529 N 114th St | 0.47mi | 3/1.0 (+1) | 1,010 (+0%) | 20mo | $279,900 | $277 | 56 |
| 1661 N 119th St | 0.47mi | 2/1.0 | 1,150 (+14%) | 12mo | $349,000 | $303 | 44 |
| 1751 N 119th St | 0.39mi | 3/1.5 (+1) | 1,104 (+10%) | 20mo | $315,000 | $285 | 42 |
Match score weights: distance 35% · size 25% · config 20% · recency 20%. Top-matched comps best support the ARV.
Projected returns pro-forma
-3.0% appreciation · 3.26% rent growth · sell at horizon
- IRR
- -8.9%
- Equity multiple
- 0.67×
- Total profit
- $-17,322
- Equity at exit
- $28,315
- IRR
- 1.0%
- Equity multiple
- 1.07×
- Total profit
- $3,882
- Equity at exit
- $16,419
Cash invested: $53,172 (down + closing). Projections, not guarantees.
Landlord ↔ Tenant lean methodology
- Overall (STATE)
- 73 Landlord-Friendly
- State Wisconsin
- 73 Landlord-Friendly · R+2
- County
- — inherits STATE
- City
- — inherits STATE
ZIP-level market 53226
- Rents YoY
- 3.3%
- Active inventory
- 36
- Price-to-rent
- 8.0×
Monthly cashflow live
- Estimated rent
- $1,983 high interval (Pro) →
- Mortgage (P&I)
- −$996
- Tax from tax record
- −$289 /mo · $3,474/yr
- Insurance
- −$79
- HOA
- −$0
- Vacancy / Maint / Mgmt
- −$416
- Net cashflow
- $202
Break-even live
UW: 25.0% down · 7.5% · 30yr · 1.5% tax · 5.0% vac · 8.0% maint · 8.0% mgmt
Financing live
Cash to close
- Down payment
- $47,475
- Closing costs
- $5,697
- Reserves months
- —
- Total cash needed
- —
Loan-product check · same deal, 3 products live
Conventional
25% down · 7.5% · 30yr
- Down + closing
- —
- Monthly P&I
- —
- Monthly cashflow
- —
- DSCR
- —
- Eligible?
- —
Personal DTI + credit; lowest rate.
DSCR
20% down · 8.5% · 30yr
- Down + closing
- —
- Monthly P&I
- —
- Monthly cashflow
- —
- DSCR
- —
- Eligible?
- —
No personal income docs; deal must DSCR.
Hard money
10% down · 12.0% · 12mo
- Down + closing
- —
- Monthly P&I
- —
- Monthly cashflow
- —
- DSCR
- —
- Eligible?
- —
Short-term bridge; refi at stabilization.
Rent comps 12 comps
| Address | Beds | Baths | Sqft | Rent | $/sqft | DOM | Units | Dist |
|---|---|---|---|---|---|---|---|---|
| 11011 W North Ave Wauwatosa, WI | 1.0–2.0 | 1.0–2.0 | 980 | $2,361 | $2.41 | 1d | 16 | 0.30mi |
| 11011 W North Ave Wauwatosa, WI | 1.0–2.0 | 1.0–2.0 | 915 | $2,514 | $2.75 | 43d | 18 | 0.30mi |
| 1600 Rivers Bnd Wauwatosa, WI | 1.0–2.0 | 1.0–2.0 | 1032 | $1,895 | $1.84 | 1d | 7 | 0.48mi |
| 2540 N 124th St Unit 459 Wauwatosa, WI | 1.0 | 1.5 | 733 | $1,341 | $1.83 | 3d | 1 | 0.69mi |
| 2540 N 124th St Unit 429 Wauwatosa, WI | 1.0 | 1.5 | 764 | $1,360 | $1.78 | 3d | 1 | 0.69mi |
| 2540 N 124th St Unit 311 Wauwatosa, WI | 2.0 | 1.5 | 1150 | $1,585 | $1.38 | 43d | 1 | 0.69mi |
| 2540 N 124th St Unit 114 Wauwatosa, WI | 1.0 | 1.5 | 733 | $1,409 | $1.92 | 3d | 1 | 0.69mi |
| 2562 N 124th St Wauwatosa, WI | 1.0–2.0 | 1.5–2.0 | 1181 | $2,013 | $1.70 | 1d | 13 | 0.73mi |
| 2929 N Mayfair Rd Wauwatosa, WI | 1.0 | 1.0 | 632 | $2,628 | $4.16 | 1d | 13 | 1.01mi |
| 11221 Synergy Dr Milwaukee, WI | 2.0 | 1.0–2.0 | 788 | $2,070 | $2.63 | 1d | 8 | 1.27mi |
| 11221 Synergy Dr Ste 100 Wauwatosa, WI | 1.0–2.0 | 1.0–2.0 | 874 | $2,855 | $3.26 | 1d | 13 | 1.28mi |
| 13125 Watertown Plank Rd Elm Grove, WI | 2.0–3.0 | 2.0 | 1485 | $2,968 | $2.00 | 1d | 9 | 1.34mi |
Listing history 3 events
-
2026-06-18remarks 206-char remark
-
2026-06-18remarks 188-char remark
-
2026-06-18$189,900 Active 1 DOM
ⓘ Source: listings_history table (triggers on properties + properties_extension) + one-shot
backfill from property_details.listing_events for pre-trigger history.
Tax reassessment forecast WI · Partial reset (capped growth)
- Current annual tax
- $3,474 · $289/mo
- Projected year-2 tax
- $3,493 · $291/mo
- Expected delta
- +$20/yr (+$2/mo · 0.6%)
ⓘ Screening estimate from a state-policy table — verify with the county assessor before closing.
Climate risk First Street
- Flood 1/10 Low FEMA zone X (unshaded) · 0% chance over 30 yrs
- Wildfire 1/10 Low
- Heat 2/10 Low 7 d/yr ≥101°F today · 13 d/yr by 30 yrs out
- Wind 2/10 Low
- Air quality 2/10 Low 1 unhealthy d/yr today · 2 by 30 yrs out
Nearby sold comps map
Loading sold comps map…
Walkable amenities ~0.75 mi
Loading nearby amenities…
Taxation est. · year 1
- Rental income
- $23,795
- − Mortgage interest
- −$10,637
- − Property taxes
- −$3,474
- − Insurance
- −$950
- − Repairs & maintenance
- −$1,904
- − Management
- −$1,904
- − Depreciation
- −$5,524
- Taxable loss
- −$597
- Est. tax savings @ 24.0%
- +$143
- After-tax cash flow
- $2,568/yr
For passive investors: Depreciation is non-cash, so a rental often shows a tax loss while cash-flowing — sheltering income. Rental losses are passive: they offset passive income freely, and up to $25,000/yr can offset ordinary (W-2) income if you actively participate and your MAGI is under $100k (phasing out to $0 by $150k); unused losses carry forward. On sale, claimed depreciation is recaptured at up to 25%, and gains may owe capital-gains tax (a 1031 exchange can defer both). Figures are a year-1 estimate at your 24.0% rate — not tax advice; consult a CPA.
Schools (NCES district)
- District
- Wauwatosa School District
- NCES district ID
- 5515990
- Math proficiency
- 45% ▼ -7.00%
- Reading proficiency
- 52% ▼ -1.00%
- Median HH income
- $69,017
- Composite
- 43.34/100
- National rank
- #3032
- State rank
- #55 of 342 in WI
Livability — Wauwatosa
- Score
- 87/100
- State rank
- #19
- US rank
- #257
Category grades
Schools grade is shown separately in the Schools card above.
Census & demographics
- Census place
- Wauwatosa, WI
- County
- Milwaukee County · 926,379 people
- City population
- 45,813
- Metro
- Milwaukee-Waukesha, WI
- Population (ZIP)
- 18,908
- Household income
- $93,132
- Rent vs Own
- Severe rent burden
- 580.0
Population outlook (Milwaukee County) Hauer SSP2
- Today (2025)
- 995,758 people
- By 2030
- 1,009,124 · +1.3%
- By 2040
- 1,028,128 · +3.3%
- By 2050
- 1,040,066 · +4.4%
- By 2075
- 1,057,849 · +6.2%
- By 2100
- 1,039,774 · +4.4%
Race, ethnicity, and origin ACS 2023
- Neighborhood character
- Predominantly White (79%)
- Race & ethnicity
- White 79% Black 7% Hispanic / Latino 5% Asian 5% Two or more races 4%
- Hispanic origin (detail)
- Mexican 3%
- Common ancestry
- Romanian 10% Portuguese 4% Lithuanian 3%
- Foreign-born
- 6% · Canada, China
- Languages at home
- 92% English-only · Spanish 3% Chinese 1% Other Indo-European 1%
Political lean MEDSL · Milwaukee
- 2024 margin
- Solid D (+38.5) · D 68.3% · R 29.8% · Other 1.8%
- 2008→2024 swing
- +2.7pp toward D · 2008: 35.9pp · 2024: 38.5pp
- All cycles
- 2024: D+38.5 2020: D+39.9 2016: D+37.5 2012: D+34.6 2008: D+35.9
Not yet ingested
- Civics
- —
Market trends
- HPI YoY
- ▼ -227.28%
- Current HPI
- 253.6781
- Rent YoY
- ▲ 3.26%
- Metro
- Milwaukee-Waukesha, WI
- State GDP YoY
- ▲ 2.10%
- F500 in state
- 20
Industry mix (Fortune 500 HQ in WI)
| Industry | F500 HQs | Revenue |
|---|---|---|
| Industrial Machinery | 4 | $23B |
|
||
| Industrial Technology | 2 | $36B |
|
||
| Insurance | 1 | $36B |
|
||
| Professional Services | 1 | $19B |
|
||
| Utilities | 1 | $9B |
|
||
| Consumer Goods | 1 | $3B |
|
||
Price history
+58.4% since first listed4 events — show timeline
- 2026-06-17 Listed $189,900 METROMLS
- 2006-05-04 Sold (Public Records) $167,000 Public Records
- 2006-04-27 Sold (MLS) $167,000 METROMLS
- 2001-12-03 Sold (Public Records) $119,900 Public Records
Property tax history
+0.5%/yrLatest (2024): $3,474 · +7.0% YoY. Source: county tax records.
Cash-flow waterfall
monthlySold comps — $/sqft
last 12 mo · ≤1 miLoading sold comps…