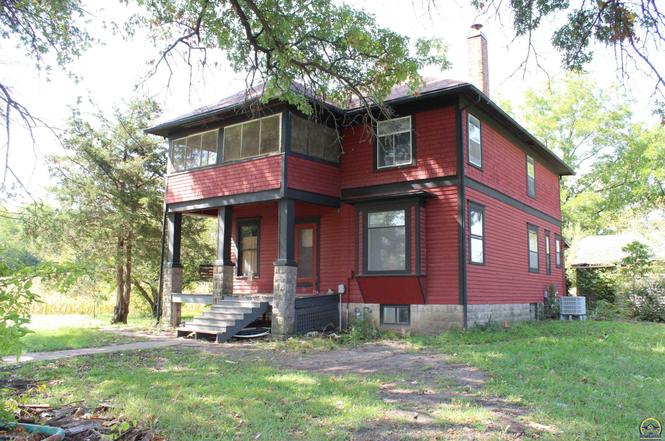
424 N 5th St · Quenemo, KS
Flood risk 1/10 · Minimal
- FEMA flood zone
- X (unshaded)
- Chance of flooding over 30 yrs
- 0.0%
- Est. flood insurance / yr
- $473 – $860
Fire risk 3/10 · Minor
- Est. fire insurance / yr
- $1,154 – $2,142
Heat risk 5/10 · Moderate
- Hot days now (above 108°F)
- 7 days/yr
- Hot days in 30 yrs
- 17 days/yr
Wind risk 2/10 · Minimal
- Chance of severe wind over 30 yrs
- —
Air-quality risk 2/10 · Minimal
- Unhealthy air days now
- 1 days/yr
- Unhealthy air days in 30 yrs
- 1 days/yr
Risk factors via First Street. Map © Google.
Why this score? — see what drove the B- grade
The composite is a weighted blend of 9 inputs, each scored 0–100. Each bar is that input's sub-score; the figure is the points it added to the 100-point composite (weight × sub-score).
- Cash flow +23.5/30.0
- Appreciation +10.0/10.0
- DSCR +7.6/10.0
- ARV discount +7.5/15.0
- 1% rule +6.3/10.0
- Livability +3.1/5.0
- Schools +2.8/10.0
- Rent growth +2.5/5.0
- Condition / age +2.5/5.0
$100,000
🖨 Deal sheet 📄 Offer letter ✓ Due diligence
Listing remarks MLS
Large 2 story with original woodwork, hardwood floors, upstairs sleeping porch. has some older outbuildings. Sits on the north edge of town. Buyer will need preapproval letter or proof of funds. Sold "AS IS "
Key facts
- Replaced roof
- Original woodwork
- Original radiators
Tags
Property features AI
Exterior
- Utilities: Public water; Public sewer
- Home design: Single-family residence; Residential property
- Construction: Frame construction; Composition roof
- Exterior features: Screened patio/porch
Interior
- Flooring: Hardwood
- Bathrooms: 1 full bathroom; 1 half bathroom
- Heating & cooling: Central air conditioning
- Interior features: Hardwood floors; Full, unfinished block basement
- Laundry & utility: Laundry on main level
Neighborhood map
What this means for you Summary
Snapshot
- This is a 3-bed/1.0-bath single-family listed at $100k.
Deal economics
- At list price, monthly cash flow is $187 ($2k/yr) — positive.
- The deal already cash-flows at list — no discount required.
- Meets the 1% rule at list price ($1k rent vs $100k).
- Recommended offer: $88k (12.0% below list) — sets the bar for market timing.
Location & tenants
- Location reads 62/100 on livability (#383 in KS) — a middle-class / working-renter tenant base. Strengths: cost of living A+, health & safety A+, housing A; Watch: employment D, crime F, amenities F.
- Marais Des Cygnes Valley (rural): math 35% / reading 25% proficiency, ranked #173 of 280 in KS (top 62%) — families likely to look elsewhere, expect single-tenant / working-renter base with shorter leases.
- Zoned schools: Marais Des Cygnes Valley Elem (math 54% / reading 54%, grade C, #107 of 684 statewide, top 18%, 91 students, 59% FRL); Marais Des Cygnes Valley Middle (math 15% / reading 24%, grade F, #149 of 219 statewide, top 69%, 38 students, 68% FRL); Marais Des Cygnes Valley High (math 30% / reading 30%, grade F, #57 of 327 statewide, top 17%, 73 students, 52% FRL).
- Market conditions: 13 active listings in the ZIP; 49 units permitted in Osage County in 2024 (0 in 5+ unit buildings).
Forward outlook
- In year one you build about $11k of equity ($691 loan paydown + $10k appreciation (10.0% local appreciation)).
- Osage County population projected at -11% by 2050 — secular population decline; favor cash flow + early exit over multi-decade hold.
- At projected returns (10.0% appreciation + 3.0% rent growth), your $28k cash investment doubles in ~3 years — after that, you're playing with house money.
- By year 4, paydown + projected appreciation supports a ~$38k cash-out refi (75% LTV) — recoverable capital for the next deal without selling this one.
Negotiation context
- It's been on market 267 days — a 12% lower offer ($88k) is reasonable based on typical stale-listing flexibility.
- 5 sale attempts since 21y ago; this cycle's ask has dropped $79k (44%) from the opening price — seller is motivated, your offer sets the floor, not the list.
Risks & watch-outs
- Watch-outs: built in 1906 — expect roof / HVAC / electrical / plumbing capex.
- Climate carrying-cost: extreme-heat days projected 7→17/yr by 2055 (HVAC capex compounding) — expect insurance premiums to compound above CPI over the hold.
Questions for the listing agent
- It's been on market 267 days. Have you received any prior offers? Is the seller open to a 12% concession, seller financing, or rate buy-down credit?
- Built in 1906 — when were the roof, HVAC, electrical panel, plumbing, and water heater last replaced?
- Why hasn't it sold? Are there any deal-killer items the seller is aware of (foundation, flood, title, zoning, code violations)?
- Is there a deadline driving the sale (1031 exchange, divorce, estate, relocation)? That informs how much negotiation room exists.
- Crime grade is F in this area — have there been break-ins, vandalism, or insurance claims at this property in the last 3 years? What carrier currently insures it and at what premium?
- What's the average days-on-market for RENTAL listings here right now (not sales)? A rising rental-DOM trend means longer vacancies and softer asking-rent achievability than the comps imply.
- What's the recent tenant-quality profile in this submarket — average credit score on applications, eviction rate, late-payment / NSF rate, and stable-employment percentage? A property-management company in the area should have these aggregated.
- How much new for-sale + rental construction is in the pipeline within 1–3 miles? Heavy new supply typically softens prices + rents 12–24 months out; constrained supply supports both.
Investment metrics
- 1% rule
- 1.13% ✓
- Cap rate
- 8.54%
- Cash-on-cash
- 8.02%
- DSCR
- 1.36
- GRM
- 7.4
CMA / ARV
No comps found within radius.
Projected returns pro-forma
10.0% appreciation · 3.0% rent growth · sell at horizon
- IRR
- 30.1%
- Equity multiple
- 3.37×
- Total profit
- $66,401
- Equity at exit
- $90,088
- IRR
- 26.1%
- Equity multiple
- 7.65×
- Total profit
- $186,223
- Equity at exit
- $194,278
Cash invested: $28,000 (down + closing). Projections, not guarantees.
Landlord ↔ Tenant lean methodology
- Overall (STATE)
- 83 Strongly Landlord-Friendly
- State Kansas
- 83 Strongly Landlord-Friendly · R+10
- County
- — inherits STATE
- City
- — inherits STATE
ZIP-level market 66528
- Home prices YoY
- 3.7%
- Active inventory
- 13
- Price-to-rent
- 7.4×
Monthly cashflow live
- Estimated rent
- $1,128 medium interval (Pro) →
- Mortgage (P&I)
- −$524
- Tax from tax record
- −$138 /mo · $1,659/yr
- Insurance
- −$42
- HOA
- −$0
- Vacancy / Maint / Mgmt
- −$237
- Net cashflow
- $187
Break-even live
UW: 25.0% down · 7.5% · 30yr · 1.5% tax · 5.0% vac · 8.0% maint · 8.0% mgmt
Financing live
Cash to close
- Down payment
- $25,000
- Closing costs
- $3,000
- Reserves months
- —
- Total cash needed
- —
Loan-product check · same deal, 3 products live
Conventional
25% down · 7.5% · 30yr
- Down + closing
- —
- Monthly P&I
- —
- Monthly cashflow
- —
- DSCR
- —
- Eligible?
- —
Personal DTI + credit; lowest rate.
DSCR
20% down · 8.5% · 30yr
- Down + closing
- —
- Monthly P&I
- —
- Monthly cashflow
- —
- DSCR
- —
- Eligible?
- —
No personal income docs; deal must DSCR.
Hard money
10% down · 12.0% · 12mo
- Down + closing
- —
- Monthly P&I
- —
- Monthly cashflow
- —
- DSCR
- —
- Eligible?
- —
Short-term bridge; refi at stabilization.
Listing history 34 events
-
2026-06-18days on market $100,000 Active 267 DOM
-
2026-06-17days on market $100,000 Active 266 DOM
-
2026-06-16days on market $100,000 Active 265 DOM
-
2026-06-15days on market $100,000 Active 264 DOM
-
2026-06-13days on market $100,000 Active 262 DOM
-
2026-06-12days on market $100,000 Active 261 DOM
-
2026-06-09days on market $100,000 Active 258 DOM
-
2026-06-08days on market $100,000 Active 257 DOM
-
2026-06-07days on market $100,000 Active 256 DOM
-
2026-06-05days on market $100,000 Active 254 DOM
-
2026-06-04days on market $100,000 Active 252 DOM
-
2026-06-02days on market $100,000 Active 251 DOM
-
2026-06-01days on market $100,000 Active 250 DOM
-
2026-05-31days on market $100,000 Active 249 DOM
-
2026-05-31days on market $100,000 Active 248 DOM
-
2026-05-11price $100,000
-
2026-05-04price $110,000
-
2026-04-25status Active
-
2026-04-24historical
-
2026-02-03price $117,000
-
2025-12-19price $125,000
-
2025-12-02price $127,000
-
2025-11-18price $131,000
-
2025-11-07price $139,000
-
2025-10-31price $149,000
-
2025-10-16price $155,000
-
2025-10-10price $169,000
-
2025-09-24$179,000 Active
-
2010-03-15soldstatus 218-char remark
Show marketing remark (218 chars)
Large 2 story with original woodwork, hardwood floors, upstairs sleeping porch. has some older outbuildings. Sits on the north edge of town. Buyer will need preapproval letter or proof of funds. Sold "AS IS "
-
2009-10-30$49,900 218-char remark
Show marketing remark (218 chars)
Large 2 story with original woodwork, hardwood floors, upstairs sleeping porch. has some older outbuildings. Sits on the north edge of town. Buyer will need preapproval letter or proof of funds. Sold "AS IS "
-
2009-06-01historical
-
2009-01-28$79,900
-
2006-03-10soldstatus
-
2005-03-07$85,000
ⓘ Source: listings_history table (triggers on properties + properties_extension) + one-shot
backfill from property_details.listing_events for pre-trigger history.
Tax reassessment forecast KS · Resets to sale price
- Current annual tax
- $1,659 · $138/mo
- Projected year-2 tax
- $1,659 · $138/mo
- Expected delta
- $0/yr ($0/mo · 0.0%)
ⓘ Screening estimate from a state-policy table — verify with the county assessor before closing.
Climate risk First Street
- Flood 1/10 Low FEMA zone X (unshaded) · 0% chance over 30 yrs
- Wildfire 3/10 Moderate
- Heat 5/10 Major 7 d/yr ≥108°F today · 17 d/yr by 30 yrs out
- Wind 2/10 Low
- Air quality 2/10 Low 1 unhealthy d/yr today · 1 by 30 yrs out
Nearby sold comps map
Loading sold comps map…
Walkable amenities ~0.75 mi
Loading nearby amenities…
Taxation est. · year 1
- Rental income
- $13,540
- − Mortgage interest
- −$5,602
- − Property taxes
- −$1,659
- − Insurance
- −$500
- − Repairs & maintenance
- −$1,083
- − Management
- −$1,083
- − Depreciation
- −$2,909
- Taxable income
- $704
- Est. tax owed @ 24.0%
- −$169
- After-tax cash flow
- $2,076/yr
For passive investors: Depreciation is non-cash, so a rental often shows a tax loss while cash-flowing — sheltering income. Rental losses are passive: they offset passive income freely, and up to $25,000/yr can offset ordinary (W-2) income if you actively participate and your MAGI is under $100k (phasing out to $0 by $150k); unused losses carry forward. On sale, claimed depreciation is recaptured at up to 25%, and gains may owe capital-gains tax (a 1031 exchange can defer both). Figures are a year-1 estimate at your 24.0% rate — not tax advice; consult a CPA.
Schools (NCES district)
- District
- Marais Des Cygnes Valley
- NCES district ID
- 2009480
- Math proficiency
- 35% ▼ -20.00%
- Reading proficiency
- 25% ▼ -20.00%
- Median HH income
- $41,267
- Composite
- 28.22/100
- National rank
- #12177
- State rank
- #173 of 280 in KS
Livability — Quenemo
- Score
- 62/100
- State rank
- #383
- US rank
- #16988
Category grades
Schools grade is shown separately in the Schools card above.
Census & demographics
- Census place
- Quenemo, KS
- Population (ZIP)
- 876
Population outlook (Osage County) Hauer SSP2
- Today (2025)
- 15,418 people
- By 2030
- 15,072 · -2.2%
- By 2040
- 14,339 · -7.0%
- By 2050
- 13,708 · -11.1%
- By 2075
- 13,221 · -14.2%
- By 2100
- 12,915 · -16.2%
Race, ethnicity, and origin ACS 2023
- Neighborhood character
- Predominantly White (92%)
- Race & ethnicity
- White 92% Black 3% Hispanic / Latino 3% Two or more races 3%
- Common ancestry
- Italian 17% Lithuanian 1%
- Languages at home
- 98% English-only · German/W. Germanic 2%
Political lean MEDSL · Osage
- 2024 margin
- Solid R (+48.0) · D 24.7% · R 72.7% · Other 2.7%
- 2008→2024 swing
- -17.7pp toward R · 2008: -30.3pp · 2024: -48.0pp
- All cycles
- 2024: R+48.0 2020: R+44.2 2016: R+43.3 2012: R+31.1 2008: R+30.3
Not yet ingested
- Civics
- —
Market trends
- HPI YoY
- ▲ 10.42%
- Current HPI
- 288.9546
- Rent YoY
- —
- Metro
- —
- State GDP YoY
- —
- F500 in state
- 0
Price history
+17.6% since first listed19 events — show timeline
- 2026-05-11 Price Changed $100,000 Sunflower MLS as distributed by MLS GRID
- 2026-05-04 Price Changed $110,000 Sunflower MLS as distributed by MLS GRID
- 2026-04-25 Relisted — Sunflower MLS as distributed by MLS GRID
- 2026-04-24 Delisted — Sunflower MLS as distributed by MLS GRID
- 2026-02-03 Price Changed $117,000 Sunflower MLS as distributed by MLS GRID
- 2025-12-19 Price Changed $125,000 Sunflower MLS as distributed by MLS GRID
- 2025-12-02 Price Changed $127,000 Sunflower MLS as distributed by MLS GRID
- 2025-11-18 Price Changed $131,000 Sunflower MLS as distributed by MLS GRID
- 2025-11-07 Price Changed $139,000 Sunflower MLS as distributed by MLS GRID
- 2025-10-31 Price Changed $149,000 Sunflower MLS as distributed by MLS GRID
- 2025-10-16 Price Changed $155,000 Sunflower MLS as distributed by MLS GRID
- 2025-10-10 Price Changed $169,000 Sunflower MLS as distributed by MLS GRID
- 2025-09-24 Listed $179,000 Sunflower MLS as distributed by MLS GRID
- 2010-03-15 Sold (MLS) — Heartland MLS as Distributed by MLS Grid
- 2009-10-30 Listed $49,900 Heartland MLS as Distributed by MLS Grid
- 2009-06-01 Listing Removed — Heartland MLS as Distributed by MLS Grid
- 2009-01-28 Listed $79,900 Heartland MLS as Distributed by MLS Grid
- 2006-03-10 Sold (MLS) — Heartland MLS as Distributed by MLS Grid
- 2005-03-07 Listed $85,000 Heartland MLS as Distributed by MLS Grid
Property tax history
+4.4%/yrLatest (2025): $1,659 · -5.8% YoY. Source: county tax records.
Cash-flow waterfall
monthlySold comps — $/sqft
last 12 mo · ≤1 miLoading sold comps…