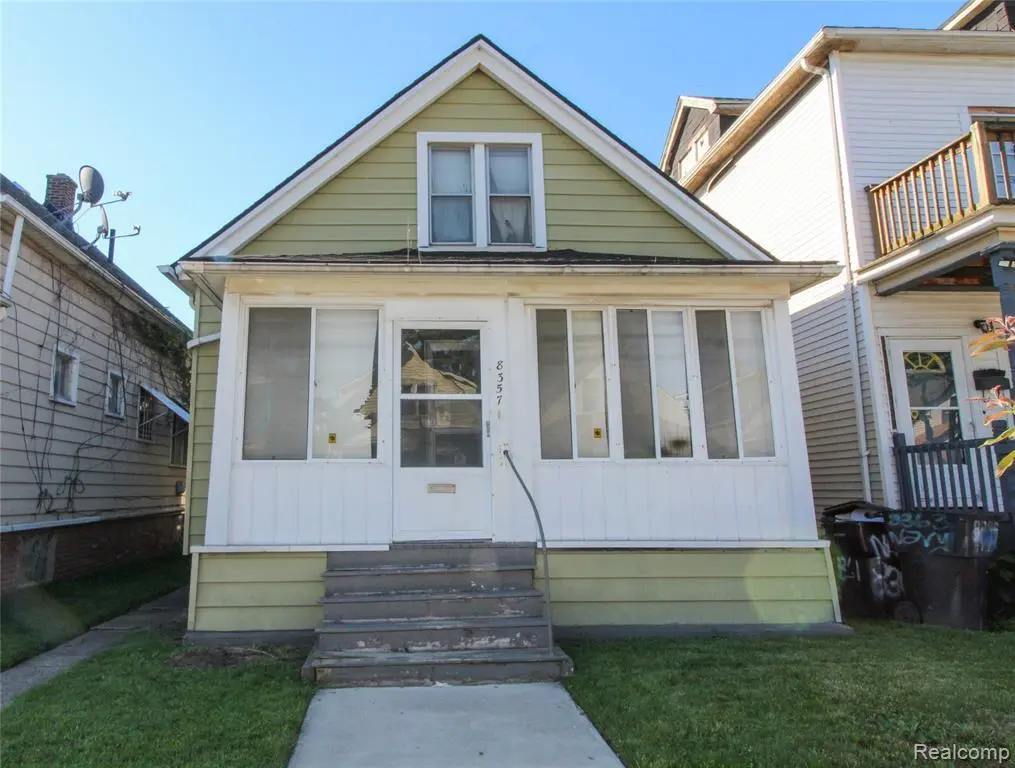
8357 Navy St · Detroit, MI
Flood risk 1/10 · Minimal
- FEMA flood zone
- X (unshaded)
- Chance of flooding over 30 yrs
- 0.0%
- Est. flood insurance / yr
- $473 – $860
Fire risk 1/10 · Minimal
- Est. fire insurance / yr
- $784 – $1,456
Heat risk 3/10 · Minor
- Hot days now (above 95°F)
- 7 days/yr
- Hot days in 30 yrs
- 15 days/yr
Wind risk 2/10 · Minimal
- Chance of severe wind over 30 yrs
- —
Air-quality risk 4/10 · Minor
- Unhealthy air days now
- 6 days/yr
- Unhealthy air days in 30 yrs
- 8 days/yr
Risk factors via First Street. Map © Google.
Why this score? — see what drove the C grade
The composite is a weighted blend of 9 inputs, each scored 0–100. Each bar is that input's sub-score; the figure is the points it added to the 100-point composite (weight × sub-score).
- Cash flow +17.7/30.0
- Appreciation +10.0/10.0
- ARV discount +9.1/15.0
- DSCR +5.5/10.0
- 1% rule +4.5/10.0
- Livability +3.7/5.0
- Rent growth +2.5/5.0
- Condition / age +2.5/5.0
- Schools +1.3/10.0
$130,000
🖨 Deal sheet 📄 Offer letter ✓ Due diligence
Listing remarks
Great investment opportunity in the highly desirable Southwest Detroit area! This 3-bedroom, 1-bath home offers strong potential for investors, rehabbers, or buyers looking to add value. Property needs repairs and is being sold as-is. Conveniently located near schools, parks, shopping, restaurants, and major freeways. Don't miss your chance to own in one of Detroit's most sought-after neighborhoods. Subject to probate court approval.
Key facts
- Near schools
- Near shopping
- Near restaurants
Tags
Property features AI
Exterior
- Parking: Detached garage (18 x 18) — 1 parking space
- Utilities: Natural gas heating fuel; Electric water heater; Public water at street
- Home design: Residential 2-story; Built in 1914; Basement present
- Construction: Aluminum and brick exterior; Basement foundation
- Exterior features: Porch; Paved street access
Interior
- Bedrooms: Bedroom 1 (Second level) — 14 x 10, wood flooring; Bedroom 2 (Entry level) — 10 x 9, wood flooring; Bedroom 3 (Entry level) — approx. 9' wide, wood flooring
- Flooring: Wood flooring in bedrooms
- Bathrooms: 1 full bathroom (Entry level) — approximately 10 x 10
- Heating & cooling: Forced air heating; Window air conditioning units
- Interior features: Total of 4 rooms; Unfinished basement
Neighborhood map
What this means for you Summary
Snapshot
- This is a 3-bed/1.0-bath single-family listed at $130k.
Deal economics
- At list price, monthly cash flow is $104 ($1k/yr) — positive.
- The deal already cash-flows at list — no discount required.
- To meet the 1% rule (rent ≥ 1% of price), the offer needs to be $123k (5.3% below list).
- Recommended offer: $123k (5.3% below list) — sets the bar for 1% rule.
- Cap rate 7.3% vs local median 10.2% in Detroit — below-typical yield; the buyer is paying a premium for something (appreciation thesis, condition, location) that the cap rate doesn't capture.
Location & tenants
- Location reads 73/100 on livability (#218 in MI) — a middle-class / working-renter tenant base. Strengths: amenities A+, commute A+, cost of living A+; Watch: schools F, crime F, employment F.
- Detroit Public Schools Community District (urban): math 10% / reading 24% proficiency, ranked #499 of 540 in MI (top 92%) — low school quality limits family demand, transient renter base, plan for 1-2y turnover; 90% free/reduced lunch — lower-income household profile, screen leases tightly.
- Market conditions: 66 active listings in the ZIP; 6 comparable units currently listed for rent nearby; rentals lingering (median 44d on market — plan ~5-8 weeks vacancy on turnover, expect pricing pressure); 67% of comp listings sitting > 30 days — soft ceiling on asking rent; lower-income renter base — watch delinquency; 2,639 units permitted in Wayne County in 2024 (1,216 in 5+ unit buildings).
- This rent runs 34% of the median local income ($43k/yr) — at the standard rent-burdened threshold; future hikes will face affordability resistance.
Forward outlook
- In year one you build about $14k of equity ($899 loan paydown + $13k appreciation (10.0% local appreciation)).
- Wayne County population projected at -17% by 2050 — secular population decline; favor cash flow + early exit over multi-decade hold.
- At projected returns (10.0% appreciation + 3.0% rent growth), your $36k cash investment doubles in ~3 years — after that, you're playing with house money.
- By year 3, paydown + projected appreciation supports a ~$35k cash-out refi (75% LTV) — recoverable capital for the next deal without selling this one.
Negotiation context
- Only 4 days on market — expect competitive offers; lowballing is unlikely to land.
- Current owner paid $17k; list at $130k implies a 665% gain — meaningful room to come down on a strong offer.
Risks & watch-outs
- Watch-outs: built in 1914 — expect roof / HVAC / electrical / plumbing capex.
Questions for the listing agent
- Built in 1914 — when were the roof, HVAC, electrical panel, plumbing, and water heater last replaced?
- Is there a deadline driving the sale (1031 exchange, divorce, estate, relocation)? That informs how much negotiation room exists.
- Schools are F-rated, which usually means shorter tenancies and higher turnover. Who's the typical renter profile here, and what's been the actual vacancy rate?
- Crime grade is F in this area — have there been break-ins, vandalism, or insurance claims at this property in the last 3 years? What carrier currently insures it and at what premium?
- What's the average days-on-market for RENTAL listings here right now (not sales)? A rising rental-DOM trend means longer vacancies and softer asking-rent achievability than the comps imply.
- What's the recent tenant-quality profile in this submarket — average credit score on applications, eviction rate, late-payment / NSF rate, and stable-employment percentage? A property-management company in the area should have these aggregated.
- How much new for-sale + rental construction is in the pipeline within 1–3 miles? Heavy new supply typically softens prices + rents 12–24 months out; constrained supply supports both.
Investment metrics
- 1% rule
- 0.95% ✗
- Cap rate
- 7.26%
- Cash-on-cash
- 3.44%
- DSCR
- 1.15
- GRM
- 8.8
CMA / ARV
- ARV (on-the-fly)
- $134,865
- Comps found
- 10
Show comp detail 10 sales within ~0.75 mi
| Address | Dist | Beds/Ba | Sqft | Sold | Price | $/sf | Match |
|---|---|---|---|---|---|---|---|
| 7821 Navy St | 0.25mi | 3/2.0 | 1,000 (+0%) | 3mo | $135,000 | $135 | 82 |
| 2627 Casper St | 0.53mi | 4/1.0 (+1) | 985 (-1%) | 0mo | $135,000 | $137 | 68 |
| 2627 Casper St | 0.53mi | 4/1.0 (+1) | 985 (-1%) | 0mo | $135,000 | $137 | 68 |
| 2844 Woodmere St | 0.53mi | 2/1.0 (-1) | 1,000 (+0%) | 8mo | $155,000 | $155 | 64 |
| 8850 Lane St | 0.29mi | 2/1.0 (-1) | 880 (-12%) | 0mo | $60,000 | $68 | 61 |
| 2713 Casper St | 0.57mi | 3/1.0 | 1,100 (+10%) | 9mo | $125,000 | $114 | 49 |
| 9242 Lafayette Blvd | 0.65mi | 2/1.0 (-1) | 982 (-2%) | 17mo | $71,000 | $72 | 48 |
| 1650 Evans St | 0.29mi | 2/1.0 (-1) | 1,148 (+15%) | 16mo | $110,000 | $96 | 43 |
| 7063 Chatfield St | 0.68mi | 2/1.0 (-1) | 1,108 (+11%) | 5mo | $170,000 | $153 | 41 |
| 2321 Casper St | 0.35mi | 4/1.0 (+1) | 1,144 (+14%) | 20mo | $110,000 | $96 | 38 |
Match score weights: distance 35% · size 25% · config 20% · recency 20%. Top-matched comps best support the ARV.
Projected returns pro-forma
10.0% appreciation · 3.0% rent growth · sell at horizon
- IRR
- 26.8%
- Equity multiple
- 3.13×
- Total profit
- $77,453
- Equity at exit
- $117,114
- IRR
- 23.4%
- Equity multiple
- 7.12×
- Total profit
- $222,855
- Equity at exit
- $252,561
Cash invested: $36,400 (down + closing). Projections, not guarantees.
Landlord ↔ Tenant lean methodology
- Overall (STATE)
- 62 Landlord-Friendly
- State Michigan
- 62 Landlord-Friendly · EVEN
- County
- — inherits STATE
- City
- — inherits STATE
ZIP-level market 48209
- Home prices YoY
- 21.8%
- Active inventory
- 66
- Price-to-rent
- 8.8×
Monthly cashflow live
- Estimated rent
- $1,231 high interval (Pro) →
- Mortgage (P&I)
- −$682
- Tax from tax record
- −$132 /mo · $1,585/yr
- Insurance
- −$54
- HOA
- −$0
- Vacancy / Maint / Mgmt
- −$258
- Net cashflow
- $104
Break-even live
UW: 25.0% down · 7.5% · 30yr · 1.5% tax · 5.0% vac · 8.0% maint · 8.0% mgmt
Financing live
Cash to close
- Down payment
- $32,500
- Closing costs
- $3,900
- Reserves months
- —
- Total cash needed
- —
Loan-product check · same deal, 3 products live
Conventional
25% down · 7.5% · 30yr
- Down + closing
- —
- Monthly P&I
- —
- Monthly cashflow
- —
- DSCR
- —
- Eligible?
- —
Personal DTI + credit; lowest rate.
DSCR
20% down · 8.5% · 30yr
- Down + closing
- —
- Monthly P&I
- —
- Monthly cashflow
- —
- DSCR
- —
- Eligible?
- —
No personal income docs; deal must DSCR.
Hard money
10% down · 12.0% · 12mo
- Down + closing
- —
- Monthly P&I
- —
- Monthly cashflow
- —
- DSCR
- —
- Eligible?
- —
Short-term bridge; refi at stabilization.
Rent comps 6 comps
| Address | Beds | Baths | Sqft | Rent | $/sqft | DOM | Units | Dist |
|---|---|---|---|---|---|---|---|---|
| 2508 Inglis St Detroit, MI | 2.0 | 1.0 | 750 | $1,100 | $1.47 | 24d | 1 | 0.35mi |
| 2488 Woodmere St Detroit, MI | 3.0 | 1.0 | 1000 | $1,453 | $1.45 | 4d | 1 | 0.38mi |
| 7263 Senator St Detroit, MI | 2.0 | 1.0 | 909 | $1,300 | $1.43 | 43d | 1 | 0.48mi |
| 764 Woodmere St Apt 8 Detroit, MI | 2.0 | 1.0 | 990 | $1,100 | $1.11 | 43d | 1 | 0.79mi |
| 6720 Regular St Unit 6724 Detroit, MI | 2.0 | 1.0 | 750 | $950 | $1.27 | 43d | 1 | 0.84mi |
| 6628 W Lafayette Blvd Detroit, MI | 2.0 | 1.0 | 900 | $965 | $1.07 | 43d | 1 | 1.02mi |
Listing history 7 events
-
2026-06-18days on market $130,000 Active 4 DOM
-
2026-06-17days on market $130,000 Active 3 DOM
-
2026-06-16days on market $130,000 Active 2 DOM
-
2026-06-15days on market $130,000 Active 1 DOM
-
2026-06-15days on market $130,000 Active 3 DOM
-
2026-06-13remarks 437-char remark
-
2026-06-13$130,000 Active 1 DOM
ⓘ Source: listings_history table (triggers on properties + properties_extension) + one-shot
backfill from property_details.listing_events for pre-trigger history.
Tax reassessment forecast MI · Partial reset (capped growth)
- Current annual tax
- $1,585 · $132/mo
- Projected year-2 tax
- $1,793 · $149/mo
- Expected delta
- +$209/yr (+$17/mo · 13.2%)
ⓘ Screening estimate from a state-policy table — verify with the county assessor before closing.
Climate risk First Street
- Flood 1/10 Low FEMA zone X (unshaded) · 0% chance over 30 yrs
- Wildfire 1/10 Low
- Heat 3/10 Moderate 7 d/yr ≥95°F today · 15 d/yr by 30 yrs out
- Wind 2/10 Low
- Air quality 4/10 Moderate 6 unhealthy d/yr today · 8 by 30 yrs out
Nearby sold comps map
Loading sold comps map…
Walkable amenities ~0.75 mi
Loading nearby amenities…
Taxation est. · year 1
- Rental income
- $14,771
- − Mortgage interest
- −$7,282
- − Property taxes
- −$1,585
- − Insurance
- −$650
- − Repairs & maintenance
- −$1,182
- − Management
- −$1,182
- − Depreciation
- −$3,782
- Taxable loss
- −$891
- Est. tax savings @ 24.0%
- +$214
- After-tax cash flow
- $1,467/yr
For passive investors: Depreciation is non-cash, so a rental often shows a tax loss while cash-flowing — sheltering income. Rental losses are passive: they offset passive income freely, and up to $25,000/yr can offset ordinary (W-2) income if you actively participate and your MAGI is under $100k (phasing out to $0 by $150k); unused losses carry forward. On sale, claimed depreciation is recaptured at up to 25%, and gains may owe capital-gains tax (a 1031 exchange can defer both). Figures are a year-1 estimate at your 24.0% rate — not tax advice; consult a CPA.
Schools (NCES district)
- District
- Detroit Public Schools Community District
- NCES district ID
- 2601103
- Math proficiency
- 10% ▼ -2.00%
- Reading proficiency
- 24% ▲ 6.00%
- Median HH income
- $25,815
- Composite
- 13.06/100
- National rank
- #9564
- State rank
- #499 of 540 in MI
Livability — Detroit
- Score
- 73/100
- State rank
- #218
- US rank
- #5427
Category grades
Schools grade is shown separately in the Schools card above.
Census & demographics
- Census place
- Detroit, MI
- County
- Wayne County · 1,562,939 people
- City population
- 572,865
- Metro
- Detroit-Warren-Dearborn, MI
- Population (ZIP)
- 27,184
- Household income
- $43,161
- Rent vs Own
- Severe rent burden
- 831.0
Population outlook (Wayne County) Hauer SSP2
- Today (2025)
- 1,675,273 people
- By 2030
- 1,620,300 · -3.3%
- By 2040
- 1,502,341 · -10.3%
- By 2050
- 1,384,039 · -17.4%
- By 2075
- 1,124,592 · -32.9%
- By 2100
- 881,193 · -47.4%
Race, ethnicity, and origin ACS 2023
- Neighborhood character
- Predominantly Hispanic (76%)
- Race & ethnicity
- Hispanic / Latino 76% White 17% Two or more races 14% Black 6% Native American 2%
- Hispanic origin (detail)
- Mexican 58% Puerto Rican 7% Cuban 1%
- Common ancestry
- Romanian 2% Lithuanian 0%
- Foreign-born
- 26% · Canada
- Languages at home
- 38% English-only · Spanish 62%
Political lean MEDSL · Wayne
- 2024 margin
- Strong D (+29.0) · D 62.7% · R 33.7% · Other 3.6%
- 2008→2024 swing
- -20.5pp toward R · 2008: 49.5pp · 2024: 29.0pp
- All cycles
- 2024: D+29.0 2020: D+38.1 2016: D+37.3 2012: D+46.9 2008: D+49.5
Not yet ingested
- Civics
- —
Market trends
- HPI YoY
- ▲ 73.77%
- Current HPI
- 412.9753
- Rent YoY
- —
- Metro
- Detroit-Warren-Dearborn, MI
- State GDP YoY
- ▲ 1.37%
- F500 in state
- 28
Industry mix (Fortune 500 HQ in MI)
| Industry | F500 HQs | Revenue |
|---|---|---|
| Automotive Parts | 3 | $48B |
|
||
| Automotive | 2 | $372B |
|
||
| Chemicals | 1 | $45B |
|
||
| Automotive Retail | 1 | $29B |
|
||
| Healthcare / Medical Devices | 1 | $23B |
|
||
| Automotive Technology | 1 | $20B |
|
||
Price history
+664.7% since first listed2 events — show timeline
- 2026-06-11 Listed $130,000 MiRealSource-MiMLS
- 1991-10-29 Sold (Public Records) $17,000 Public Records
Property tax history
+5.7%/yrLatest (2025): $1,585 · -11.5% YoY. Source: county tax records.
Cash-flow waterfall
monthlySold comps — $/sqft
last 12 mo · ≤1 miLoading sold comps…