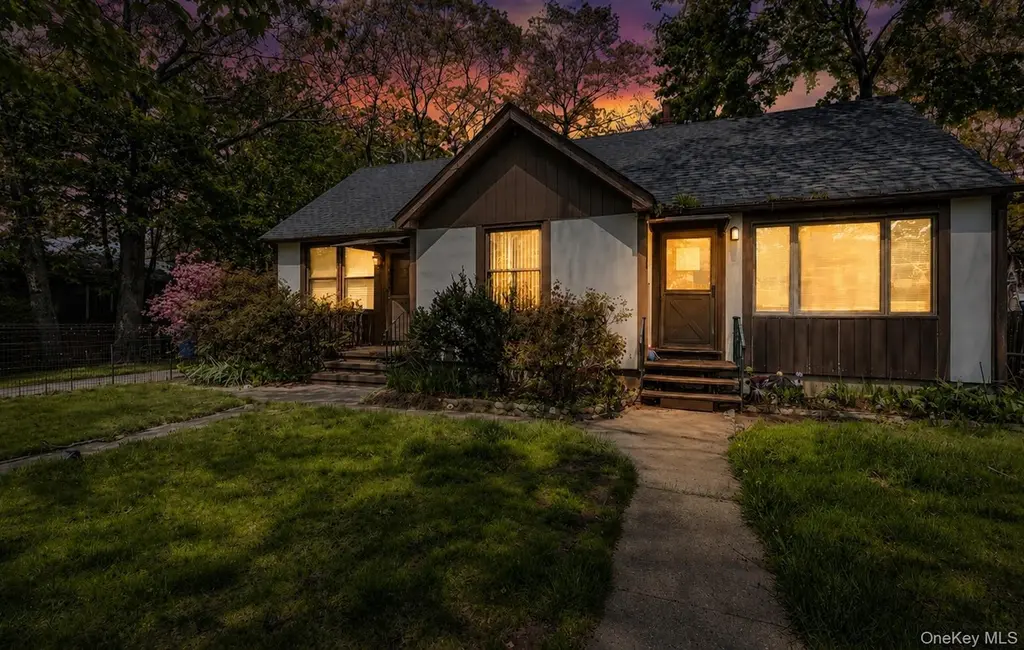
11 1st Pl · Mastic, NY
Flood risk 1/10 · Minimal
- FEMA flood zone
- X (unshaded)
- Chance of flooding over 30 yrs
- 0.0%
- Est. flood insurance / yr
- $473 – $860
Fire risk 1/10 · Minimal
- Est. fire insurance / yr
- $691 – $1,283
Heat risk 5/10 · Moderate
- Hot days now (above 91°F)
- 7 days/yr
- Hot days in 30 yrs
- 20 days/yr
Wind risk 8/10 · Major
- Chance of severe wind over 30 yrs
- 80.0%
Air-quality risk 4/10 · Minor
- Unhealthy air days now
- 3 days/yr
- Unhealthy air days in 30 yrs
- 5 days/yr
Risk factors via First Street. Map © Google.
Why this score? — see what drove the D+ grade
The composite is a weighted blend of 9 inputs, each scored 0–100. Each bar is that input's sub-score; the figure is the points it added to the 100-point composite (weight × sub-score).
- ARV discount +15.0/15.0
- Cash flow +13.5/30.0
- Schools +4.7/10.0
- DSCR +4.1/10.0
- 1% rule +3.9/10.0
- Livability +3.2/5.0
- Rent growth +2.5/5.0
- Condition / age +2.5/5.0
- Appreciation +0.0/10.0
$425,000
🖨 Deal sheet 📄 Offer letter ✓ Due diligence
Listing remarks
If you’ve been searching for a home with space, potential, and the chance to truly make it your own, this is the opportunity you’ve been waiting for. Tucked away on a small, quiet block, this home offers incredible possibilities for the right buyer with vision and a little elbow grease. Inside, you’ll find a flexible layout that could work beautifully for multi-generational living, with the potential for an accessory apartment on the first floor with proper permits. Whether you need extra space for extended household members, guests, or future possibilities, the setup here opens the door to so many options. Yes, the home does need updating, but the potential is undeniable.
Key facts
- Flexible layout
- Accessory apartment
- 0.23 acre lot
Tags
Property features AI
Exterior
- Parking: Driveway; No carport
- Utilities: Electricity connected; Water connected; Cesspool sewer
- Home design: Single family residence
- Construction: Frame construction
- Exterior features: Frame construction; Not waterfront
Interior
- Kitchen: Electric range; Eat-in kitchen
- Bedrooms: Bedroom on the first floor
- Bathrooms: 3 full bathrooms
- Heating & cooling: Oil heating; No central air
- Interior features: First-floor bedroom; First-floor full bathroom; Eat-in kitchen; 9 total rooms; Attic (see remarks); Basement (see remarks)
- Laundry & utility: Basement utilities (see remarks)
Neighborhood map
What this means for you Summary
Snapshot
- This is a 5-bed/3.0-bath single-family listed at $425k.
Deal economics
- At list price, monthly cash flow is $17 ($203/yr) — positive.
- The deal already cash-flows at list — no discount required.
- To meet the 1% rule (rent ≥ 1% of price), the offer needs to be $380k (10.6% below list).
- Recommended offer: $380k (10.6% below list) — sets the bar for 1% rule.
- Cap rate 6.3% vs local median 4.7% in Mastic — top-decile yield for the area; either an underpriced asset or a hidden risk that comps aren't pricing in. Stress-test before assuming the spread holds.
Location & tenants
- Location reads 63/100 on livability (#816 in NY) — a middle-class / working-renter tenant base. Strengths: employment A+, housing A+, health & safety B; Watch: crime D, amenities F, commute F.
- William Floyd Union Free School District (suburban): math 48% / reading 57% proficiency, ranked #309 of 590 in NY (top 52%) — acceptable for families but not a draw, mixed tenant base, ~2y average lease.
- Zoned schools: Moriches Elementary School (math 52% / reading 57%, grade C, #908 of 2,108 statewide, top 46%, 822 students, 57% FRL); William Floyd Middle School (math 36% / reading 47%, grade F, #394 of 729 statewide, top 55%, 1,053 students, 54% FRL); William Floyd High School (math 65% / reading 87%, grade A-, #616 of 1,100 statewide, top 57%, 3,013 students, 54% FRL).
- Market conditions: 100 active listings in the ZIP; 1 comparable units currently listed for rent nearby; 1,366 units permitted in Suffolk County in 2024 (216 in 5+ unit buildings).
Forward outlook
- Local home prices are declining (-3.0%/yr); year-one equity from $3k of loan paydown is wiped out by about $13k of value loss. Plan a longer hold.
- Suffolk County population projected to shrink 5% by 2050 — rents likely to lag national; underwrite the cash flow, not the appreciation.
Negotiation context
- It's been on market 20 days — a 2% lower offer ($419k) is reasonable based on typical stale-listing flexibility.
- Current owner paid $85k; list at $425k implies a 400% gain — meaningful room to come down on a strong offer.
Risks & watch-outs
- Watch-outs: built in 1950 — expect roof / HVAC / electrical / plumbing capex.
- Climate carrying-cost: severe wind risk, 80% chance of damaging wind over 30y; extreme-heat days projected 7→20/yr by 2055 (HVAC capex compounding) — expect insurance premiums to compound above CPI over the hold.
Questions for the listing agent
- Built in 1950 — when were the roof, HVAC, electrical panel, plumbing, and water heater last replaced?
- Is there a deadline driving the sale (1031 exchange, divorce, estate, relocation)? That informs how much negotiation room exists.
- Schools are F-rated, which usually means shorter tenancies and higher turnover. Who's the typical renter profile here, and what's been the actual vacancy rate?
- Crime grade is D in this area — have there been break-ins, vandalism, or insurance claims at this property in the last 3 years? What carrier currently insures it and at what premium?
- The area grade is low — what's the realistic commute time and amenity access for the typical tenant pool here? Any planned neighborhood developments (good or bad) we should know about?
- What's the average days-on-market for RENTAL listings here right now (not sales)? A rising rental-DOM trend means longer vacancies and softer asking-rent achievability than the comps imply.
- What's the recent tenant-quality profile in this submarket — average credit score on applications, eviction rate, late-payment / NSF rate, and stable-employment percentage? A property-management company in the area should have these aggregated.
- How much new for-sale + rental construction is in the pipeline within 1–3 miles? Heavy new supply typically softens prices + rents 12–24 months out; constrained supply supports both.
Investment metrics
- 1% rule
- 0.89% ✗
- Cap rate
- 6.34%
- Cash-on-cash
- 0.17%
- DSCR
- 1.01
- GRM
- 9.3
CMA / ARV
- ARV (on-the-fly)
- $602,910
- Comps found
- 11
Show comp detail 11 sales within ~0.75 mi
| Address | Dist | Beds/Ba | Sqft | Sold | Price | $/sf | Match |
|---|---|---|---|---|---|---|---|
| 17 Lee Pl | 0.06mi | 5/2.0 | 1,900 (-6%) | 9mo | $442,000 | $233 | 75 |
| 87 Lambert Ave | 0.41mi | 5/3.5 | 1,981 (-2%) | 9mo | $730,000 | $369 | 67 |
| 12 Lafayette Ave | 0.46mi | 4/3.0 (-1) | 2,051 (+1%) | 7mo | $610,000 | $297 | 66 |
| 96 Patchogue Ave | 0.46mi | 6/2.0 (+1) | 2,000 (-2%) | 10mo | $600,000 | $300 | 58 |
| 194 Moriches Ave | 0.64mi | 5/2.0 | 2,064 (+2%) | 7mo | $520,000 | $252 | 58 |
| 19 Hawthorne St | 0.31mi | 4/2.0 (-1) | 1,776 (-12%) | 0mo | $455,000 | $256 | 55 |
| 11 Bonny Dr | 0.42mi | 6/3.0 (+1) | 2,281 (+12%) | 8mo | $585,000 | $256 | 48 |
| 123 Patchogue Ave | 0.40mi | 4/2.0 (-1) | 1,728 (-15%) | 7mo | $590,000 | $341 | 42 |
| 107 Shinnecock Ave | 0.65mi | 4/2.0 (-1) | 1,755 (-14%) | 4mo | $600,000 | $342 | 34 |
| 116 Fulton Ave | 0.64mi | 5/2.0 | 2,200 (+8%) | 23mo | $570,000 | $259 | 33 |
| 102 Washington Ave | 0.65mi | 4/2.5 (-1) | 1,804 (-11%) | 14mo | $640,000 | $355 | 32 |
Match score weights: distance 35% · size 25% · config 20% · recency 20%. Top-matched comps best support the ARV.
Projected returns pro-forma
-3.0% appreciation · 3.0% rent growth · sell at horizon
- IRR
- -16.0%
- Equity multiple
- 0.43×
- Total profit
- $-67,702
- Equity at exit
- $63,369
- IRR
- -7.6%
- Equity multiple
- 0.52×
- Total profit
- $-57,212
- Equity at exit
- $36,746
Cash invested: $119,000 (down + closing). Projections, not guarantees.
Landlord ↔ Tenant lean methodology
- Overall (STATE)
- 15 Strongly Tenant-Friendly
- State New York
- 15 Strongly Tenant-Friendly · D+10
- County
- — inherits STATE
- City
- — inherits STATE
ZIP-level market 11950
- Home prices YoY
- -33.2%
- Active inventory
- 100
- Price-to-rent
- 9.3×
Monthly cashflow live
- Estimated rent
- $3,800 medium interval (Pro) →
- Mortgage (P&I)
- −$2,229
- Tax from tax record
- −$579 /mo · $6,951/yr
- Insurance
- −$177
- HOA
- −$0
- Vacancy / Maint / Mgmt
- −$798
- Net cashflow
- $17
Break-even live
UW: 25.0% down · 7.5% · 30yr · 1.5% tax · 5.0% vac · 8.0% maint · 8.0% mgmt
Financing live
Cash to close
- Down payment
- $106,250
- Closing costs
- $12,750
- Reserves months
- —
- Total cash needed
- —
Loan-product check · same deal, 3 products live
Conventional
25% down · 7.5% · 30yr
- Down + closing
- —
- Monthly P&I
- —
- Monthly cashflow
- —
- DSCR
- —
- Eligible?
- —
Personal DTI + credit; lowest rate.
DSCR
20% down · 8.5% · 30yr
- Down + closing
- —
- Monthly P&I
- —
- Monthly cashflow
- —
- DSCR
- —
- Eligible?
- —
No personal income docs; deal must DSCR.
Hard money
10% down · 12.0% · 12mo
- Down + closing
- —
- Monthly P&I
- —
- Monthly cashflow
- —
- DSCR
- —
- Eligible?
- —
Short-term bridge; refi at stabilization.
Rent comps 1 comps
| Address | Beds | Baths | Sqft | Rent | $/sqft | DOM | Units | Dist |
|---|---|---|---|---|---|---|---|---|
| 14 Titmus Dr Mastic, NY | 4.0 | 1.0 | 1428 | $3,800 | $2.66 | 43d | 1 | 0.33mi |
Listing history 9 events
-
2026-06-08status $425,000 Pending 20 DOM
-
2026-06-07days on market $425,000 Active 20 DOM
-
2026-06-04days on market $425,000 Active 17 DOM
-
2026-06-03days on market $425,000 Active 16 DOM
-
2026-06-02days on market $425,000 Active 15 DOM
-
2026-06-01days on market $425,000 Active 14 DOM
-
2026-05-31days on market $425,000 Active 13 DOM
-
2026-04-28$425,000 Active
-
1989-12-19soldstatus $85,000
ⓘ Source: listings_history table (triggers on properties + properties_extension) + one-shot
backfill from property_details.listing_events for pre-trigger history.
Tax reassessment forecast NY · Partial reset (capped growth)
- Current annual tax
- $6,951 · $579/mo
- Projected year-2 tax
- $7,067 · $589/mo
- Expected delta
- +$116/yr (+$10/mo · 1.7%)
ⓘ Screening estimate from a state-policy table — verify with the county assessor before closing.
Climate risk First Street
- Flood 1/10 Low FEMA zone X (unshaded) · 0% chance over 30 yrs
- Wildfire 1/10 Low
- Heat 5/10 Major 7 d/yr ≥91°F today · 20 d/yr by 30 yrs out
- Wind 8/10 Severe 80% chance of damaging wind over 30 yrs
- Air quality 4/10 Moderate 3 unhealthy d/yr today · 5 by 30 yrs out
Nearby sold comps map
Loading sold comps map…
Walkable amenities ~0.75 mi
Loading nearby amenities…
Taxation est. · year 1
- Rental income
- $45,600
- − Mortgage interest
- −$23,807
- − Property taxes
- −$6,951
- − Insurance
- −$2,125
- − Repairs & maintenance
- −$3,648
- − Management
- −$3,648
- − Depreciation
- −$12,364
- Taxable loss
- −$6,942
- Est. tax savings @ 24.0%
- +$1,666
- After-tax cash flow
- $1,869/yr
For passive investors: Depreciation is non-cash, so a rental often shows a tax loss while cash-flowing — sheltering income. Rental losses are passive: they offset passive income freely, and up to $25,000/yr can offset ordinary (W-2) income if you actively participate and your MAGI is under $100k (phasing out to $0 by $150k); unused losses carry forward. On sale, claimed depreciation is recaptured at up to 25%, and gains may owe capital-gains tax (a 1031 exchange can defer both). Figures are a year-1 estimate at your 24.0% rate — not tax advice; consult a CPA.
Schools (NCES district)
- District
- William Floyd Union Free School District
- NCES district ID
- 3618690
- Math proficiency
- 48% ▲ 3.00%
- Reading proficiency
- 57% ▲ 11.00%
- Median HH income
- $70,564
- Composite
- 46.79/100
- National rank
- #2383
- State rank
- #309 of 590 in NY
Livability — Mastic
- Score
- 63/100
- State rank
- #816
- US rank
- #15786
Category grades
Schools grade is shown separately in the Schools card above.
Census & demographics
- Census place
- Mastic, NY
- City population
- 16,944
- Population (ZIP)
- 16,944
Population outlook (Suffolk County) Hauer SSP2
- Today (2025)
- 1,505,262 people
- By 2030
- 1,498,318 · -0.5%
- By 2040
- 1,471,101 · -2.3%
- By 2050
- 1,424,848 · -5.3%
- By 2075
- 1,337,157 · -11.2%
- By 2100
- 1,217,720 · -19.1%
Race, ethnicity, and origin ACS 2023
- Neighborhood character
- Diverse neighborhood (Simpson 0.59)
- Race & ethnicity
- White 55% Hispanic / Latino 30% Two or more races 15% Black 7% Native American 2% Asian 1%
- Hispanic origin (detail)
- Mexican 6% Puerto Rican 8%
- Common ancestry
- Romanian 3% Scotch-Irish 1%
- Foreign-born
- 18% · Canada, Jamaica
- Languages at home
- 72% English-only · Spanish 20% Other Indo-European 3% Russian/Polish/Slavic 2%
Political lean MEDSL · Suffolk
- 2024 margin
- Lean R (+10.0) · D 45.0% · R 55.0%
- 2008→2024 swing
- -16.0pp toward R · 2008: 6.0pp · 2024: -10.0pp
- All cycles
- 2024: R+10.0 2020: R+0.0 2016: R+8.2 2012: D+2.9 2008: D+6.0
Not yet ingested
- Civics
- —
Market trends
- HPI YoY
- ▼ -228.55%
- Current HPI
- 460.0878
- Rent YoY
- —
- Metro
- —
- State GDP YoY
- ▲ 2.60%
- F500 in state
- 92
Industry mix (Fortune 500 HQ in NY)
| Industry | F500 HQs | Revenue |
|---|---|---|
| Financial Services | 10 | $950B |
|
||
| Consumer Goods | 9 | $162B |
|
||
| Insurance | 4 | $225B |
|
||
| Telecommunications | 2 | $144B |
|
||
| Pharmaceuticals | 2 | $112B |
|
||
| Media / Entertainment | 2 | $69B |
|
||
Price history
+400.0% since first listed2 events — show timeline
- 2026-04-28 Listed $425,000 OneKey® MLS as Distributed by MLS Grid
- 1989-12-19 Sold (Public Records) $85,000 Public Records
Property tax history
+0.7%/yrLatest (2025): $6,951 · +0.0% YoY. Source: county tax records.
Cash-flow waterfall
monthlySold comps — $/sqft
last 12 mo · ≤1 miLoading sold comps…