 Multi-family
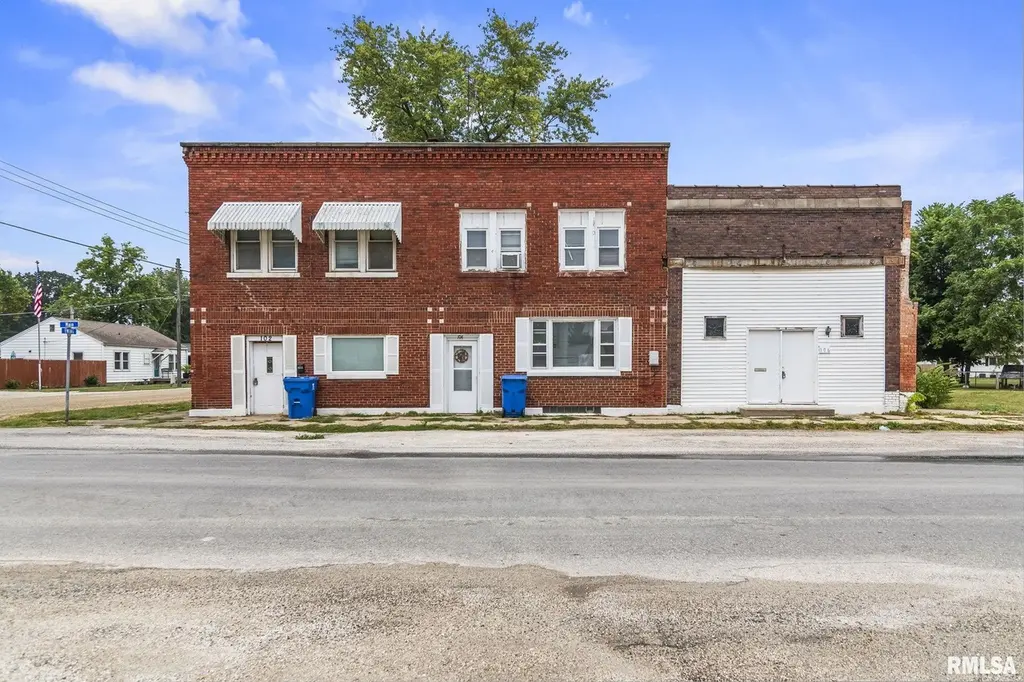
102 Main St · Tallula, IL
Flood risk No data
- FEMA flood zone
- —
- Chance of flooding over 30 yrs
- —
- Est. flood insurance / yr
- —
Fire risk No data
- Est. fire insurance / yr
- —
Heat risk No data
- Hot days now (above threshold)
- —
- Hot days in 30 yrs
- —
Wind risk No data
- Chance of severe wind over 30 yrs
- —
Air-quality risk No data
- Unhealthy air days now
- —
- Unhealthy air days in 30 yrs
- —
Risk factors via First Street. Map © Google.
Why this score? — see what drove the B grade
The composite is a weighted blend of 9 inputs, each scored 0–100. Each bar is that input's sub-score; the figure is the points it added to the 100-point composite (weight × sub-score).
- Cash flow +30.0/30.0
- 1% rule +10.0/10.0
- DSCR +10.0/10.0
- ARV discount +7.5/15.0
- Appreciation +6.0/10.0
- Livability +2.9/5.0
- Rent growth +2.5/5.0
- Condition / age +2.2/5.0
- Schools +2.1/10.0
$94,900
🖨 Deal sheet (PDF) 📄 Offer letter ✓ Due diligence
Multi-family units
County records classify this as Multi-Family (2-4 Unit). Listing-text estimate: 1 unit. estimate disagrees with records
Listing remarks
Investment Opportunity – 102, 104 & 106 E Main St, Tallula, IL This property includes three rental apartments, a storage garage, and three additional vacant lots — offering plenty of potential for income and future growth. Current Income: 2 of the 3 apartments are rented Total potential rent: $2,150/month Units: 102 N Ewing (Upper) – 1 Bed / 1 Bath 102 E Main (Lower) – 1 Bed / 1 Bath 104 E Main – 2 Bed / 1 Bath Included Parcels: Five total parcels: Rentals: 005 & 006 Storage garage: 007 Vacant lots: 008 & 009 Parcel numbers: 16-07-102-005, 006, 007, 008, and 009 Don’t miss this great opportunity to expand your rental portfolio
Key facts
- Storage garage
- Five total parcels
- Built 1900
Tags
Property features AI
Finance
- Financial info: 3 units total; Unit 2 current rent: $700; Unit 3 current rent: $700; Unit 1 current rent reported as $0
Exterior
- Parking: On-street parking
- Utilities: Public water; Public sewer
- Home design: Residential income property; Two or more stories; Built in 1900
- Construction: Approximately 2,200 total building area
- Exterior features: Corner lot; Other-style roof
Interior
- Bedrooms: One unit with 2 bedrooms; Two units with 1 bedroom each
- Bathrooms: Three full bathrooms (one in each unit)
- Heating & cooling: Central air; Forced air heating; Window air unit(s)
- Interior features: No basement; Fireplace in one unit
Neighborhood map
What this means for you Summary
Snapshot
- This is a 4-bed/3.0-bath multifamily listed at $95k. Condition is rated fair.
Deal economics
- At list price, monthly cash flow is $2k ($22k/yr) — positive.
- The deal already cash-flows at list — no discount required.
- Meets the 1% rule at list price ($3k rent vs $95k).
- Recommended offer: $92k (3.0% below list) — sets the bar for market timing.
Location & tenants
- Location reads 58/100 on livability (#1,099 in IL) — a working-class tenant base; expect higher turnover. Strengths: cost of living A+, housing A+; Watch: crime D, amenities F, commute F.
- Porta CUSD 202 (town): math 16% / reading 29% proficiency, ranked #363 of 620 in IL (top 58%) — low school quality limits family demand, transient renter base, plan for 1-2y turnover.
- Zoned schools: Petersburg Elem School (345 students, 0% FRL); Porta High School (math 22% / reading 32%, grade F, #218 of 693 statewide, top 35%, 428 students, 0% FRL) — zoned schools average 0% FRL vs 32% district-wide (32 pts lower); this property's tenant base skews higher-income than the district average.
- Market conditions: 4 active listings in the ZIP; 9 units permitted in Menard County in 2024 (0 in 5+ unit buildings).
Forward outlook
- In year one you build about $3k of equity ($656 loan paydown + $2k appreciation (2.1% local appreciation)).
- Menard County population projected at -17% by 2050 — secular population decline; favor cash flow + early exit over multi-decade hold.
- At projected returns (2.1% appreciation + 3.0% rent growth), your $27k cash investment doubles in ~2 years — after that, you're playing with house money.
Negotiation context
- It's been on market 40 days — a 3% lower offer ($92k) is reasonable based on typical stale-listing flexibility.
- 2 sale attempts with the ask held roughly flat each time — persistent listings suggest the price (not the market) is what's stuck; bring a comps-based counter.
Risks & watch-outs
- Watch-outs: built in 1900 — expect roof / HVAC / electrical / plumbing capex.
Questions for the listing agent
- It's been on market 40 days. Have you received any prior offers? Is the seller open to a 3% concession, seller financing, or rate buy-down credit?
- Have any recent inspections been done? Can we get a copy of the seller's disclosures and any deferred-maintenance estimates?
- Built in 1900 — when were the roof, HVAC, electrical panel, plumbing, and water heater last replaced?
- Is there a deadline driving the sale (1031 exchange, divorce, estate, relocation)? That informs how much negotiation room exists.
- Schools are F-rated, which usually means shorter tenancies and higher turnover. Who's the typical renter profile here, and what's been the actual vacancy rate?
- Crime grade is D in this area — have there been break-ins, vandalism, or insurance claims at this property in the last 3 years? What carrier currently insures it and at what premium?
- What's the average days-on-market for RENTAL listings here right now (not sales)? A rising rental-DOM trend means longer vacancies and softer asking-rent achievability than the comps imply.
- What's the recent tenant-quality profile in this submarket — average credit score on applications, eviction rate, late-payment / NSF rate, and stable-employment percentage? A property-management company in the area should have these aggregated.
- How much new apartment / multifamily construction is in the pipeline within 1–3 miles? Heavy new supply (>2% of stock underway) typically softens rents 12–24 months out; light construction supports rent growth.
Investment metrics
- 1% rule
- 3.32% ✓
- Cap rate
- 29.46%
- Cash-on-cash
- 82.73%
- DSCR
- 4.68
- GRM
- 2.5
CMA / ARV
No comps found within radius.
Projected returns pro-forma
2.06% appreciation · 3.0% rent growth · sell at horizon
- IRR
- 86.5%
- Equity multiple
- 5.65×
- Total profit
- $123,520
- Equity at exit
- $37,742
- IRR
- 86.6%
- Equity multiple
- 11.62×
- Total profit
- $282,277
- Equity at exit
- $54,590
Cash invested: $26,572 (down + closing). Projections, not guarantees.
Landlord ↔ Tenant lean methodology
- Overall (STATE)
- 43 Moderately Tenant-Leaning
- State Illinois
- 43 Moderately Tenant-Leaning · D+7
- County
- — inherits STATE
- City
- — inherits STATE
ZIP-level market 62688
- Home prices YoY
- 2.1%
- Active inventory
- 4
- Price-to-rent
- 10.2×
Monthly cashflow live
- Estimated rent
- $3,149 medium interval (Pro) →
- Mortgage (P&I)
- −$498
- Tax est. 1.5%
- −$119 /mo · $1,424/yr
- Insurance
- −$40
- HOA
- −$0
- Vacancy / Maint / Mgmt
- −$661
- Net cashflow
- $1,832
Break-even live
Sensitivity live
| Price | -10% $1,897 | -5% $1,865 | +0% $1,832 | +5% $1,799 | +10% $1,766 |
|---|---|---|---|---|---|
| Rent | -10% $1,583 | -5% $1,707 | +0% $1,832 | +5% $1,956 | +10% $2,081 |
| Rate | -1.0pp $1,880 | -0.5pp $1,856 | base $1,832 | +0.5pp $1,807 | +1.0pp $1,782 |
4-unit breakdown (identical units grouped — click to expand)
| Units | Beds | Baths | Est. rent |
|---|---|---|---|
| 3× units | 1 | 1 | $2,316 |
| #1 | 1 | 1 | $772 |
| #2 | 1 | 1 | $772 |
| #3 | 1 | 1 | $772 |
| 1× unit | 2 | 1 | $833 |
| Total (4 units) | $3,149 | ||
UW: 25.0% down · 7.5% · 30yr · 1.5% tax · 5.0% vac · 8.0% maint · 8.0% mgmt
Financing live
Cash to close
- Down payment
- $23,725
- Closing costs
- $2,847
- Reserves months
- —
- Total cash needed
- —
Loan-product check · same deal, 3 products live
Conventional
25% down · 7.5% · 30yr
- Down + closing
- —
- Monthly P&I
- —
- Monthly cashflow
- —
- DSCR
- —
- Eligible?
- —
Personal DTI + credit; lowest rate.
DSCR
20% down · 8.5% · 30yr
- Down + closing
- —
- Monthly P&I
- —
- Monthly cashflow
- —
- DSCR
- —
- Eligible?
- —
No personal income docs; deal must DSCR.
Hard money
10% down · 12.0% · 12mo
- Down + closing
- —
- Monthly P&I
- —
- Monthly cashflow
- —
- DSCR
- —
- Eligible?
- —
Short-term bridge; refi at stabilization.
Listing history 21 events
-
2026-06-21days on market $94,900 Active 40 DOM
-
2026-06-21days on market $94,900 Active 39 DOM
-
2026-06-18days on market $94,900 Active 37 DOM
-
2026-06-17days on market $94,900 Active 36 DOM
-
2026-06-16days on market $94,900 Active 35 DOM
-
2026-06-15days on market $94,900 Active 34 DOM
-
2026-06-13days on market $94,900 Active 32 DOM
-
2026-06-12days on market $94,900 Active 31 DOM
-
2026-06-09days on market $94,900 Active 28 DOM
-
2026-06-08days on market $94,900 Active 27 DOM
-
2026-06-07days on market $94,900 Active 26 DOM
-
2026-06-07days on market $94,900 Active 25 DOM
-
2026-06-04days on market $94,900 Active 22 DOM
-
2026-06-02days on market $94,900 Active 21 DOM
-
2026-06-01days on market $94,900 Active 20 DOM
-
2026-05-31days on market $94,900 Active 19 DOM
-
2026-05-31days on market $94,900 Active 18 DOM
-
2026-05-12$94,900 Active 771-char remark
-
2026-03-13historical
-
2025-11-04price
-
2025-09-13Active
ⓘ Source: listings_history table (triggers on properties + properties_extension) + one-shot
backfill from property_details.listing_events for pre-trigger history.
Nearby sold comps map
Loading sold comps map…
Walkable amenities ~0.75 mi
Loading nearby amenities…
Taxation est. · year 1
- Rental income
- $37,788
- − Mortgage interest
- −$5,316
- − Property taxes
- −$1,424
- − Insurance
- −$474
- − Repairs & maintenance
- −$3,023
- − Management
- −$3,023
- − Depreciation
- −$2,761
- Taxable income
- $21,767
- Est. tax owed @ 24.0%
- −$5,224
- After-tax cash flow
- $16,758/yr
For passive investors: Depreciation is non-cash, so a rental often shows a tax loss while cash-flowing — sheltering income. Rental losses are passive: they offset passive income freely, and up to $25,000/yr can offset ordinary (W-2) income if you actively participate and your MAGI is under $100k (phasing out to $0 by $150k); unused losses carry forward. On sale, claimed depreciation is recaptured at up to 25%, and gains may owe capital-gains tax (a 1031 exchange can defer both). Figures are a year-1 estimate at your 24.0% rate — not tax advice; consult a CPA.
Condition & rehab AI · 12 photos
This multi-family property requires moderate renovations, including repairs to the roof and exterior siding, and landscaping to improve its curb appeal and overall value.
Repairs flagged
- Major roof — significant damage visible
- Major exterior siding — brick facade with visible cracks and damage
- Major landscaping — overgrown yard and lack of landscaping
Value-add opportunities
- Both paint interior walls — improves appearance and value
- Both repair roof — fixes major issue and improves value
- Both repair exterior siding — enhances curb appeal and value
- Both landscape yard — enhances curb appeal and value
Renovation cost estimate screening
| Repair item | Severity | Est. cost |
|---|---|---|
| roof · significant damage visible | Major | $15,000–50,000 |
| exterior siding · brick facade with visible cracks and damage | Major | $15,000–50,000 |
| landscaping · overgrown yard and lack of landscaping | Major | $15,000–50,000 |
| Total estimated repair cost · 3 items | $45,000–150,000 |
Value-add ROI direction
- Both paint interior walls — improves appearance and value ↑
- Both repair roof — fixes major issue and improves value ↑
- Both repair exterior siding — enhances curb appeal and value ↑
- Both landscape yard — enhances curb appeal and value ↑
ⓘ Cost ranges are severity-bucket heuristics (US national rule-of-thumb). Get contractor quotes + a written scope before underwriting a rehab budget.
Schools (NCES district)
- District
- Porta CUSD 202
- NCES district ID
- 1731410
- Math proficiency
- 16% ▼ -9.00%
- Reading proficiency
- 29% ▼ -9.00%
- Median HH income
- $57,294
- Composite
- 20.63/100
- National rank
- #8544
- State rank
- #363 of 620 in IL
Livability — Tallula
- Score
- 58/100
- State rank
- #1099
- US rank
- #20865
Category grades
Schools grade is shown separately in the Schools card above.
Census & demographics
- Census place
- Tallula, IL
- Population (ZIP)
- 783
Population outlook (Menard County) Hauer SSP2
- Today (2025)
- 11,894 people
- By 2030
- 11,493 · -3.4%
- By 2040
- 10,675 · -10.2%
- By 2050
- 9,861 · -17.1%
- By 2075
- 8,334 · -29.9%
- By 2100
- 6,799 · -42.8%
Race, ethnicity, and origin ACS 2023
- Neighborhood character
- Predominantly White (99%)
- Race & ethnicity
- White 99%
- Common ancestry
- Italian 3% Romanian 2% Slovak 2%
- Languages at home
- 99% English-only · Spanish 1%
Political lean MEDSL · Menard
- 2024 margin
- Solid R (+41.5) · D 28.6% · R 70.0% · Other 1.4%
- 2008→2024 swing
- -26.6pp toward R · 2008: -14.9pp · 2024: -41.5pp
- All cycles
- 2024: R+41.5 2020: R+39.4 2016: R+37.7 2012: R+30.1 2008: R+14.9
Not yet ingested
- Civics
- —
Market trends
- HPI YoY
- ▲ 2.06%
- Current HPI
- 98.1121
- Rent YoY
- —
- Metro
- —
- State GDP YoY
- ▲ 1.59%
- F500 in state
- 60
Industry mix (Fortune 500 HQ in IL)
| Industry | F500 HQs | Revenue |
|---|---|---|
| Insurance | 4 | $201B |
|
||
| Consumer Goods | 4 | $87B |
|
||
| Industrial Machinery | 3 | $64B |
|
||
| Healthcare | 2 | $55B |
|
||
| Retail / Pharmacy | 1 | $148B |
|
||
| Agriculture / Food | 1 | $86B |
|
||
Price history
4 events — show timeline
- 2026-05-12 Listed $94,900 RMLSA as Distributed by MLS Grid
- 2026-03-13 Listing Removed — RMLSA as Distributed by MLS Grid
- 2025-11-04 Price Changed — RMLSA as Distributed by MLS Grid
- 2025-09-13 Listed — RMLSA as Distributed by MLS Grid
Cash-flow waterfall
monthlySold comps — $/sqft
last 12 mo · ≤1 miLoading sold comps…