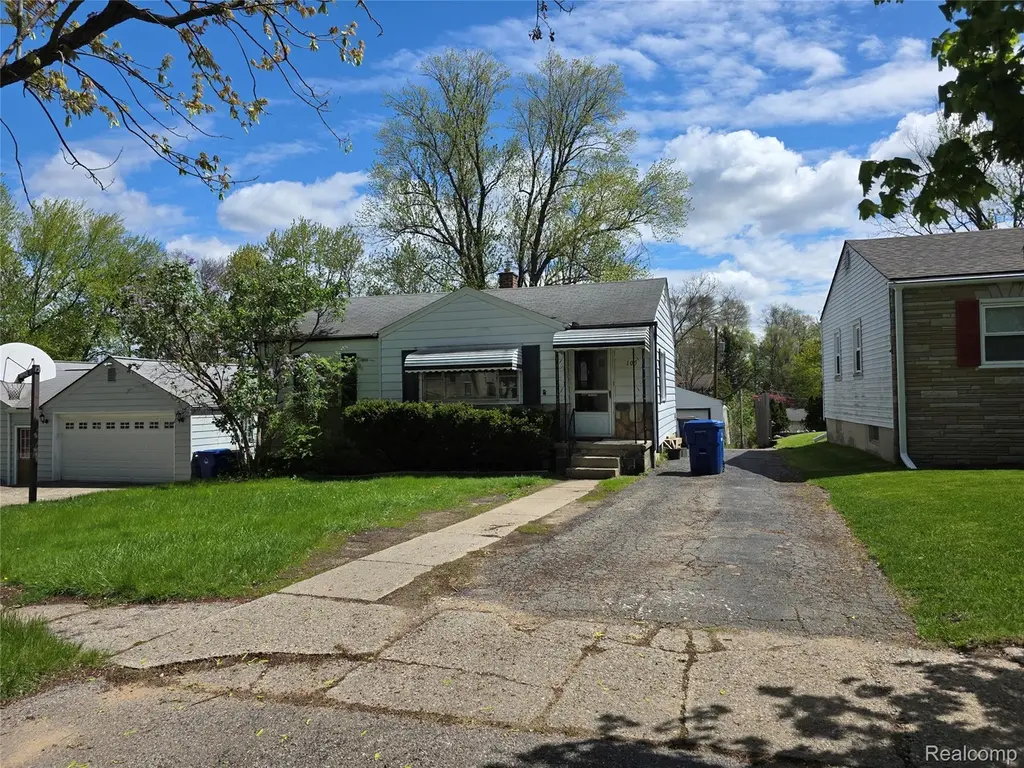
105 S Roslyn Rd · Keego Harbor, MI
Flood risk 1/10 · Minimal
- FEMA flood zone
- X (unshaded)
- Chance of flooding over 30 yrs
- 0.0%
- Est. flood insurance / yr
- $473 – $860
Fire risk 1/10 · Minimal
- Est. fire insurance / yr
- $784 – $1,456
Heat risk 2/10 · Minimal
- Hot days now (above 96°F)
- 7 days/yr
- Hot days in 30 yrs
- 15 days/yr
Wind risk 2/10 · Minimal
- Chance of severe wind over 30 yrs
- —
Air-quality risk 3/10 · Minor
- Unhealthy air days now
- 2 days/yr
- Unhealthy air days in 30 yrs
- 4 days/yr
Risk factors via First Street. Map © Google.
Why this score? — see what drove the C- grade
The composite is a weighted blend of 9 inputs, each scored 0–100. Each bar is that input's sub-score; the figure is the points it added to the 100-point composite (weight × sub-score).
- Cash flow +17.0/30.0
- ARV discount +15.0/15.0
- DSCR +5.3/10.0
- 1% rule +4.1/10.0
- Livability +3.9/5.0
- Schools +3.0/10.0
- Rent growth +2.5/5.0
- Condition / age +2.5/5.0
- Appreciation +0.0/10.0
$190,000
🖨 Deal sheet 📄 Offer letter ✓ Due diligence
Listing remarks MLS
Great opportunity in desirable Waterford! Located near numerous lakes, restaurants, and shopping, this home offers incredible potential for the right buyer. The property is dated and in need of repairs, but has been priced accordingly to reflect the updates needed. Perfect for investors or buyers looking to build sweat equity. Land contract terms available, making this an accessible path to homeownership. Don't miss the chance to make it your own!
Key facts
- 9,583 sq ft lot
- 2 garage spots
- Built 1951
Property features AI
Exterior
- Parking: Detached 2-car garage
- Utilities: Public water; Sewer available
- Home design: Single-family residence; One story; Entry at ground level
- Construction: Aluminum siding
- Exterior features: Paved road access; Lot dimensions approximately 48.33 x 198.07 (0.22 acre)
Interior
- Bathrooms: 2 full bathrooms
- Heating & cooling: Forced air heating (natural gas); No central cooling
- Interior features: Unfinished basement; Ground-level entry
Neighborhood map
What this means for you Summary
Snapshot
- This is a 3-bed/1.5-bath single-family listed at $190k.
Deal economics
- At list price, monthly cash flow is $130 ($2k/yr) — positive.
- The deal already cash-flows at list — no discount required.
- To meet the 1% rule (rent ≥ 1% of price), the offer needs to be $173k (9.1% below list).
- Recommended offer: $173k (9.1% below list) — sets the bar for 1% rule.
- Cap rate 7.1% vs local median 4.0% in Keego Harbor — top-decile yield for the area; either an underpriced asset or a hidden risk that comps aren't pricing in. Stress-test before assuming the spread holds.
Location & tenants
- Location reads 78/100 on livability (#110 in MI, #2,643 nationally) — a middle-class / working-renter tenant base. Strengths: crime A+, cost of living A+, housing A+; Watch: amenities D-, commute F.
- Waterford School District (suburban): math 26% / reading 42% proficiency, ranked #285 of 540 in MI (top 53%) — families likely to look elsewhere, expect single-tenant / working-renter base with shorter leases.
- Market conditions: 144 active listings in the ZIP; 6 comparable units currently listed for rent nearby; rentals leasing fast (median 5d on market — plan ~1-2 weeks tenant-placement turnaround); 2,614 units permitted in Oakland County in 2024 (721 in 5+ unit buildings).
Forward outlook
- Local home prices are declining (-3.0%/yr); year-one equity from $1k of loan paydown is wiped out by about $6k of value loss. Plan a longer hold.
- Oakland County population projected at +10% by 2050 — modest demand growth; plan on rents tracking national, not racing it.
Negotiation context
- Only 4 days on market — expect competitive offers; lowballing is unlikely to land.
- 2 sale attempts with the ask held roughly flat each time — persistent listings suggest the price (not the market) is what's stuck; bring a comps-based counter.
Risks & watch-outs
- Watch-outs: built in 1951 — expect roof / HVAC / electrical / plumbing capex.
Questions for the listing agent
- Built in 1951 — when were the roof, HVAC, electrical panel, plumbing, and water heater last replaced?
- Is there a deadline driving the sale (1031 exchange, divorce, estate, relocation)? That informs how much negotiation room exists.
- What's the average days-on-market for RENTAL listings here right now (not sales)? A rising rental-DOM trend means longer vacancies and softer asking-rent achievability than the comps imply.
- What's the recent tenant-quality profile in this submarket — average credit score on applications, eviction rate, late-payment / NSF rate, and stable-employment percentage? A property-management company in the area should have these aggregated.
- How much new for-sale + rental construction is in the pipeline within 1–3 miles? Heavy new supply typically softens prices + rents 12–24 months out; constrained supply supports both.
Investment metrics
- 1% rule
- 0.91% ✗
- Cap rate
- 7.11%
- Cash-on-cash
- 2.92%
- DSCR
- 1.13
- GRM
- 9.2
CMA / ARV
- ARV (median comp)
- $238,288
- List price
- $190,000
- Delta
- -20.26%
- Verdict
- UNDERPRICED
- Comps
- 20 within 1.0 mi
Show comp detail 12 sales within ~0.75 mi
| Address | Dist | Beds/Ba | Sqft | Sold | Price | $/sf | Match |
|---|---|---|---|---|---|---|---|
| 87 N Roslyn Rd | 0.19mi | 3/2.0 | 1,513 (-4%) | 7mo | $206,000 | $136 | 77 |
| 4175 Motorway Dr | 0.50mi | 3/1.0 | 1,595 (+1%) | 5mo | $225,000 | $141 | 69 |
| 445 Lakeside Dr | 0.36mi | 3/1.0 | 1,480 (-6%) | 5mo | $190,000 | $128 | 67 |
| 371 Hillcliff Dr | 0.68mi | 3/2.0 | 1,592 (+1%) | 1mo | $285,000 | $179 | 64 |
| 330 S Roslyn Rd | 0.18mi | 4/2.0 (+1) | 1,368 (-13%) | 3mo | $245,000 | $179 | 60 |
| 240 N Roslyn Rd | 0.34mi | 3/1.5 | 1,342 (-15%) | 2mo | $275,000 | $205 | 58 |
| 656 S Cass Lake Rd | 0.68mi | 3/1.5 | 1,660 (+5%) | 4mo | $195,000 | $117 | 56 |
| 3985 Motorway Dr | 0.32mi | 2/1.0 (-1) | 1,344 (-15%) | 2mo | $140,000 | $104 | 52 |
| 715 Woodingham Ave | 0.71mi | 3/1.0 | 1,400 (-11%) | 2mo | $263,000 | $188 | 44 |
| 577 Lakeside Dr | 0.60mi | 3/2.0 | 1,785 (+13%) | 7mo | $376,000 | $211 | 42 |
| 4227 Lanette Dr | 0.56mi | 2/1.0 (-1) | 1,358 (-14%) | 6mo | $225,000 | $166 | 39 |
| 260 Lorberta Ln | 0.74mi | 4/2.0 (+1) | 1,741 (+10%) | 9mo | $250,000 | $144 | 33 |
Match score weights: distance 35% · size 25% · config 20% · recency 20%. Top-matched comps best support the ARV.
Projected returns pro-forma
-3.0% appreciation · 3.0% rent growth · sell at horizon
- IRR
- -11.7%
- Equity multiple
- 0.58×
- Total profit
- $-22,560
- Equity at exit
- $28,330
- IRR
- -2.5%
- Equity multiple
- 0.83×
- Total profit
- $-9,111
- Equity at exit
- $16,428
Cash invested: $53,200 (down + closing). Projections, not guarantees.
Landlord ↔ Tenant lean methodology
- Overall (STATE)
- 62 Landlord-Friendly
- State Michigan
- 62 Landlord-Friendly · EVEN
- County
- — inherits STATE
- City
- — inherits STATE
ZIP-level market 48328
- Active inventory
- 144
- Price-to-rent
- 9.2×
Monthly cashflow live
- Estimated rent
- $1,728 high interval (Pro) →
- Mortgage (P&I)
- −$996
- Tax from tax record
- −$160 /mo · $1,916/yr
- Insurance
- −$79
- HOA
- −$0
- Vacancy / Maint / Mgmt
- −$363
- Net cashflow
- $130
Break-even live
UW: 25.0% down · 7.5% · 30yr · 1.5% tax · 5.0% vac · 8.0% maint · 8.0% mgmt
Financing live
Cash to close
- Down payment
- $47,500
- Closing costs
- $5,700
- Reserves months
- —
- Total cash needed
- —
Loan-product check · same deal, 3 products live
Conventional
25% down · 7.5% · 30yr
- Down + closing
- —
- Monthly P&I
- —
- Monthly cashflow
- —
- DSCR
- —
- Eligible?
- —
Personal DTI + credit; lowest rate.
DSCR
20% down · 8.5% · 30yr
- Down + closing
- —
- Monthly P&I
- —
- Monthly cashflow
- —
- DSCR
- —
- Eligible?
- —
No personal income docs; deal must DSCR.
Hard money
10% down · 12.0% · 12mo
- Down + closing
- —
- Monthly P&I
- —
- Monthly cashflow
- —
- DSCR
- —
- Eligible?
- —
Short-term bridge; refi at stabilization.
Rent comps 6 comps
| Address | Beds | Baths | Sqft | Rent | $/sqft | DOM | Units | Dist |
|---|---|---|---|---|---|---|---|---|
| 131 Doremus Ave Waterford, MI | 3.0 | 1.0 | 1072 | $1,800 | $1.68 | 24d | 1 | 0.75mi |
| 3530 Denise Ct Waterford Twp, MI | 1.0–2.0 | 1.0–1.5 | 1004 | $1,910 | $1.90 | 23d | 15 | 1.00mi |
| 3530 Denise Ct Waterford Twp, MI | 1.0–2.0 | 1.0–1.5 | 890 | $1,975 | $2.22 | 1d | 15 | 1.00mi |
| 950 Village Green Ln Waterford Twp, MI | 1.0–2.0 | 1.0–2.0 | 811 | $1,294 | $1.60 | 1d | 12 | 1.13mi |
| 2750 Cherokee Dr Waterford Twp, MI | 1.0–2.0 | 1.0 | 1000 | $1,389 | $1.39 | 4d | 9 | 1.19mi |
| 59 N Lynn Ave Waterford, MI | 3.0 | 1.0 | 1300 | $2,100 | $1.62 | 2d | 1 | 1.33mi |
Listing history 5 events
-
2026-05-04status Pending 451-char remark
Show marketing remark (451 chars)
Great opportunity in desirable Waterford! Located near numerous lakes, restaurants, and shopping, this home offers incredible potential for the right buyer. The property is dated and in need of repairs, but has been priced accordingly to reflect the updates needed. Perfect for investors or buyers looking to build sweat equity. Land contract terms available, making this an accessible path to homeownership. Don't miss the chance to make it your own!
-
2026-05-04status Pending 457-char remark
Show marketing remark (451 chars)
Great opportunity in desirable Waterford! Located near numerous lakes, restaurants, and shopping, this home offers incredible potential for the right buyer. The property is dated and in need of repairs, but has been priced accordingly to reflect the updates needed. Perfect for investors or buyers looking to build sweat equity. Land contract terms available, making this an accessible path to homeownership. Don't miss the chance to make it your own!
-
2026-04-30$190,000 Active 451-char remark
Show marketing remark (451 chars)
Great opportunity in desirable Waterford! Located near numerous lakes, restaurants, and shopping, this home offers incredible potential for the right buyer. The property is dated and in need of repairs, but has been priced accordingly to reflect the updates needed. Perfect for investors or buyers looking to build sweat equity. Land contract terms available, making this an accessible path to homeownership. Don't miss the chance to make it your own!
-
2026-04-30$190,000 Active 457-char remark
Show marketing remark (451 chars)
Great opportunity in desirable Waterford! Located near numerous lakes, restaurants, and shopping, this home offers incredible potential for the right buyer. The property is dated and in need of repairs, but has been priced accordingly to reflect the updates needed. Perfect for investors or buyers looking to build sweat equity. Land contract terms available, making this an accessible path to homeownership. Don't miss the chance to make it your own!
-
1994-01-20soldstatus $83,500
ⓘ Source: listings_history table (triggers on properties + properties_extension) + one-shot
backfill from property_details.listing_events for pre-trigger history.
Tax reassessment forecast MI · Partial reset (capped growth)
- Current annual tax
- $1,916 · $160/mo
- Projected year-2 tax
- $2,421 · $202/mo
- Expected delta
- +$505/yr (+$42/mo · 26.3%)
ⓘ Screening estimate from a state-policy table — verify with the county assessor before closing.
Climate risk First Street
- Flood 1/10 Low FEMA zone X (unshaded) · 0% chance over 30 yrs
- Wildfire 1/10 Low
- Heat 2/10 Low 7 d/yr ≥96°F today · 15 d/yr by 30 yrs out
- Wind 2/10 Low
- Air quality 3/10 Moderate 2 unhealthy d/yr today · 4 by 30 yrs out
Nearby sold comps map
Loading sold comps map…
Walkable amenities ~0.75 mi
Loading nearby amenities…
Taxation est. · year 1
- Rental income
- $20,731
- − Mortgage interest
- −$10,643
- − Property taxes
- −$1,916
- − Insurance
- −$950
- − Repairs & maintenance
- −$1,658
- − Management
- −$1,658
- − Depreciation
- −$5,527
- Taxable loss
- −$1,623
- Est. tax savings @ 24.0%
- +$389
- After-tax cash flow
- $1,944/yr
For passive investors: Depreciation is non-cash, so a rental often shows a tax loss while cash-flowing — sheltering income. Rental losses are passive: they offset passive income freely, and up to $25,000/yr can offset ordinary (W-2) income if you actively participate and your MAGI is under $100k (phasing out to $0 by $150k); unused losses carry forward. On sale, claimed depreciation is recaptured at up to 25%, and gains may owe capital-gains tax (a 1031 exchange can defer both). Figures are a year-1 estimate at your 24.0% rate — not tax advice; consult a CPA.
Schools (NCES district)
- District
- Waterford School District
- NCES district ID
- 2635310
- Math proficiency
- 26% ▼ -5.00%
- Reading proficiency
- 42% ▼ -1.00%
- Median HH income
- $55,581
- Composite
- 29.99/100
- National rank
- #6364
- State rank
- #285 of 540 in MI
Livability — Keego Harbor
- Score
- 78/100
- State rank
- #110
- US rank
- #2643
Category grades
Schools grade is shown separately in the Schools card above.
Census & demographics
- County
- Oakland County · 1,009,092 people
- Metro
- Detroit-Warren-Dearborn, MI
- Population (ZIP)
- 24,478
- Household income
- $72,299
- Rent vs Own
- Severe rent burden
- 1013.0
Population outlook (Oakland County) Hauer SSP2
- Today (2025)
- 1,335,747 people
- By 2030
- 1,375,100 · +2.9%
- By 2040
- 1,435,385 · +7.5%
- By 2050
- 1,469,250 · +10.0%
- By 2075
- 1,531,946 · +14.7%
- By 2100
- 1,450,485 · +8.6%
Race, ethnicity, and origin ACS 2023
- Neighborhood character
- Predominantly White (73%)
- Race & ethnicity
- White 73% Hispanic / Latino 10% Two or more races 9% Black 9% Asian 2%
- Hispanic origin (detail)
- Mexican 7% Puerto Rican 1%
- Common ancestry
- Romanian 7% Lithuanian 3% Slovak 3%
- Foreign-born
- 6% · Canada
- Languages at home
- 90% English-only · Spanish 4% Other Asian/Pacific 2% Russian/Polish/Slavic 2%
Political lean MEDSL · Oakland
- 2024 margin
- D (+10.6) · D 54.4% · R 43.8% · Other 1.9%
- 2008→2024 swing
- -3.9pp toward R · 2008: 14.5pp · 2024: 10.6pp
- All cycles
- 2024: D+10.6 2020: D+14.1 2016: D+8.1 2012: D+8.1 2008: D+14.5
Not yet ingested
- Civics
- —
Market trends
- HPI YoY
- ▼ -249.13%
- Current HPI
- 191.2771
- Rent YoY
- —
- Metro
- Detroit-Warren-Dearborn, MI
- State GDP YoY
- ▲ 1.37%
- F500 in state
- 28
Industry mix (Fortune 500 HQ in MI)
| Industry | F500 HQs | Revenue |
|---|---|---|
| Automotive Parts | 3 | $48B |
|
||
| Automotive | 2 | $372B |
|
||
| Chemicals | 1 | $45B |
|
||
| Automotive Retail | 1 | $29B |
|
||
| Healthcare / Medical Devices | 1 | $23B |
|
||
| Automotive Technology | 1 | $20B |
|
||
Price history
+163.5% since first listed7 events — show timeline
- 2026-06-08 Sold (MLS) $220,000 MiRealSource-MiMLS
- 2026-06-08 Sold (MLS) $220,000 REALCOMP
- 2026-05-04 Pending — MiRealSource-MiMLS
- 2026-05-04 Pending — REALCOMP
- 2026-04-30 Listed $190,000 MiRealSource-MiMLS
- 2026-04-30 Listed $190,000 REALCOMP
- 1994-01-20 Sold (Public Records) $83,500 Public Records
Property tax history
+4.2%/yrLatest (2025): $1,916 · +17.2% YoY. Source: county tax records.
Cash-flow waterfall
monthlySold comps — $/sqft
last 12 mo · ≤1 miLoading sold comps…