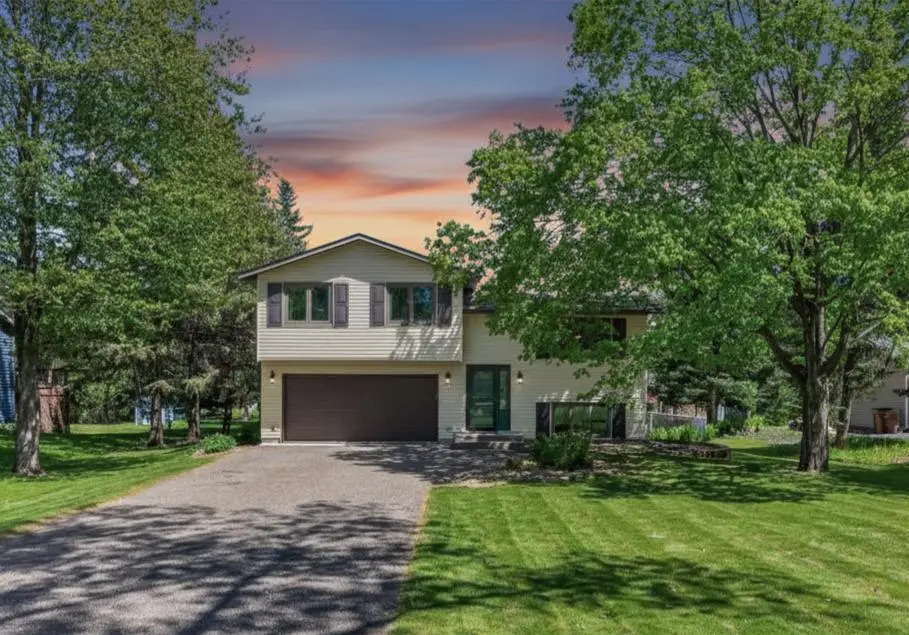
61 Quant Ct S · Lakeland, MN
Flood risk 4/10 · Minor
- FEMA flood zone
- X (unshaded)
- Chance of flooding over 30 yrs
- 0.23%
- Est. flood insurance / yr
- $473 – $860
Fire risk 2/10 · Minimal
- Est. fire insurance / yr
- $888 – $1,650
Heat risk 2/10 · Minimal
- Hot days now (above 100°F)
- 7 days/yr
- Hot days in 30 yrs
- 14 days/yr
Wind risk 2/10 · Minimal
- Chance of severe wind over 30 yrs
- —
Air-quality risk 2/10 · Minimal
- Unhealthy air days now
- 2 days/yr
- Unhealthy air days in 30 yrs
- 2 days/yr
Risk factors via First Street. Map © Google.
Why this score? — see what drove the D+ grade
The composite is a weighted blend of 9 inputs, each scored 0–100. Each bar is that input's sub-score; the figure is the points it added to the 100-point composite (weight × sub-score).
- Cash flow +22.8/30.0
- DSCR +7.3/10.0
- 1% rule +5.2/10.0
- Schools +5.0/10.0
- Livability +3.6/5.0
- Rent growth +2.5/5.0
- Condition / age +2.5/5.0
- ARV discount +0.0/15.0
- Appreciation +0.0/10.0
$360,000
🖨 Deal sheet 📄 Offer letter ✓ Due diligence
Listing remarks
Multiple offers received - H & B by noon Friday please. Welcome home to 61 Quant Ct S in lovely Lakeland MN! This home is beautiful both inside and out with 3 large bedrooms on the same level, a free standing fireplace, 2 decks, a huge fully fenced yard with mature trees AND its located conveniently on a cul-de-sac so no through traffic - but only minutes from accessing 94. The upstairs bathroom has recently been completely updated, and there is also a perfect half bath downstairs. Also features an insulated and heated garage with access to the second deck in the backyard - which is fully fenced and has breathtaking mature trees when in full bloom!
Key facts
- 0.42 acre lot
- 2 garage spots
- Built 1983
Property features AI
Exterior
- Parking: Attached heated and insulated 2-car garage with automatic garage door opener; Garage dimensions approximately 26x20 with 16' door height and 7' door width
- Utilities: City water (connected); Septic system compliant; Natural gas fuel; Electric service with circuit breakers
- Home design: Residential split-entry (bi-level) home; Main entry level and lower level living areas; Above-grade finished area 1,080 (main level); Below-grade finished area 580
- Construction: Block foundation; Roof over 8 years old
- Exterior features: Deck; Full chain link fencing; Light tree coverage on lot; City street frontage on a public maintained road; Irregular lot dimensions
Interior
- Kitchen: Dishwasher; Gas range/oven; Microwave; Refrigerator; Exhaust fan; Kitchen window
- Bedrooms: 3 bedrooms (all on upper level except family room in lower level) ; Primary/bedroom: 14x12 (upper); Bedroom: 13x9 (upper); Bedroom: 10x9 (upper)
- Bathrooms: 1 full bathroom (upper level); 1 half bathroom (in basement)
- Heating & cooling: Forced air heating; Fireplace heating; Central air conditioning
- Interior features: Ceiling fan(s); Separate/formal dining room; Family room; Daylight/lookout windows in basement; Finished basement with storage space and sump pump; Electric fireplace in family room; Water softener (owned); Kitchen window
- Laundry & utility: Washer and dryer included; Washer/dryer hookup; Gas dryer hookup (laundry in basement); Gas water heater
Neighborhood map
What this means for you Summary
Snapshot
- This is a 3-bed/2.0-bath single-family listed at $360k.
Deal economics
- At list price, monthly cash flow is $625 ($8k/yr) — positive.
- The deal already cash-flows at list — no discount required.
- Meets the 1% rule at list price ($4k rent vs $360k).
Location & tenants
- Location reads 72/100 on livability (#295 in MN) — a middle-class / working-renter tenant base. Strengths: crime A+, employment A+, housing A+; Watch: cost of living C-, amenities F, commute F.
- Stillwater Area Public School District (suburban): math 53% / reading 56% proficiency, ranked #54 of 301 in MN (top 18%) — acceptable for families but not a draw, mixed tenant base, ~2y average lease; only 12% free/reduced lunch — higher-income household profile.
- Market conditions: 16 active listings in the ZIP; 1,405 units permitted in Washington County in 2024 (121 in 5+ unit buildings).
Forward outlook
- Local home prices are declining (-3.0%/yr); year-one equity from $2k of loan paydown is wiped out by about $11k of value loss. Plan a longer hold.
- Washington County population projected at +16% by 2050 — long-run rental-demand tailwind backs the buy-and-hold thesis.
Negotiation context
- Only 9 days on market — expect competitive offers; lowballing is unlikely to land.
- 2 sale attempts since 4y ago with the ask held roughly flat each time — persistent listings suggest the price (not the market) is what's stuck; bring a comps-based counter.
Questions for the listing agent
- Is there a deadline driving the sale (1031 exchange, divorce, estate, relocation)? That informs how much negotiation room exists.
- Schools are A-rated — typically a magnet for longer-tenancy family renters. What's the average tenant stay here, and is there a school-zone premium baked into asking?
- The area grade is low — what's the realistic commute time and amenity access for the typical tenant pool here? Any planned neighborhood developments (good or bad) we should know about?
- What's the average days-on-market for RENTAL listings here right now (not sales)? A rising rental-DOM trend means longer vacancies and softer asking-rent achievability than the comps imply.
- What's the recent tenant-quality profile in this submarket — average credit score on applications, eviction rate, late-payment / NSF rate, and stable-employment percentage? A property-management company in the area should have these aggregated.
- How much new for-sale + rental construction is in the pipeline within 1–3 miles? Heavy new supply typically softens prices + rents 12–24 months out; constrained supply supports both.
Investment metrics
- 1% rule
- 1.02% ✓
- Cap rate
- 8.38%
- Cash-on-cash
- 7.45%
- DSCR
- 1.33
- GRM
- 8.2
CMA / ARV
- ARV (on-the-fly)
- $283,860
- Comps found
- 1
Show comp detail 1 sale within ~0.75 mi
| Address | Dist | Beds/Ba | Sqft | Sold | Price | $/sf | Match |
|---|---|---|---|---|---|---|---|
| 61 Quant Ct S | 0.00mi | 3/2.0 | 1,650 (-1%) | 0mo | $282,500 | $171 | 99 |
Match score weights: distance 35% · size 25% · config 20% · recency 20%. Top-matched comps best support the ARV.
Projected returns pro-forma
-3.0% appreciation · 3.0% rent growth · sell at horizon
- IRR
- -4.9%
- Equity multiple
- 0.82×
- Total profit
- $-18,576
- Equity at exit
- $53,677
- IRR
- 4.7%
- Equity multiple
- 1.35×
- Total profit
- $34,816
- Equity at exit
- $31,126
Cash invested: $100,800 (down + closing). Projections, not guarantees.
Landlord ↔ Tenant lean methodology
- Overall (STATE)
- 46 Balanced
- State Minnesota
- 46 Balanced · D+2
- County
- — inherits STATE
- City
- — inherits STATE
ZIP-level market 55043
- Active inventory
- 16
- Price-to-rent
- 8.2×
Monthly cashflow live
- Estimated rent
- $3,674 medium interval (Pro) →
- Mortgage (P&I)
- −$1,888
- Tax from tax record
- −$239 /mo · $2,870/yr
- Insurance
- −$150
- HOA
- −$0
- Vacancy / Maint / Mgmt
- −$772
- Net cashflow
- $625
Break-even live
UW: 25.0% down · 7.5% · 30yr · 1.5% tax · 5.0% vac · 8.0% maint · 8.0% mgmt
Financing live
Cash to close
- Down payment
- $90,000
- Closing costs
- $10,800
- Reserves months
- —
- Total cash needed
- —
Loan-product check · same deal, 3 products live
Conventional
25% down · 7.5% · 30yr
- Down + closing
- —
- Monthly P&I
- —
- Monthly cashflow
- —
- DSCR
- —
- Eligible?
- —
Personal DTI + credit; lowest rate.
DSCR
20% down · 8.5% · 30yr
- Down + closing
- —
- Monthly P&I
- —
- Monthly cashflow
- —
- DSCR
- —
- Eligible?
- —
No personal income docs; deal must DSCR.
Hard money
10% down · 12.0% · 12mo
- Down + closing
- —
- Monthly P&I
- —
- Monthly cashflow
- —
- DSCR
- —
- Eligible?
- —
Short-term bridge; refi at stabilization.
Listing history 9 events
-
2026-05-22historical Contingent - Inspection
-
2026-05-21$360,000 Active
-
2026-05-18historical $360,000
-
2022-06-16soldstatus $355,000
-
2022-06-14soldstatus $355,000 Sold
-
2022-05-15status Pending
-
2022-05-13$325,000 Active
-
2022-05-10historical $325,000
-
1987-03-01soldstatus $85,900
ⓘ Source: listings_history table (triggers on properties + properties_extension) + one-shot
backfill from property_details.listing_events for pre-trigger history.
Tax reassessment forecast MN · Partial reset (capped growth)
- Current annual tax
- $2,870 · $239/mo
- Projected year-2 tax
- $3,451 · $288/mo
- Expected delta
- +$581/yr (+$48/mo · 20.2%)
ⓘ Screening estimate from a state-policy table — verify with the county assessor before closing.
Climate risk First Street
- Flood 4/10 Moderate FEMA zone X (unshaded) · 23% chance over 30 yrs
- Wildfire 2/10 Low
- Heat 2/10 Low 7 d/yr ≥100°F today · 14 d/yr by 30 yrs out
- Wind 2/10 Low
- Air quality 2/10 Low 2 unhealthy d/yr today · 2 by 30 yrs out
Nearby sold comps map
Loading sold comps map…
Walkable amenities ~0.75 mi
Loading nearby amenities…
Taxation est. · year 1
- Rental income
- $44,088
- − Mortgage interest
- −$20,166
- − Property taxes
- −$2,870
- − Insurance
- −$1,800
- − Repairs & maintenance
- −$3,527
- − Management
- −$3,527
- − Depreciation
- −$10,473
- Taxable income
- $1,726
- Est. tax owed @ 24.0%
- −$414
- After-tax cash flow
- $7,091/yr
For passive investors: Depreciation is non-cash, so a rental often shows a tax loss while cash-flowing — sheltering income. Rental losses are passive: they offset passive income freely, and up to $25,000/yr can offset ordinary (W-2) income if you actively participate and your MAGI is under $100k (phasing out to $0 by $150k); unused losses carry forward. On sale, claimed depreciation is recaptured at up to 25%, and gains may owe capital-gains tax (a 1031 exchange can defer both). Figures are a year-1 estimate at your 24.0% rate — not tax advice; consult a CPA.
Schools (NCES district)
- District
- Stillwater Area Public School District
- NCES district ID
- 2738190
- Math proficiency
- 53% ▼ -11.00%
- Reading proficiency
- 56% ▼ -12.00%
- Median HH income
- $84,438
- Composite
- 49.8/100
- National rank
- #1954
- State rank
- #54 of 301 in MN
Livability — Lakeland
- Score
- 72/100
- State rank
- #295
- US rank
- #6454
Category grades
Schools grade is shown separately in the Schools card above.
Census & demographics
- Census place
- Lakeland, MN
- City population
- 3,471
- Population (ZIP)
- 3,471
Population outlook (Washington County) Hauer SSP2
- Today (2025)
- 278,554 people
- By 2030
- 290,465 · +4.3%
- By 2040
- 310,014 · +11.3%
- By 2050
- 324,118 · +16.4%
- By 2075
- 362,697 · +30.2%
- By 2100
- 381,491 · +37.0%
Race, ethnicity, and origin ACS 2023
- Neighborhood character
- Predominantly White (91%)
- Race & ethnicity
- White 91% Two or more races 6% Hispanic / Latino 2% Asian 2%
- Common ancestry
- Portuguese 13% Lithuanian 6% Romanian 5%
- Foreign-born
- 3% · South Korea, Canada
- Languages at home
- 96% English-only · Spanish 2% German/W. Germanic 1%
Political lean MEDSL · Washington
- 2024 margin
- Lean D (+8.9) · D 53.5% · R 44.6% · Other 1.9%
- 2008→2024 swing
- +4.6pp toward D · 2008: 4.3pp · 2024: 8.9pp
- All cycles
- 2024: D+8.9 2020: D+9.2 2016: D+1.9 2012: D+0.8 2008: D+4.3
Not yet ingested
- Civics
- —
Market trends
- HPI YoY
- ▼ -159.52%
- Current HPI
- 260.4948
- Rent YoY
- —
- Metro
- —
- State GDP YoY
- ▲ 2.41%
- F500 in state
- 34
Industry mix (Fortune 500 HQ in MN)
| Industry | F500 HQs | Revenue |
|---|---|---|
| Healthcare | 2 | $407B |
|
||
| Retail | 2 | $150B |
|
||
| Consumer Goods | 2 | $32B |
|
||
| Industrial Machinery | 2 | $6B |
|
||
| Agriculture | 1 | $40B |
|
||
| Healthcare / Medical Devices | 1 | $32B |
|
||
Price history
+319.1% since first listed9 events — show timeline
- 2026-05-22 Contingent — NORTHSTARMLS as Distributed by MLS Grid
- 2026-05-21 Listed $360,000 NORTHSTARMLS as Distributed by MLS Grid
- 2026-05-18 Coming Soon $360,000 NORTHSTARMLS as Distributed by MLS Grid
- 2022-06-16 Sold (Public Records) $355,000 Public Records
- 2022-06-14 Sold (MLS) $355,000 NORTHSTARMLS as Distributed by MLS Grid
- 2022-05-15 Pending — NORTHSTARMLS as Distributed by MLS Grid
- 2022-05-13 Listed $325,000 NORTHSTARMLS as Distributed by MLS Grid
- 2022-05-10 Coming Soon $325,000 NORTHSTARMLS as Distributed by MLS Grid
- 1987-03-01 Sold (Public Records) $85,900 Public Records
Property tax history
+2.2%/yrLatest (2025): $2,870 · -9.1% YoY. Source: county tax records.
Cash-flow waterfall
monthlySold comps — $/sqft
last 12 mo · ≤1 miLoading sold comps…