3516 Stratford Dr · Binghamton University, NY
Flood risk 8/10 · Major
- FEMA flood zone
- X
- Chance of flooding over 30 yrs
- 0.99%
- Est. flood insurance / yr
- $473 – $860
Fire risk 3/10 · Minor
- Est. fire insurance / yr
- $691 – $1,283
Heat risk 3/10 · Minor
- Hot days now (above 92°F)
- 7 days/yr
- Hot days in 30 yrs
- 15 days/yr
Wind risk 2/10 · Minimal
- Chance of severe wind over 30 yrs
- 1.0%
Air-quality risk 2/10 · Minimal
- Unhealthy air days now
- 0 days/yr
- Unhealthy air days in 30 yrs
- 1 days/yr
Risk factors via First Street. Map © Google.
Why this score? — see what drove the C grade
The composite is a weighted blend of 9 inputs, each scored 0–100. Each bar is that input's sub-score; the figure is the points it added to the 100-point composite (weight × sub-score).
- Cash flow +16.8/30.0
- ARV discount +15.0/15.0
- Schools +5.7/10.0
- DSCR +5.2/10.0
- 1% rule +4.6/10.0
- Livability +3.3/5.0
- Rent growth +2.5/5.0
- Condition / age +2.5/5.0
- Appreciation +0.0/10.0
$175,000
🖨 Deal sheet 📄 Offer letter ✓ Due diligence
Listing remarks MLS
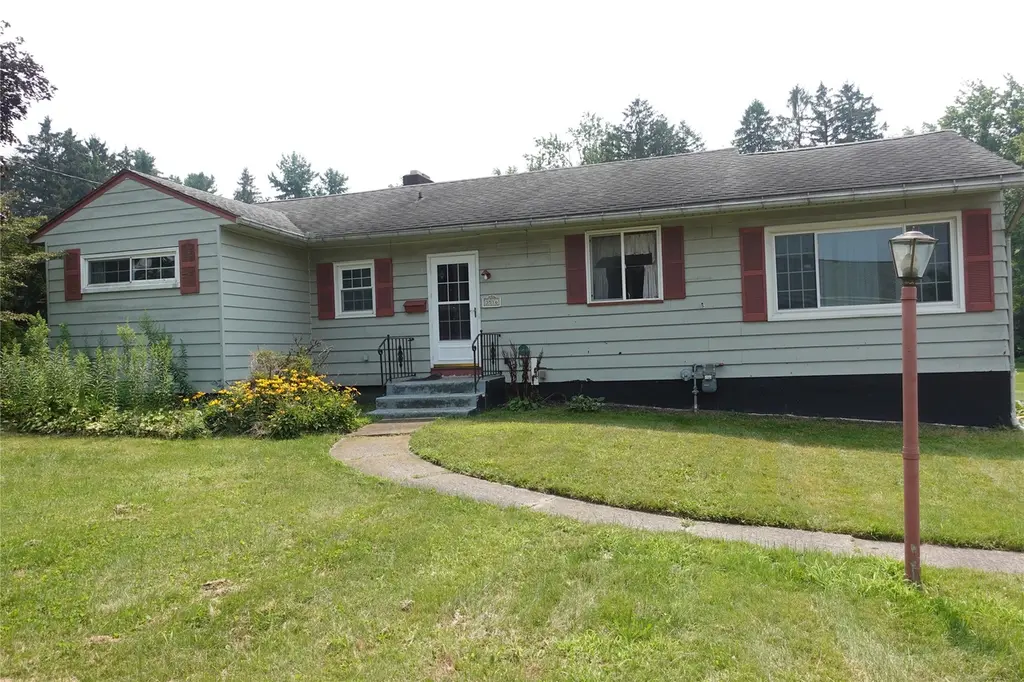
Welcome to this ranch in the Willow Point area! Featuring four bedrooms (3 up and 1 down), beautiful hardwood flooring, Tray ceiling in the kitchen filled with beautiful woodwork and a lower level family room for those large gatherings in your walkout basement. This home is so close to Binghamton College, hospitals, shopping, and many restaurants! Contact your favorite real estate agent and come see this before it's gone!
Key facts
- Hardwood flooring
- Walkout basement
- Tray ceiling
Tags
Neighborhood map
What this means for you Summary
Snapshot
- This is a 3-bed/2.0-bath single-family listed at $175k.
Deal economics
- At list price, monthly cash flow is $57 ($688/yr) — positive.
- The deal already cash-flows at list — no discount required.
- To meet the 1% rule (rent ≥ 1% of price), the offer needs to be $167k (4.4% below list).
- Recommended offer: $154k (12.0% below list) — sets the bar for market timing.
- Cap rate 7.1% vs local median 4.1% in Binghamton University — top-decile yield for the area; either an underpriced asset or a hidden risk that comps aren't pricing in. Stress-test before assuming the spread holds.
Location & tenants
- Location reads 66/100 on livability (#620 in NY) — a middle-class / working-renter tenant base. Strengths: commute A+, health & safety A+, crime A; Watch: employment F, housing F.
- Vestal Central School District (suburban): math 63% / reading 68% proficiency, ranked #168 of 590 in NY (top 28%) — acceptable for families but not a draw, mixed tenant base, ~2y average lease; only 17% free/reduced lunch — higher-income household profile.
- Market conditions: 90 active listings in the ZIP; 9 comparable units currently listed for rent nearby; rentals leasing fast (median 13d on market — plan ~1-2 weeks tenant-placement turnaround); 340 units permitted in Broome County in 2024 (269 in 5+ unit buildings).
Forward outlook
- Local home prices are declining (-3.0%/yr); year-one equity from $1k of loan paydown is wiped out by about $5k of value loss. Plan a longer hold.
- Broome County population projected at -13% by 2050 — secular population decline; favor cash flow + early exit over multi-decade hold.
Negotiation context
- It's been on market 166 days — a 12% lower offer ($154k) is reasonable based on typical stale-listing flexibility.
- 9 sale attempts since 4y ago with the ask held roughly flat each time — persistent listings suggest the price (not the market) is what's stuck; bring a comps-based counter.
- Current owner paid $90k; list at $175k implies a 96% gain — meaningful room to come down on a strong offer.
Risks & watch-outs
- Watch-outs: flood insurance adds $56/mo.
- Climate carrying-cost: severe flood risk — expect insurance premiums to compound above CPI over the hold.
Questions for the listing agent
- It's been on market 166 days. Have you received any prior offers? Is the seller open to a 12% concession, seller financing, or rate buy-down credit?
- Built in 1960 — when were the roof, HVAC, electrical panel, plumbing, and water heater last replaced?
- What's the actual annual flood-insurance premium (NFIP or private), and is the property in a SFHA with mandatory coverage?
- Why hasn't it sold? Are there any deal-killer items the seller is aware of (foundation, flood, title, zoning, code violations)?
- Is there a deadline driving the sale (1031 exchange, divorce, estate, relocation)? That informs how much negotiation room exists.
- Schools are B-rated — typically a magnet for longer-tenancy family renters. What's the average tenant stay here, and is there a school-zone premium baked into asking?
- What's the average days-on-market for RENTAL listings here right now (not sales)? A rising rental-DOM trend means longer vacancies and softer asking-rent achievability than the comps imply.
- What's the recent tenant-quality profile in this submarket — average credit score on applications, eviction rate, late-payment / NSF rate, and stable-employment percentage? A property-management company in the area should have these aggregated.
- How much new for-sale + rental construction is in the pipeline within 1–3 miles? Heavy new supply typically softens prices + rents 12–24 months out; constrained supply supports both.
Investment metrics
- 1% rule
- 0.96% ✗
- Cap rate
- 7.07%
- Cash-on-cash
- 2.76%
- DSCR
- 1.12
- GRM
- 8.7
CMA / ARV
- ARV (median comp)
- $231,394
- List price
- $175,000
- Delta
- -24.37%
- Verdict
- UNDERPRICED
- Comps
- 20 within 1.0 mi
Show comp detail 3 sales within ~0.75 mi
| Address | Dist | Beds/Ba | Sqft | Sold | Price | $/sf | Match |
|---|---|---|---|---|---|---|---|
| 3541 Maplecrest Dr | 0.08mi | 2/1.0 (-1) | 1,145 (-1%) | 17mo | $155,000 | $135 | 71 |
| 108 Martha Rd | 0.74mi | 3/1.0 | 1,196 (+3%) | 1mo | $235,000 | $196 | 56 |
| 3313 Brentwood Pl | 0.27mi | 3/1.0 | 1,022 (-12%) | 19mo | $185,000 | $181 | 48 |
Match score weights: distance 35% · size 25% · config 20% · recency 20%. Top-matched comps best support the ARV.
Projected returns pro-forma
-3.0% appreciation · 3.0% rent growth · sell at horizon
- IRR
- -14.0%
- Equity multiple
- 0.50×
- Total profit
- $-24,648
- Equity at exit
- $26,093
- IRR
- -5.2%
- Equity multiple
- 0.66×
- Total profit
- $-16,523
- Equity at exit
- $15,131
Cash invested: $49,000 (down + closing). Projections, not guarantees.
Landlord ↔ Tenant lean methodology
- Overall (STATE)
- 15 Strongly Tenant-Friendly
- State New York
- 15 Strongly Tenant-Friendly · D+10
- County
- — inherits STATE
- City
- — inherits STATE
ZIP-level market 13850
- Home prices YoY
- -33.5%
- Active inventory
- 90
- Price-to-rent
- 8.7×
Monthly cashflow live
- Estimated rent
- $1,674 high interval (Pro) →
- Mortgage (P&I)
- −$918
- Tax est. 1.5%
- −$219 /mo · $2,625/yr
- Insurance
- −$73
- Flood insurance flood zone
- −$56 /mo · $666/yr
- HOA
- −$0
- Vacancy / Maint / Mgmt
- −$351
- Net cashflow
- $57
Break-even live
UW: 25.0% down · 7.5% · 30yr · 1.5% tax · 5.0% vac · 8.0% maint · 8.0% mgmt
Financing live
Cash to close
- Down payment
- $43,750
- Closing costs
- $5,250
- Reserves months
- —
- Total cash needed
- —
Loan-product check · same deal, 3 products live
Conventional
25% down · 7.5% · 30yr
- Down + closing
- —
- Monthly P&I
- —
- Monthly cashflow
- —
- DSCR
- —
- Eligible?
- —
Personal DTI + credit; lowest rate.
DSCR
20% down · 8.5% · 30yr
- Down + closing
- —
- Monthly P&I
- —
- Monthly cashflow
- —
- DSCR
- —
- Eligible?
- —
No personal income docs; deal must DSCR.
Hard money
10% down · 12.0% · 12mo
- Down + closing
- —
- Monthly P&I
- —
- Monthly cashflow
- —
- DSCR
- —
- Eligible?
- —
Short-term bridge; refi at stabilization.
Rent comps 9 comps
| Address | Beds | Baths | Sqft | Rent | $/sqft | DOM | Units | Dist |
|---|---|---|---|---|---|---|---|---|
| 3127 Burris Rd Vestal, NY | 1.0–2.0 | 1.0 | 770 | $1,600 | $2.08 | 13d | 12 | 0.71mi |
| 3105 Burris Rd Unit 4 Vestal, NY | 2.0 | 1.0 | 700 | $1,550 | $2.21 | 21d | 1 | 0.80mi |
| 212 Rano Blvd Unit 3 Vestal, NY | 2.0 | 1.0 | 1200 | $1,300 | $1.08 | 43d | 1 | 0.84mi |
| 300 Rano Blvd Unit 3 Vestal, NY | 2.0 | 1.0 | 1200 | $1,300 | $1.08 | 43d | 1 | 0.86mi |
| 10 Bidwell St Johnson City, NY | 3.0 | 2.0 | 1200 | $1,850 | $1.54 | 43d | 1 | 1.26mi |
| 11 Dayton St Apt 5 Johnson City, NY | 2.0 | 1.0 | 900 | $1,200 | $1.33 | 13d | 1 | 1.32mi |
| 400 Riverside Dr Unit 212 Johnson City, NY | 3.0 | 1.0 | 1100 | $2,500 | $2.27 | 13d | 1 | 1.43mi |
| 400 Riverside Dr Unit 27 Johnson City, NY | 2.0 | 1.0 | 800 | $2,000 | $2.50 | 13d | 1 | 1.43mi |
| 400 Riverside Dr Unit 15 Johnson City, NY | 3.0 | 1.0 | 1000 | $2,425 | $2.42 | 13d | 1 | 1.43mi |
Listing history 41 events
-
2026-06-19days on market $175,000 Active 166 DOM
-
2026-06-18days on market $175,000 Active 165 DOM
-
2026-06-17days on market $175,000 Active 164 DOM
-
2026-06-16days on market $175,000 Active 163 DOM
-
2026-06-15days on market $175,000 Active 162 DOM
-
2026-06-14days on market $175,000 Active 160 DOM
-
2026-06-13days on market $175,000 Active 159 DOM
-
2026-06-10days on market $175,000 Active 157 DOM
-
2026-06-09days on market $175,000 Active 156 DOM
-
2026-06-08days on market $175,000 Active 155 DOM
-
2026-06-07days on market $175,000 Active 154 DOM
-
2026-06-02days on market $175,000 Active 149 DOM
-
2026-06-01days on market $175,000 Active 148 DOM
-
2026-05-31days on market $175,000 Active 147 DOM
-
2026-05-30days on market $175,000 Active 146 DOM
-
2026-03-17status Active 427-char remark
Show marketing remark (427 chars)
Welcome to this ranch in the Willow Point area! Featuring four bedrooms (3 up and 1 down), beautiful hardwood flooring, Tray ceiling in the kitchen filled with beautiful woodwork and a lower level family room for those large gatherings in your walkout basement. This home is so close to Binghamton College, hospitals, shopping, and many restaurants! Contact your favorite real estate agent and come see this before it's gone!
-
2025-10-17status Pending 427-char remark
Show marketing remark (427 chars)
Welcome to this ranch in the Willow Point area! Featuring four bedrooms (3 up and 1 down), beautiful hardwood flooring, Tray ceiling in the kitchen filled with beautiful woodwork and a lower level family room for those large gatherings in your walkout basement. This home is so close to Binghamton College, hospitals, shopping, and many restaurants! Contact your favorite real estate agent and come see this before it's gone!
-
2025-08-01$175,000 Active 427-char remark
Show marketing remark (427 chars)
Welcome to this ranch in the Willow Point area! Featuring four bedrooms (3 up and 1 down), beautiful hardwood flooring, Tray ceiling in the kitchen filled with beautiful woodwork and a lower level family room for those large gatherings in your walkout basement. This home is so close to Binghamton College, hospitals, shopping, and many restaurants! Contact your favorite real estate agent and come see this before it's gone!
-
2025-06-30$179,000 Active
-
2025-01-10$179,900 Active
-
2024-12-24historical $2,000
-
2024-11-24price $2,000
-
2024-10-18$2,100
-
2023-12-10historical $2,000
-
2023-11-19price $2,000
-
2023-11-11price $2,150
-
2023-10-04$2,250
-
2023-08-14soldstatus $89,500 Closed
-
2023-06-20status Pending
-
2023-04-21$119,500 Active
-
2022-12-05soldstatus $80,000 Closed
-
2022-10-29status Pending
-
2022-10-21price $85,000
-
2022-10-19status Active
-
2022-10-06status Pending
-
2022-09-27price $119,900
-
2022-09-10$134,900 Active
-
2007-05-10soldstatus $107,500
-
2007-05-10soldstatus $107,500
-
2005-10-14soldstatus $78,434
-
2004-11-08soldstatus $75,000
ⓘ Source: listings_history table (triggers on properties + properties_extension) + one-shot
backfill from property_details.listing_events for pre-trigger history.
Climate risk First Street
- Flood 8/10 Severe FEMA zone X · 99% chance over 30 yrs
- Wildfire 3/10 Moderate
- Heat 3/10 Moderate 7 d/yr ≥92°F today · 15 d/yr by 30 yrs out
- Wind 2/10 Low 100% chance of damaging wind over 30 yrs
- Air quality 2/10 Low 0 unhealthy d/yr today · 1 by 30 yrs out
Nearby sold comps map
Loading sold comps map…
Walkable amenities ~0.75 mi
Loading nearby amenities…
Taxation est. · year 1
- Rental income
- $20,085
- − Mortgage interest
- −$9,803
- − Property taxes
- −$2,625
- − Insurance
- −$1,542
- − Repairs & maintenance
- −$1,607
- − Management
- −$1,607
- − Depreciation
- −$5,091
- Taxable loss
- −$2,189
- Est. tax savings @ 24.0%
- +$525
- After-tax cash flow
- $1,213/yr
For passive investors: Depreciation is non-cash, so a rental often shows a tax loss while cash-flowing — sheltering income. Rental losses are passive: they offset passive income freely, and up to $25,000/yr can offset ordinary (W-2) income if you actively participate and your MAGI is under $100k (phasing out to $0 by $150k); unused losses carry forward. On sale, claimed depreciation is recaptured at up to 25%, and gains may owe capital-gains tax (a 1031 exchange can defer both). Figures are a year-1 estimate at your 24.0% rate — not tax advice; consult a CPA.
Schools (NCES district)
- District
- Vestal Central School District
- NCES district ID
- 3629610
- Math proficiency
- 63% ▼ -7.00%
- Reading proficiency
- 68% ▲ 4.00%
- Median HH income
- $64,143
- Composite
- 56.97/100
- National rank
- #1111
- State rank
- #168 of 590 in NY
Livability — Binghamton University
- Score
- 66/100
- State rank
- #620
- US rank
- #11263
Category grades
Schools grade is shown separately in the Schools card above.
Census & demographics
- City population
- 6,921
- Population (ZIP)
- 23,675
Population outlook (Broome County) Hauer SSP2
- Today (2025)
- 187,989 people
- By 2030
- 183,066 · -2.6%
- By 2040
- 172,228 · -8.4%
- By 2050
- 163,161 · -13.2%
- By 2075
- 153,641 · -18.3%
- By 2100
- 140,851 · -25.1%
Race, ethnicity, and origin ACS 2023
- Neighborhood character
- Predominantly White (78%)
- Race & ethnicity
- White 78% Asian 12% Hispanic / Latino 5% Two or more races 5% Black 2%
- Hispanic origin (detail)
- Puerto Rican 2%
- Common ancestry
- Romanian 6% Scotch-Irish 2% Italian 2%
- Foreign-born
- 14% · China, Canada, South Korea
- Languages at home
- 84% English-only · Chinese 6% Other Indo-European 5% Other Asian/Pacific 2%
Political lean MEDSL · Broome
- 2024 margin
- Toss-up / Even · D 50.2% · R 49.8%
- 2008→2024 swing
- -7.6pp toward R · 2008: 8.0pp · 2024: 0.4pp
- All cycles
- 2024: D+0.4 2020: D+3.5 2016: R+3.7 2012: D+4.6 2008: D+8.0
Not yet ingested
- Civics
- —
Market trends
- HPI YoY
- ▼ -142.14%
- Current HPI
- 282.4645
- Rent YoY
- —
- Metro
- —
- State GDP YoY
- ▲ 2.60%
- F500 in state
- 92
Industry mix (Fortune 500 HQ in NY)
| Industry | F500 HQs | Revenue |
|---|---|---|
| Financial Services | 10 | $950B |
|
||
| Consumer Goods | 9 | $162B |
|
||
| Insurance | 4 | $225B |
|
||
| Telecommunications | 2 | $144B |
|
||
| Pharmaceuticals | 2 | $112B |
|
||
| Media / Entertainment | 2 | $69B |
|
||
Price history
+133.3% since first listed26 events — show timeline
- 2026-03-17 Relisted — GBAOR
- 2025-10-17 Pending — GBAOR
- 2025-08-01 Listed $175,000 GBAOR
- 2025-06-30 Listed $179,000 GBAOR
- 2025-01-10 Listed $179,900 GBAOR
- 2024-12-24 Rental Removed $2,000 GBAOR
- 2024-11-24 Price Changed $2,000 GBAOR
- 2024-10-18 Listed for Rent $2,100 GBAOR
- 2023-12-10 Rental Removed $2,000 GBAOR
- 2023-11-19 Price Changed $2,000 GBAOR
- 2023-11-11 Price Changed $2,150 GBAOR
- 2023-10-04 Listed for Rent $2,250 GBAOR
- 2023-08-14 Sold (MLS) $89,500 GBAOR
- 2023-06-20 Pending — GBAOR
- 2023-04-21 Listed $119,500 GBAOR
- 2022-12-05 Sold (MLS) $80,000 GBAOR
- 2022-10-29 Pending — GBAOR
- 2022-10-21 Price Changed $85,000 GBAOR
- 2022-10-19 Relisted — GBAOR
- 2022-10-06 Pending — GBAOR
- 2022-09-27 Price Changed $119,900 GBAOR
- 2022-09-10 Listed $134,900 GBAOR
- 2007-05-10 Sold (Public Records) $107,500 Public Records
- 2007-05-10 Sold (Public Records) $107,500 Public Records
- 2005-10-14 Sold (Public Records) $78,434 Public Records
- 2004-11-08 Sold (Public Records) $75,000 Public Records
Property tax history
+8.2%/yrLatest (2025): $9,004 · +71.9% YoY. Source: county tax records.
Cash-flow waterfall
monthlySold comps — $/sqft
last 12 mo · ≤1 miLoading sold comps…