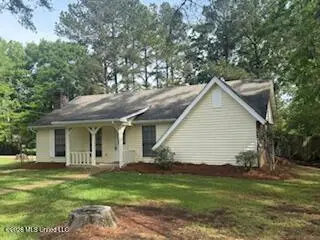
468 Pine Ridge Dr · Madison, MS
Flood risk 1/10 · Minimal
- FEMA flood zone
- X (unshaded)
- Chance of flooding over 30 yrs
- 0.0%
- Est. flood insurance / yr
- $507 – $1,088
Fire risk 1/10 · Minimal
- Est. fire insurance / yr
- $1,241 – $2,305
Heat risk 7/10 · Major
- Hot days now (above 108°F)
- 7 days/yr
- Hot days in 30 yrs
- 20 days/yr
Wind risk 8/10 · Major
- Chance of severe wind over 30 yrs
- 80.0%
Air-quality risk 2/10 · Minimal
- Unhealthy air days now
- 0 days/yr
- Unhealthy air days in 30 yrs
- 1 days/yr
Risk factors via First Street. Map © Google.
Why this score? — see what drove the C grade
The composite is a weighted blend of 9 inputs, each scored 0–100. Each bar is that input's sub-score; the figure is the points it added to the 100-point composite (weight × sub-score).
- Cash flow +23.2/30.0
- DSCR +7.5/10.0
- ARV discount +7.2/15.0
- 1% rule +5.3/10.0
- Schools +4.8/10.0
- Livability +4.0/5.0
- Rent growth +3.2/5.0
- Condition / age +2.5/5.0
- Appreciation +0.0/10.0
$258,500
🖨 Deal sheet 📄 Offer letter ✓ Due diligence
Listing remarks
A MUST SEE!!. . beautifully maintained, move-in ready home loaded with charm and functionality! Featuring a bright and spacious open floor plan, this home offers a warm and inviting living room anchored by a stunning brick fireplace, perfect for cozy evenings and entertaining guests. The spacious kitchen flows seamlessly into the dining area, creating the ideal setup for everyday living and special gatherings alike. Enjoy outdoor living year-round under the covered patio overlooking a private fenced backyard with plenty of space for pets, play, and weekend cookouts. Situated on a desirable corner lot with a side-entry garage, this home offers added curb appeal and convenience. Clean, spacio
Key facts
- Open floor plan
- Brick fireplace
- Covered patio
Tags
Property features AI
Exterior
- Parking: Attached 2-car garage; Driveway with paved surfaces; Garage faces side
- Utilities: Public water; Public sewer; Electricity available; Natural gas connected; Sewer connected; Water available
- Home design: Single family residence (house); One story; Move-in ready
- Construction: Brick construction; Architectural shingle roof; Slab foundation; Built (year source: assessor)
- Exterior features: Brick patio/porch and porch; Private yard; Back yard fencing
Interior
- Kitchen: Electric range; Range hood; Refrigerator
- Flooring: Luxury vinyl; Ceramic tile; Laminate
- Bathrooms: 2 full bathrooms
- Heating & cooling: Central electric heating; Central air conditioning; Ceiling fans
- Interior features: Electric range, range hood, refrigerator; Living room fireplace; Aluminum window frames; Laundry room
- Laundry & utility: Dedicated laundry room
Neighborhood map
What this means for you Summary
Snapshot
- This is a 3-bed/3.0-bath single-family listed at $258k.
Deal economics
- At list price, monthly cash flow is $471 ($6k/yr) — positive.
- The deal already cash-flows at list — no discount required.
- Meets the 1% rule at list price ($3k rent vs $258k).
- Recommended offer: $255k (1.5% below list) — sets the bar for market timing.
- Cap rate 8.5% vs local median 3.7% in Madison — top-decile yield for the area; either an underpriced asset or a hidden risk that comps aren't pricing in. Stress-test before assuming the spread holds.
Location & tenants
- Location reads 81/100 on livability (#4 in MS, #1,556 nationally) — a professional / high-income tenant draw. Strengths: crime A+, employment A+, housing A+; Watch: amenities D-, commute F.
- Madison County School District (rural): math 54% / reading 54% proficiency, ranked #3 of 130 in MS (top 2%) — acceptable for families but not a draw, mixed tenant base, ~2y average lease.
- Zoned schools: Madison Crossing Elementary (math 52% / reading 55%, grade C, #49 of 375 statewide, top 13%, 775 students, 100% FRL); Madison Middle School (math 66% / reading 57%, grade B+, #6 of 179 statewide, top 3%, 1,154 students, 100% FRL) — zoned schools average 100% FRL vs 29% district-wide (70 pts higher); higher-poverty schools than district average — tighter screening recommended.
- Market conditions: Rents rising (+2.6%/yr); 628 active listings in the ZIP; 2 comparable units currently listed for rent nearby; high-income renter base; 553 units permitted in Madison County in 2024 (0 in 5+ unit buildings).
Forward outlook
- Local home prices are declining (-3.0%/yr); year-one equity from $2k of loan paydown is wiped out by about $8k of value loss. Plan a longer hold.
- Madison County population projected at +34% by 2050 — long-run rental-demand tailwind backs the buy-and-hold thesis.
Negotiation context
- It's been on market 21 days — a 2% lower offer ($255k) is reasonable based on typical stale-listing flexibility.
Risks & watch-outs
- Climate carrying-cost: severe wind risk, 80% chance of damaging wind over 30y; extreme-heat days projected 7→20/yr by 2055 (HVAC capex compounding) — expect insurance premiums to compound above CPI over the hold.
Questions for the listing agent
- Built in 1978 — when were the roof, HVAC, electrical panel, plumbing, and water heater last replaced?
- Is there a deadline driving the sale (1031 exchange, divorce, estate, relocation)? That informs how much negotiation room exists.
- Schools are A-rated — typically a magnet for longer-tenancy family renters. What's the average tenant stay here, and is there a school-zone premium baked into asking?
- What's the average days-on-market for RENTAL listings here right now (not sales)? A rising rental-DOM trend means longer vacancies and softer asking-rent achievability than the comps imply.
- What's the recent tenant-quality profile in this submarket — average credit score on applications, eviction rate, late-payment / NSF rate, and stable-employment percentage? A property-management company in the area should have these aggregated.
- How much new for-sale + rental construction is in the pipeline within 1–3 miles? Heavy new supply typically softens prices + rents 12–24 months out; constrained supply supports both.
Investment metrics
- 1% rule
- 1.03% ✓
- Cap rate
- 8.48%
- Cash-on-cash
- 7.80%
- DSCR
- 1.35
- GRM
- 8.1
CMA / ARV
- ARV (on-the-fly)
- $256,704
- Comps found
- 12
Show comp detail 12 sales within ~0.75 mi
| Address | Dist | Beds/Ba | Sqft | Sold | Price | $/sf | Match |
|---|---|---|---|---|---|---|---|
| 112 Armonde Ct | 0.07mi | 2/2.5 (-1) | 1,563 (+2%) | 1mo | $259,000 | $166 | 85 |
| 429 S Pin Oak Dr | 0.14mi | 3/2.0 | 1,454 (-5%) | 3mo | $247,500 | $170 | 79 |
| 368 Post Oak Rd | 0.14mi | 3/2.0 | 1,470 (-4%) | 7mo | $250,000 | $170 | 77 |
| 104 Willow Ct | 0.13mi | 3/2.0 | 1,384 (-9%) | 2mo | $234,900 | $170 | 73 |
| 636 Live Oak Dr | 0.41mi | 3/2.0 | 1,474 (-4%) | 3mo | $249,000 | $169 | 69 |
| 143 Azalea Cir | 0.48mi | 3/2.0 | 1,582 (+4%) | 1mo | $265,000 | $168 | 66 |
| 209 Maplewood Dr | 0.19mi | 4/2.5 (+1) | 1,690 (+11%) | 10mo | $239,000 | $141 | 59 |
| 429 Brentwood Dr | 0.61mi | 3/2.0 | 1,535 (+0%) | 10mo | $255,000 | $166 | 59 |
| 520 Hunters Creek Cir | 0.27mi | 3/2.0 | 1,737 (+14%) | 3mo | $249,000 | $143 | 58 |
| 122 Eastwood Dr | 0.68mi | 3/2.0 | 1,474 (-4%) | 8mo | $245,000 | $166 | 52 |
| 119 Azalea Cir | 0.47mi | 3/2.0 | 1,724 (+13%) | 8mo | $273,500 | $159 | 46 |
| 143 Glenwood Dr | 0.72mi | 3/2.0 | 1,400 (-8%) | 9mo | $249,000 | $178 | 42 |
Match score weights: distance 35% · size 25% · config 20% · recency 20%. Top-matched comps best support the ARV.
Projected returns pro-forma
-3.0% appreciation · 2.61% rent growth · sell at horizon
- IRR
- -4.8%
- Equity multiple
- 0.82×
- Total profit
- $-13,013
- Equity at exit
- $38,543
- IRR
- 4.4%
- Equity multiple
- 1.32×
- Total profit
- $22,801
- Equity at exit
- $22,350
Cash invested: $72,380 (down + closing). Projections, not guarantees.
Landlord ↔ Tenant lean methodology
- Overall (STATE)
- 90 Strongly Landlord-Friendly
- State Mississippi
- 90 Strongly Landlord-Friendly · R+11
- County
- — inherits STATE
- City
- — inherits STATE
ZIP-level market 39110
- Home prices YoY
- -28.3%
- Rents YoY
- 2.6%
- Active inventory
- 628
- Price-to-rent
- 8.1×
Monthly cashflow live
- Estimated rent
- $2,660 medium interval (Pro) →
- Mortgage (P&I)
- −$1,356
- Tax from tax record
- −$167 /mo · $2,006/yr
- Insurance
- −$108
- HOA
- −$0
- Vacancy / Maint / Mgmt
- −$559
- Net cashflow
- $471
Break-even live
UW: 25.0% down · 7.5% · 30yr · 1.5% tax · 5.0% vac · 8.0% maint · 8.0% mgmt
Financing live
Cash to close
- Down payment
- $64,625
- Closing costs
- $7,755
- Reserves months
- —
- Total cash needed
- —
Loan-product check · same deal, 3 products live
Conventional
25% down · 7.5% · 30yr
- Down + closing
- —
- Monthly P&I
- —
- Monthly cashflow
- —
- DSCR
- —
- Eligible?
- —
Personal DTI + credit; lowest rate.
DSCR
20% down · 8.5% · 30yr
- Down + closing
- —
- Monthly P&I
- —
- Monthly cashflow
- —
- DSCR
- —
- Eligible?
- —
No personal income docs; deal must DSCR.
Hard money
10% down · 12.0% · 12mo
- Down + closing
- —
- Monthly P&I
- —
- Monthly cashflow
- —
- DSCR
- —
- Eligible?
- —
Short-term bridge; refi at stabilization.
Rent comps 2 comps
| Address | Beds | Baths | Sqft | Rent | $/sqft | DOM | Units | Dist |
|---|---|---|---|---|---|---|---|---|
| 1011 Mcdale Ln Madison, MS | 4.0 | 2.0 | 2036 | $2,500 | $1.23 | 43d | 1 | 0.89mi |
| 345 Avonlea Ln Madison, MS | 3.0 | 2.0 | 2185 | $2,500 | $1.14 | 43d | 1 | 1.11mi |
Listing history 16 events
-
2026-06-18days on market $258,500 Active 21 DOM
-
2026-06-17days on market $258,500 Active 20 DOM
-
2026-06-16days on market $258,500 Active 19 DOM
-
2026-06-15days on market $258,500 Active 18 DOM
-
2026-06-14days on market $258,500 Active 16 DOM
-
2026-06-10days on market $258,500 Active 13 DOM
-
2026-06-09days on market $258,500 Active 12 DOM
-
2026-06-08days on market $258,500 Active 11 DOM
-
2026-06-07days on market $258,500 Active 10 DOM
-
2026-06-03days on market $258,500 Active 6 DOM
-
2026-06-02days on market $258,500 Active 5 DOM
-
2026-06-01days on market $258,500 Active 4 DOM
-
2026-05-31days on market $258,500 Active 3 DOM
-
2026-05-30days on market $258,500 Active 2 DOM
-
2026-05-28$258,500 Active
-
1989-08-09soldstatus
ⓘ Source: listings_history table (triggers on properties + properties_extension) + one-shot
backfill from property_details.listing_events for pre-trigger history.
Tax reassessment forecast MS · Resets to sale price
- Current annual tax
- $2,006 · $167/mo
- Projected year-2 tax
- $2,042 · $170/mo
- Expected delta
- +$36/yr (+$3/mo · 1.8%)
ⓘ Screening estimate from a state-policy table — verify with the county assessor before closing.
Climate risk First Street
- Flood 1/10 Low FEMA zone X (unshaded) · 0% chance over 30 yrs
- Wildfire 1/10 Low
- Heat 7/10 Severe 7 d/yr ≥108°F today · 20 d/yr by 30 yrs out
- Wind 8/10 Severe 80% chance of damaging wind over 30 yrs
- Air quality 2/10 Low 0 unhealthy d/yr today · 1 by 30 yrs out
Nearby sold comps map
Loading sold comps map…
Walkable amenities ~0.75 mi
Loading nearby amenities…
Taxation est. · year 1
- Rental income
- $31,915
- − Mortgage interest
- −$14,480
- − Property taxes
- −$2,006
- − Insurance
- −$1,292
- − Repairs & maintenance
- −$2,553
- − Management
- −$2,553
- − Depreciation
- −$7,520
- Taxable income
- $1,510
- Est. tax owed @ 24.0%
- −$362
- After-tax cash flow
- $5,284/yr
For passive investors: Depreciation is non-cash, so a rental often shows a tax loss while cash-flowing — sheltering income. Rental losses are passive: they offset passive income freely, and up to $25,000/yr can offset ordinary (W-2) income if you actively participate and your MAGI is under $100k (phasing out to $0 by $150k); unused losses carry forward. On sale, claimed depreciation is recaptured at up to 25%, and gains may owe capital-gains tax (a 1031 exchange can defer both). Figures are a year-1 estimate at your 24.0% rate — not tax advice; consult a CPA.
Schools (NCES district)
- District
- Madison County School District
- NCES district ID
- 2802790
- Math proficiency
- 54% ▼ -7.00%
- Reading proficiency
- 54% ▼ -7.00%
- Median HH income
- $70,579
- Composite
- 48.08/100
- National rank
- #2188
- State rank
- #3 of 130 in MS
Livability — Madison
- Score
- 81/100
- State rank
- #4
- US rank
- #1556
Category grades
Schools grade is shown separately in the Schools card above.
Census & demographics
- Census place
- Madison, MS
- County
- Madison County · 75,005 people
- City population
- 50,443
- Metro
- Jackson, MS
- Population (ZIP)
- 50,443
- Household income
- $125,506
- Rent vs Own
- Severe rent burden
- 227.0
Population outlook (Madison County) Hauer SSP2
- Today (2025)
- 122,509 people
- By 2030
- 131,737 · +7.5%
- By 2040
- 148,930 · +21.6%
- By 2050
- 164,300 · +34.1%
- By 2075
- 197,495 · +61.2%
- By 2100
- 211,429 · +72.6%
Race, ethnicity, and origin ACS 2023
- Neighborhood character
- Predominantly White (76%)
- Race & ethnicity
- White 76% Black 15% Asian 4% Two or more races 3% Hispanic / Latino 2%
- Common ancestry
- Italian 6% Slovak 3% Lithuanian 3%
- Foreign-born
- 5% · China, Canada
- Languages at home
- 92% English-only · Spanish 2% Other Indo-European 2% Chinese 1%
Political lean MEDSL · Madison
- 2024 margin
- R (+17.3) · D 40.8% · R 58.0% · Other 1.2%
- 2008→2024 swing
- -1.7pp toward R · 2008: -15.6pp · 2024: -17.3pp
- All cycles
- 2024: R+17.3 2020: R+11.8 2016: R+16.1 2012: R+15.7 2008: R+15.6
Not yet ingested
- Civics
- —
Market trends
- HPI YoY
- ▼ -60.99%
- Current HPI
- 154.6909
- Rent YoY
- ▲ 2.61%
- Metro
- Jackson, MS
- State GDP YoY
- —
- F500 in state
- 0
Price history
2 events — show timeline
- 2026-05-28 Listed $258,500 MLSU
- 1989-08-09 Sold (Public Records) — Public Records
Property tax history
+5.6%/yrLatest (2025): $2,006 · +0.0% YoY. Source: county tax records.
Cash-flow waterfall
monthlySold comps — $/sqft
last 12 mo · ≤1 miLoading sold comps…