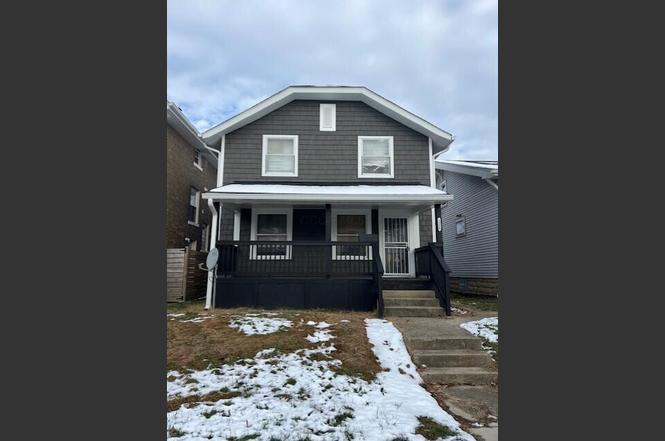
1250 Hildreth Ave · Columbus, OH
Flood risk 1/10 · Minimal
- FEMA flood zone
- X (unshaded)
- Chance of flooding over 30 yrs
- 0.0%
- Est. flood insurance / yr
- $473 – $860
Fire risk 1/10 · Minimal
- Est. fire insurance / yr
- $713 – $1,323
Heat risk 4/10 · Minor
- Hot days now (above 100°F)
- 7 days/yr
- Hot days in 30 yrs
- 18 days/yr
Wind risk 2/10 · Minimal
- Chance of severe wind over 30 yrs
- 1.0%
Air-quality risk 3/10 · Minor
- Unhealthy air days now
- 2 days/yr
- Unhealthy air days in 30 yrs
- 4 days/yr
Risk factors via First Street. Map © Google.
Why this score? — see what drove the B+ grade
The composite is a weighted blend of 9 inputs, each scored 0–100. Each bar is that input's sub-score; the figure is the points it added to the 100-point composite (weight × sub-score).
- Cash flow +30.0/30.0
- ARV discount +15.0/15.0
- DSCR +10.0/10.0
- 1% rule +8.3/10.0
- Livability +4.0/5.0
- Rent growth +3.8/5.0
- Condition / age +2.5/5.0
- Schools +1.7/10.0
- Appreciation +0.0/10.0
$124,500
🖨 Deal sheet 📄 Offer letter ✓ Due diligence
Listing remarks
Instant equity - Take advantage of this under market value home in an up and coming area of Columbus. Many examples of homes selling at higher values just a stone throw away from this home. Newer siding and gutters - 10 year old roof - newer electric panel - full basement . Close to churches and schools. 3 BR and 1 bath.
Key facts
- Newer electric panel
- Up and coming area
- Newer siding
Tags
Neighborhood map
What this means for you Summary
Snapshot
- This is a 3-bed/1.0-bath single-family listed at $124k.
Deal economics
- At list price, monthly cash flow is $479 ($6k/yr) — positive.
- The deal already cash-flows at list — no discount required.
- Meets the 1% rule at list price ($2k rent vs $124k).
- Recommended offer: $110k (12.0% below list) — sets the bar for market timing.
- Cap rate 10.9% vs local median 3.8% in Columbus — top-decile yield for the area; either an underpriced asset or a hidden risk that comps aren't pricing in. Stress-test before assuming the spread holds.
Location & tenants
- Location reads 81/100 on livability (#97 in OH, #1,491 nationally) — a professional / high-income tenant draw. Strengths: commute A+, cost of living A+, housing A+; Watch: employment C-, crime F.
- Columbus City School District (urban): math 15% / reading 26% proficiency, ranked #626 of 656 in OH (top 95%) — low school quality limits family demand, transient renter base, plan for 1-2y turnover; 72% free/reduced lunch — lower-income household profile, screen leases tightly.
- Market conditions: Rents rising fast (+5.0%/yr); 94 active listings in the ZIP; 40 comparable units currently listed for rent nearby; rentals at typical pace (median 20d on market — plan ~3-4 weeks tenant-placement turnaround); 8,139 units permitted in Franklin County in 2024 (5,940 in 5+ unit buildings).
- This rent runs 42% of the median local income ($48k/yr) — at the standard rent-burdened threshold; future hikes will face affordability resistance.
Forward outlook
- Local home prices are declining (-3.0%/yr); year-one equity from $861 of loan paydown is wiped out by about $4k of value loss. Plan a longer hold.
- Franklin County population projected at +34% by 2050 — long-run rental-demand tailwind backs the buy-and-hold thesis.
- At projected returns (-3.0% appreciation + 5.0% rent growth), your $35k cash investment doubles in ~7 years — after that, you're playing with house money.
Negotiation context
- It's been on market 134 days — a 12% lower offer ($110k) is reasonable based on typical stale-listing flexibility.
- 4 sale attempts since 25y ago; this cycle's ask has dropped $35k (22%) from the opening price — seller is motivated, your offer sets the floor, not the list.
- Current owner paid $28k; list at $124k implies a 346% gain — meaningful room to come down on a strong offer.
Risks & watch-outs
- Watch-outs: built in 1900 — expect roof / HVAC / electrical / plumbing capex.
Questions for the listing agent
- It's been on market 134 days. Have you received any prior offers? Is the seller open to a 12% concession, seller financing, or rate buy-down credit?
- Built in 1900 — when were the roof, HVAC, electrical panel, plumbing, and water heater last replaced?
- Why hasn't it sold? Are there any deal-killer items the seller is aware of (foundation, flood, title, zoning, code violations)?
- Is there a deadline driving the sale (1031 exchange, divorce, estate, relocation)? That informs how much negotiation room exists.
- Crime grade is F in this area — have there been break-ins, vandalism, or insurance claims at this property in the last 3 years? What carrier currently insures it and at what premium?
- What's the average days-on-market for RENTAL listings here right now (not sales)? A rising rental-DOM trend means longer vacancies and softer asking-rent achievability than the comps imply.
- What's the recent tenant-quality profile in this submarket — average credit score on applications, eviction rate, late-payment / NSF rate, and stable-employment percentage? A property-management company in the area should have these aggregated.
- How much new for-sale + rental construction is in the pipeline within 1–3 miles? Heavy new supply typically softens prices + rents 12–24 months out; constrained supply supports both.
Investment metrics
- 1% rule
- 1.33% ✓
- Cap rate
- 10.91%
- Cash-on-cash
- 16.48%
- DSCR
- 1.73
- GRM
- 6.2
CMA / ARV
- ARV (on-the-fly)
- $228,384
- Comps found
- 12
Show comp detail 12 sales within ~0.75 mi
| Address | Dist | Beds/Ba | Sqft | Sold | Price | $/sf | Match |
|---|---|---|---|---|---|---|---|
| 1250 Hildreth Ave | 0.00mi | 3/1.0 | 1,248 (0%) | 1mo | $105,000 | $84 | 99 |
| 463 Fairfield Ave | 0.15mi | 3/1.5 | 1,184 (-5%) | 4mo | $236,175 | $199 | 79 |
| 1221 Atcheson St | 0.05mi | 3/1.0 | 1,080 (-14%) | 10mo | $136,000 | $126 | 67 |
| 468 Sawyer Blvd | 0.40mi | 3/1.5 | 1,314 (+5%) | 10mo | $268,000 | $204 | 63 |
| 1389 Hildreth Ave | 0.20mi | 3/1.5 | 1,368 (+10%) | 12mo | $250,000 | $183 | 62 |
| 528 Bassett Ave | 0.39mi | 3/1.0 | 1,158 (-7%) | 10mo | $160,000 | $138 | 61 |
| 1483 Mount Vernon Ave | 0.34mi | 3/1.0 | 1,421 (+14%) | 4mo | $110,000 | $77 | 58 |
| 288 Johnson St | 0.37mi | 2/2.5 (-1) | 1,297 (+4%) | 10mo | $215,000 | $166 | 57 |
| 156 Winner Ave | 0.34mi | 3/1.5 | 1,083 (-13%) | 4mo | $245,000 | $226 | 56 |
| 777 Mayme Moore Pl | 0.68mi | 3/1.5 | 1,232 (-1%) | 10mo | $267,000 | $217 | 56 |
| 1495 Atcheson St | 0.37mi | 3/1.0 | 1,071 (-14%) | 11mo | $110,000 | $103 | 50 |
| 1090 Fair Ave | 0.71mi | 2/1.5 (-1) | 1,415 (+13%) | 5mo | $386,000 | $273 | 33 |
Match score weights: distance 35% · size 25% · config 20% · recency 20%. Top-matched comps best support the ARV.
Projected returns pro-forma
-3.0% appreciation · 5.03% rent growth · sell at horizon
- IRR
- 9.8%
- Equity multiple
- 1.40×
- Total profit
- $13,790
- Equity at exit
- $18,563
- IRR
- 20.5%
- Equity multiple
- 2.90×
- Total profit
- $66,108
- Equity at exit
- $10,764
Cash invested: $34,860 (down + closing). Projections, not guarantees.
Landlord ↔ Tenant lean methodology
- Overall (STATE)
- 73 Landlord-Friendly
- State Ohio
- 73 Landlord-Friendly · R+6
- County
- — inherits STATE
- City
- — inherits STATE
ZIP-level market 43203
- Home prices YoY
- -31.9%
- Rents YoY
- 5.0%
- Active inventory
- 94
- Price-to-rent
- 6.2×
Monthly cashflow live
- Estimated rent
- $1,660 high interval (Pro) →
- Mortgage (P&I)
- −$653
- Tax from tax record
- −$128 /mo · $1,536/yr
- Insurance
- −$52
- HOA
- −$0
- Vacancy / Maint / Mgmt
- −$349
- Net cashflow
- $479
Break-even live
UW: 25.0% down · 7.5% · 30yr · 1.5% tax · 5.0% vac · 8.0% maint · 8.0% mgmt
Financing live
Cash to close
- Down payment
- $31,125
- Closing costs
- $3,735
- Reserves months
- —
- Total cash needed
- —
Loan-product check · same deal, 3 products live
Conventional
25% down · 7.5% · 30yr
- Down + closing
- —
- Monthly P&I
- —
- Monthly cashflow
- —
- DSCR
- —
- Eligible?
- —
Personal DTI + credit; lowest rate.
DSCR
20% down · 8.5% · 30yr
- Down + closing
- —
- Monthly P&I
- —
- Monthly cashflow
- —
- DSCR
- —
- Eligible?
- —
No personal income docs; deal must DSCR.
Hard money
10% down · 12.0% · 12mo
- Down + closing
- —
- Monthly P&I
- —
- Monthly cashflow
- —
- DSCR
- —
- Eligible?
- —
Short-term bridge; refi at stabilization.
Rent comps 40 comps
| Address | Beds | Baths | Sqft | Rent | $/sqft | DOM | Units | Dist |
|---|---|---|---|---|---|---|---|---|
| 1216 Atcheson St Columbus, OH | 3.0 | 2.0 | 1092 | $1,550 | $1.42 | 3d | 1 | 0.08mi |
| 1308-1310 Mount Vernon Ave Unit 1308 Columbus, OH | 3.0 | 2.0 | 1400 | $1,695 | $1.21 | 44d | 1 | 0.10mi |
| 250 N 21st St Columbus, OH | 3.0 | 2.5 | 1452 | $2,600 | $1.79 | 44d | 1 | 0.27mi |
| 1001 Atcheson St Columbus, OH | 1.0–2.0 | 1.0 | 821 | $1,295 | $1.58 | 2d | 16 | 0.37mi |
| 60-66 Winner Ave Columbus, OH | 2.0 | 1.0 | 1500 | $1,250 | $0.83 | 17d | 1 | 0.47mi |
| 476 Taylor Ave Columbus, OH | 1.0–2.0 | 1.0–2.0 | 699 | $1,695 | $2.42 | 3d | 8 | 0.50mi |
| 1608 Greenway Ave Columbus, OH | 2.0 | 2.0 | 900 | $1,299 | $1.44 | 16d | 1 | 0.51mi |
| 1608 Greenway Ave Columbus, OH | 2.0 | 2.0 | 900 | $1,899 | $2.11 | 17d | 1 | 0.51mi |
| 61 N 21st St Unit J Columbus, OH | 2.0 | 1.0 | 738 | $995 | $1.35 | 44d | 1 | 0.53mi |
| 64 N 20th St Columbus, OH | 2.0 | 1.0 | 1400 | $1,495 | $1.07 | 7d | 1 | 0.55mi |
| 58-64 N 20th St Columbus, OH | 2.0 | 1.0 | 1100 | $1,495 | $1.36 | 7d | 1 | 0.55mi |
| 62 N 20th St Columbus, OH | 3.0 | 1.0 | 1100 | $1,595 | $1.45 | 44d | 1 | 0.55mi |
| 439 Eldridge Ave Unit 439 Columbus, OH | 3.0 | 1.0 | 946 | $1,200 | $1.27 | 24d | 1 | 0.58mi |
| 1614 Clifton Ave Unit 1620 Columbus, OH | 2.0 | 1.0 | 875 | $1,349 | $1.54 | 24d | 1 | 0.58mi |
| 1445 E Broad St Columbus, OH | 1.0–5.0 | 1.0–5.0 | 2164 | $2,170 | $1.00 | 2d | 4 | 0.67mi |
| 1544 E Broad St Unit 1544-303 Columbus, OH | 2.0 | 1.0 | 875 | $1,122 | $1.28 | 7d | 1 | 0.68mi |
| 1544 E Broad St Unit 303 Columbus, OH | 2.0 | 1.0 | 875 | $1,122 | $1.28 | 44d | 1 | 0.68mi |
| 1550 E Broad St Columbus, OH | 2.0 | 1.0 | 875 | $1,175 | $1.34 | 44d | 1 | 0.68mi |
| 973 E Broad St #3 Columbus, OH | 2.0 | 1.0 | 780 | $1,500 | $1.92 | 17d | 1 | 0.70mi |
| 820 E Long St Columbus, OH | 2.0 | 1.0–2.0 | 888 | $1,810 | $2.04 | 2d | 23 | 0.72mi |
| 1444 Madison Ave Unit B Columbus, OH | 2.0 | 1.0 | 800 | $1,165 | $1.46 | 21d | 1 | 0.72mi |
| 1620 E Broad St Columbus, OH | 2.0 | 2.0 | 1214 | $2,025 | $1.67 | 3d | 2 | 0.74mi |
| 1620 E Broad St #408 Columbus, OH | 2.0 | 2.0 | 1247 | $2,150 | $1.72 | 24d | 1 | 0.74mi |
| 1309 Fair Ave Columbus, OH | 2.0 | 1.0 | 850 | $1,050 | $1.24 | 7d | 1 | 0.75mi |
| 143 Sherman Ave Columbus, OH | 2.0 | 1.0 | 919 | $1,588 | $1.73 | 24d | 2 | 0.77mi |
| 151 Sherman Ave #102 Columbus, OH | 2.0 | 1.0 | 970 | $1,675 | $1.73 | 24d | 1 | 0.78mi |
| 151 Sherman Ave Unit 101 Columbus, OH | 2.0 | 1.0 | 981 | $1,675 | $1.71 | 21d | 1 | 0.78mi |
| 151 Sherman Ave Unit 101 Columbus, OH | 2.0 | 1.0 | 981 | $1,675 | $1.71 | 24d | 1 | 0.78mi |
| 1096 Oak St Columbus, OH | 2.0 | 2.5 | 1487 | $2,099 | $1.41 | 3d | 1 | 0.78mi |
| 700 E Long St Columbus, OH | 1.0–2.0 | 1.0–2.0 | 790 | $2,160 | $2.73 | 2d | 29 | 0.83mi |
| 1109 Franklin Ave Unit 1109 Columbus, OH | 2.0 | 1.0 | 1200 | $1,350 | $1.12 | 44d | 1 | 0.86mi |
| 1117-1119 Franklin Ave Columbus, OH | 3.0 | 1.0 | 1288 | $1,525 | $1.18 | 44d | 1 | 0.86mi |
| 1740 E Broad St Columbus, OH | 2.0 | 1.0 | 1200 | $1,500 | $1.25 | 24d | 1 | 0.86mi |
| 866 E Starr Ave Columbus, OH | 2.0 | 1.0 | 1168 | $1,600 | $1.37 | 44d | 1 | 0.87mi |
| 848 Oak St Columbus, OH | 3.0 | 1.5 | 1428 | $1,700 | $1.19 | 44d | 1 | 0.88mi |
| 830 Oak St Columbus, OH | 3.0 | 2.5 | 1451 | $2,500 | $1.72 | 7d | 1 | 0.89mi |
| 750 E Broad St Columbus, OH | 1.0–2.0 | 1.0–2.0 | 838 | $1,699 | $2.03 | 3d | 6 | 0.89mi |
| 830 Oak St Unit 830 Columbus, OH | 3.0 | 2.5 | 1450 | $2,500 | $1.72 | 20d | 1 | 0.89mi |
| 834 Oak St Columbus, OH | 3.0 | 2.5 | 1400 | $2,500 | $1.79 | 7d | 1 | 0.89mi |
| 834 Oak St Unit 834 Columbus, OH | 3.0 | 2.5 | 1450 | $2,500 | $1.72 | 20d | 1 | 0.89mi |
Listing history 12 events
-
2026-04-27status Pending
-
2026-04-22price $124,500
-
2026-03-12status Active
-
2026-03-08status Pending
-
2026-02-25status Active
-
2026-02-25price $129,950
-
2026-02-23status Pending
-
2025-12-08$159,950 Active
-
2001-09-08historical
-
2001-04-04$47,000
-
1988-09-29soldstatus $27,900
-
1980-08-01soldstatus $20,000
ⓘ Source: listings_history table (triggers on properties + properties_extension) + one-shot
backfill from property_details.listing_events for pre-trigger history.
Tax reassessment forecast OH · Partial reset (capped growth)
- Current annual tax
- $1,536 · $128/mo
- Projected year-2 tax
- $1,739 · $145/mo
- Expected delta
- +$203/yr (+$17/mo · 13.2%)
ⓘ Screening estimate from a state-policy table — verify with the county assessor before closing.
Climate risk First Street
- Flood 1/10 Low FEMA zone X (unshaded) · 0% chance over 30 yrs
- Wildfire 1/10 Low
- Heat 4/10 Moderate 7 d/yr ≥100°F today · 18 d/yr by 30 yrs out
- Wind 2/10 Low 100% chance of damaging wind over 30 yrs
- Air quality 3/10 Moderate 2 unhealthy d/yr today · 4 by 30 yrs out
Nearby sold comps map
Loading sold comps map…
Walkable amenities ~0.75 mi
Loading nearby amenities…
Taxation est. · year 1
- Rental income
- $19,923
- − Mortgage interest
- −$6,974
- − Property taxes
- −$1,536
- − Insurance
- −$622
- − Repairs & maintenance
- −$1,594
- − Management
- −$1,594
- − Depreciation
- −$3,622
- Taxable income
- $3,981
- Est. tax owed @ 24.0%
- −$955
- After-tax cash flow
- $4,790/yr
For passive investors: Depreciation is non-cash, so a rental often shows a tax loss while cash-flowing — sheltering income. Rental losses are passive: they offset passive income freely, and up to $25,000/yr can offset ordinary (W-2) income if you actively participate and your MAGI is under $100k (phasing out to $0 by $150k); unused losses carry forward. On sale, claimed depreciation is recaptured at up to 25%, and gains may owe capital-gains tax (a 1031 exchange can defer both). Figures are a year-1 estimate at your 24.0% rate — not tax advice; consult a CPA.
Schools (NCES district)
- District
- Columbus City School District
- NCES district ID
- 3904380
- Math proficiency
- 15% ▼ -17.00%
- Reading proficiency
- 26% ▼ -12.00%
- Median HH income
- $38,483
- Composite
- 17.19/100
- National rank
- #9105
- State rank
- #626 of 656 in OH
Livability — Columbus
- Score
- 81/100
- State rank
- #97
- US rank
- #1491
Category grades
Schools grade is shown separately in the Schools card above.
Census & demographics
- Census place
- Columbus, OH
- County
- Franklin County · 1,351,780 people
- City population
- 612,189
- Metro
- Columbus, OH
- Population (ZIP)
- 8,618
- Household income
- $47,572
- Rent vs Own
- Severe rent burden
- 859.0
Population outlook (Franklin County) Hauer SSP2
- Today (2025)
- 1,456,139 people
- By 2030
- 1,556,890 · +6.9%
- By 2040
- 1,757,349 · +20.7%
- By 2050
- 1,950,539 · +34.0%
- By 2075
- 2,376,171 · +63.2%
- By 2100
- 2,636,796 · +81.1%
Race, ethnicity, and origin ACS 2023
- Neighborhood character
- Diverse neighborhood (Simpson 0.56)
- Race & ethnicity
- Black 59% White 29% Two or more races 8% Hispanic / Latino 2% Asian 2%
- Common ancestry
- Lithuanian 1% Romanian 1% Swiss 1%
- Foreign-born
- 12% · Canada
- Languages at home
- 86% English-only · Other Indo-European 1% Spanish 1% French/Haitian/Cajun 1%
Political lean MEDSL · Franklin
- 2024 margin
- Strong D (+28.4) · D 63.7% · R 35.3% · Other 1.0%
- 2008→2024 swing
- +7.7pp toward D · 2008: 20.7pp · 2024: 28.4pp
- All cycles
- 2024: D+28.4 2020: D+31.4 2016: D+25.9 2012: D+21.7 2008: D+20.7
Not yet ingested
- Civics
- —
Market trends
- HPI YoY
- ▼ -102.09%
- Current HPI
- 217.3929
- Rent YoY
- ▲ 5.03%
- Metro
- Columbus, OH
- State GDP YoY
- ▲ 1.98%
- F500 in state
- 48
Industry mix (Fortune 500 HQ in OH)
| Industry | F500 HQs | Revenue |
|---|---|---|
| Insurance | 3 | $145B |
|
||
| Industrial Machinery | 3 | $49B |
|
||
| Financial Services | 3 | $24B |
|
||
| Consumer Goods | 2 | $93B |
|
||
| Aerospace / Defense | 2 | $47B |
|
||
| Utilities | 2 | $33B |
|
||
Price history
+522.5% since first listed12 events — show timeline
- 2026-04-27 Pending — CBRMLS
- 2026-04-22 Price Changed $124,500 CBRMLS
- 2026-03-12 Relisted — CBRMLS
- 2026-03-08 Pending — CBRMLS
- 2026-02-25 Relisted — CBRMLS
- 2026-02-25 Price Changed $129,950 CBRMLS
- 2026-02-23 Pending — CBRMLS
- 2025-12-08 Listed $159,950 CBRMLS
- 2001-09-08 Listing Removed — CBRMLS
- 2001-04-04 Listed $47,000 CBRMLS
- 1988-09-29 Sold (Public Records) $27,900 Public Records
- 1980-08-01 Sold (Public Records) $20,000 Public Records
Property tax history
-7.1%/yrLatest (2024): $1,536 · -33.5% YoY. Source: county tax records.
Cash-flow waterfall
monthlySold comps — $/sqft
last 12 mo · ≤1 miLoading sold comps…