12 Petersson Cir · Crystal Lake, CT
Flood risk 1/10 · Minimal
- FEMA flood zone
- X
- Chance of flooding over 30 yrs
- 0.0%
- Est. flood insurance / yr
- $473 – $860
Fire risk 4/10 · Minor
- Est. fire insurance / yr
- $829 – $1,539
Heat risk 3/10 · Minor
- Hot days now (above 93°F)
- 7 days/yr
- Hot days in 30 yrs
- 16 days/yr
Wind risk 6/10 · Moderate
- Chance of severe wind over 30 yrs
- 27.0%
Air-quality risk 3/10 · Minor
- Unhealthy air days now
- 2 days/yr
- Unhealthy air days in 30 yrs
- 4 days/yr
Risk factors via First Street. Map © Google.
Why this score? — see what drove the D- grade
The composite is a weighted blend of 9 inputs, each scored 0–100. Each bar is that input's sub-score; the figure is the points it added to the 100-point composite (weight × sub-score).
- ARV discount +15.0/15.0
- Cash flow +7.7/30.0
- Schools +3.6/10.0
- Livability +3.4/5.0
- 1% rule +2.7/10.0
- Rent growth +2.5/5.0
- Condition / age +2.5/5.0
- DSCR +1.8/10.0
- Appreciation +0.0/10.0
$220,000
🖨 Deal sheet 📄 Offer letter ✓ Due diligence
Listing remarks MLS
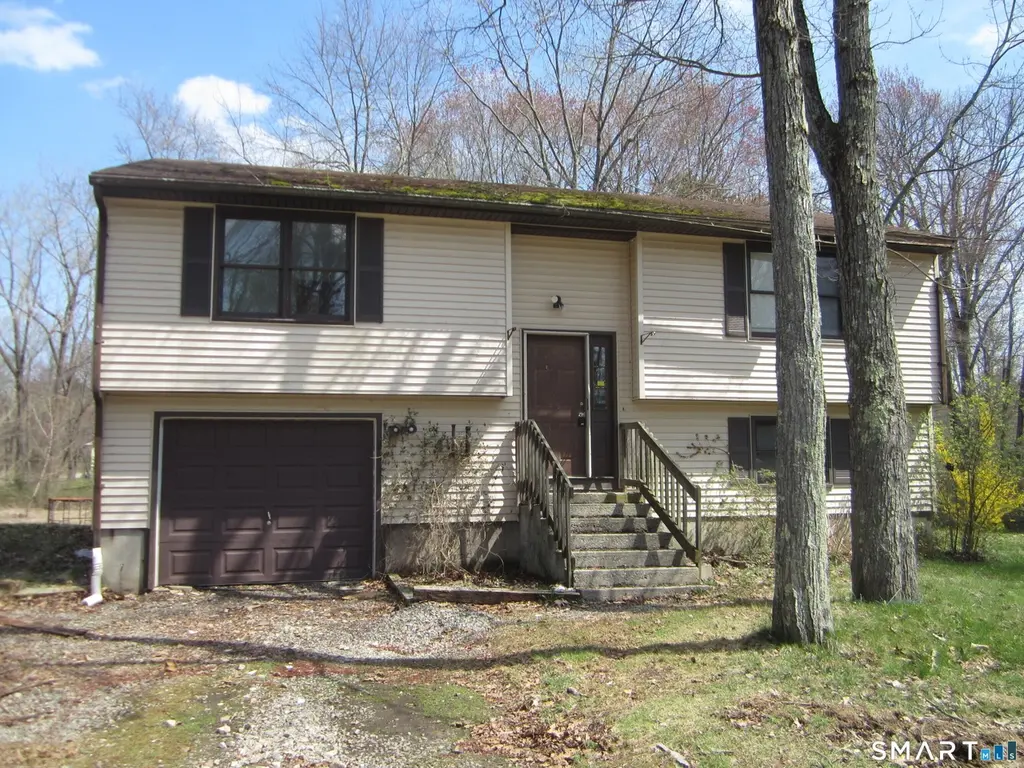
Outdoor enthusiasts welcome - just minutes from Crystal Lake, Shenipsit State Forest, and Soapstone Mountain for outdoor activities. This raised ranch on a 1.39 acre corner lot in a quiet neighborhood. One car garage under. Shed for storage. Third bedroom is in the lower level., there is also potential for a den/family room in the lower level. Large, open, eat-in kitchen. Nestled in between Soapstone Mountain and Crystal Lake.
Key facts
- Shed for storage
- Open eat-in kitchen
- Quiet neighborhood
Tags
Neighborhood map
What this means for you Summary
Snapshot
- This is a 3-bed/1.0-bath single-family listed at $220k.
Deal economics
- At list price, monthly cash flow is $-255 ($-3k/yr) — negative.
- To cash-flow at today's rent, offer at most $175k (20.5% below list).
- To meet the 1% rule (rent ≥ 1% of price), the offer needs to be $170k (22.8% below list).
- Recommended offer: $170k (22.8% below list) — sets the bar for 1% rule.
- Cap rate 4.9% vs local median 2.5% in Crystal Lake — top-decile yield for the area; either an underpriced asset or a hidden risk that comps aren't pricing in. Stress-test before assuming the spread holds.
Location & tenants
- Location reads 68/100 on livability (#110 in CT) — a middle-class / working-renter tenant base. Strengths: crime A+, employment A+, housing A+; Watch: amenities F, commute F, cost of living F.
- Stafford School District (town): math 33% / reading 48% proficiency, ranked #99 of 153 in CT (top 65%) — families likely to look elsewhere, expect single-tenant / working-renter base with shorter leases.
- Market conditions: 72 active listings in the ZIP; 1,867 units permitted in Capitol Planning Region in 2024 (1,399 in 5+ unit buildings).
Forward outlook
- Local home prices are declining (-3.0%/yr); year-one equity from $2k of loan paydown is wiped out by about $7k of value loss. Plan a longer hold.
Negotiation context
- It's been on market 34 days — a 3% lower offer ($213k) is reasonable based on typical stale-listing flexibility.
- 3 sale attempts since 25y ago with the ask held roughly flat each time — persistent listings suggest the price (not the market) is what's stuck; bring a comps-based counter.
- Current owner paid $112k; list at $220k implies a 97% gain — meaningful room to come down on a strong offer.
Risks & watch-outs
- Climate carrying-cost: major wind risk, 27% chance of damaging wind over 30y — expect insurance premiums to compound above CPI over the hold.
Questions for the listing agent
- What do current leases actually rent for vs. the listed asking? Can we see a recent rent roll and the last 12 months of T-12 income?
- It's been on market 34 days. Have you received any prior offers? Is the seller open to a 23% concession, seller financing, or rate buy-down credit?
- Is there a deadline driving the sale (1031 exchange, divorce, estate, relocation)? That informs how much negotiation room exists.
- Schools are B-rated — typically a magnet for longer-tenancy family renters. What's the average tenant stay here, and is there a school-zone premium baked into asking?
- The area grade is low — what's the realistic commute time and amenity access for the typical tenant pool here? Any planned neighborhood developments (good or bad) we should know about?
- What's the average days-on-market for RENTAL listings here right now (not sales)? A rising rental-DOM trend means longer vacancies and softer asking-rent achievability than the comps imply.
- What's the recent tenant-quality profile in this submarket — average credit score on applications, eviction rate, late-payment / NSF rate, and stable-employment percentage? A property-management company in the area should have these aggregated.
- How much new for-sale + rental construction is in the pipeline within 1–3 miles? Heavy new supply typically softens prices + rents 12–24 months out; constrained supply supports both.
Investment metrics
- 1% rule
- 0.77% ✗
- Cap rate
- 4.90%
- Cash-on-cash
- -4.98%
- DSCR
- 0.78
- GRM
- 10.8
CMA / ARV
- ARV (median comp)
- $341,267
- List price
- $220,000
- Delta
- -35.53%
- Verdict
- UNDERPRICED
- Comps
- 19 within 1.0 mi
Show comp detail 3 sales within ~0.75 mi
| Address | Dist | Beds/Ba | Sqft | Sold | Price | $/sf | Match |
|---|---|---|---|---|---|---|---|
| 12 Spusta Rd | 0.15mi | 3/1.5 | 1,092 (+10%) | 10mo | $340,000 | $311 | 66 |
| 41 Spusta Rd | 0.19mi | 3/1.0 | 1,132 (+14%) | 20mo | $300,000 | $265 | 52 |
| 51 Gulf Rd | 0.63mi | 3/1.0 | 1,128 (+14%) | 20mo | $275,000 | $244 | 32 |
Match score weights: distance 35% · size 25% · config 20% · recency 20%. Top-matched comps best support the ARV.
Projected returns pro-forma
-3.0% appreciation · 3.0% rent growth · sell at horizon
- IRR
- -24.7%
- Equity multiple
- 0.16×
- Total profit
- $-51,844
- Equity at exit
- $32,803
- IRR
- -20.3%
- Equity multiple
- -0.07×
- Total profit
- $-65,797
- Equity at exit
- $19,022
Cash invested: $61,600 (down + closing). Projections, not guarantees.
Landlord ↔ Tenant lean methodology
- Overall (STATE)
- 27 Tenant-Leaning
- State Connecticut
- 27 Tenant-Leaning · D+7
- County
- — inherits STATE
- City
- — inherits STATE
ZIP-level market 06076
- Home prices YoY
- -11.7%
- Active inventory
- 72
- Price-to-rent
- 10.8×
Monthly cashflow live
- Estimated rent
- $1,698 medium interval (Pro) →
- Mortgage (P&I)
- −$1,154
- Tax from tax record
- −$351 /mo · $4,217/yr
- Insurance
- −$92
- HOA
- −$0
- Vacancy / Maint / Mgmt
- −$357
- Net cashflow
- $-255
Break-even live
UW: 25.0% down · 7.5% · 30yr · 1.5% tax · 5.0% vac · 8.0% maint · 8.0% mgmt
Financing live
Cash to close
- Down payment
- $55,000
- Closing costs
- $6,600
- Reserves months
- —
- Total cash needed
- —
Loan-product check · same deal, 3 products live
Conventional
25% down · 7.5% · 30yr
- Down + closing
- —
- Monthly P&I
- —
- Monthly cashflow
- —
- DSCR
- —
- Eligible?
- —
Personal DTI + credit; lowest rate.
DSCR
20% down · 8.5% · 30yr
- Down + closing
- —
- Monthly P&I
- —
- Monthly cashflow
- —
- DSCR
- —
- Eligible?
- —
No personal income docs; deal must DSCR.
Hard money
10% down · 12.0% · 12mo
- Down + closing
- —
- Monthly P&I
- —
- Monthly cashflow
- —
- DSCR
- —
- Eligible?
- —
Short-term bridge; refi at stabilization.
Listing history 9 events
-
2026-04-22$220,000 Active 430-char remark
Show marketing remark (430 chars)
Outdoor enthusiasts welcome - just minutes from Crystal Lake, Shenipsit State Forest, and Soapstone Mountain for outdoor activities. This raised ranch on a 1.39 acre corner lot in a quiet neighborhood. One car garage under. Shed for storage. Third bedroom is in the lower level., there is also potential for a den/family room in the lower level. Large, open, eat-in kitchen. Nestled in between Soapstone Mountain and Crystal Lake.
-
2026-03-11historical
-
2025-06-23$250,000 Active
-
2001-03-12soldstatus $111,900
-
2001-01-04$109,900
-
1991-12-26soldstatus $128,900
-
1991-12-01soldstatus $128,900
-
1990-05-02soldstatus $130,900
-
1990-05-01soldstatus $130,900
ⓘ Source: listings_history table (triggers on properties + properties_extension) + one-shot
backfill from property_details.listing_events for pre-trigger history.
Tax reassessment forecast CT · Partial reset (capped growth)
- Current annual tax
- $4,217 · $351/mo
- Projected year-2 tax
- $4,462 · $372/mo
- Expected delta
- +$246/yr (+$20/mo · 5.8%)
ⓘ Screening estimate from a state-policy table — verify with the county assessor before closing.
Climate risk First Street
- Flood 1/10 Low FEMA zone X · 0% chance over 30 yrs
- Wildfire 4/10 Moderate
- Heat 3/10 Moderate 7 d/yr ≥93°F today · 16 d/yr by 30 yrs out
- Wind 6/10 Major 27% chance of damaging wind over 30 yrs
- Air quality 3/10 Moderate 2 unhealthy d/yr today · 4 by 30 yrs out
Nearby sold comps map
Loading sold comps map…
Walkable amenities ~0.75 mi
Loading nearby amenities…
Taxation est. · year 1
- Rental income
- $20,375
- − Mortgage interest
- −$12,323
- − Property taxes
- −$4,217
- − Insurance
- −$1,100
- − Repairs & maintenance
- −$1,630
- − Management
- −$1,630
- − Depreciation
- −$6,400
- Taxable loss
- −$6,925
- Est. tax savings @ 24.0%
- +$1,662
- After-tax cash flow
- $-1,403/yr
For passive investors: Depreciation is non-cash, so a rental often shows a tax loss while cash-flowing — sheltering income. Rental losses are passive: they offset passive income freely, and up to $25,000/yr can offset ordinary (W-2) income if you actively participate and your MAGI is under $100k (phasing out to $0 by $150k); unused losses carry forward. On sale, claimed depreciation is recaptured at up to 25%, and gains may owe capital-gains tax (a 1031 exchange can defer both). Figures are a year-1 estimate at your 24.0% rate — not tax advice; consult a CPA.
Schools (NCES district)
- District
- Stafford School District
- NCES district ID
- 0904290
- Math proficiency
- 33% ▼ -13.00%
- Reading proficiency
- 48% ▼ -9.00%
- Median HH income
- $63,653
- Composite
- 36.16/100
- National rank
- #4735
- State rank
- #99 of 153 in CT
Livability — Crystal Lake
- Score
- 68/100
- State rank
- #110
- US rank
- #9618
Category grades
Schools grade is shown separately in the Schools card above.
Census & demographics
- Population (ZIP)
- 11,989
Population outlook (Capitol County) Hauer SSP2
- By 2040
- 1,063,519
Race, ethnicity, and origin ACS 2023
- Neighborhood character
- Predominantly White (88%)
- Race & ethnicity
- White 88% Hispanic / Latino 7% Two or more races 5%
- Hispanic origin (detail)
- Puerto Rican 3% Dominican 1%
- Common ancestry
- Lithuanian 13% Romanian 12% Slovak 2%
- Foreign-born
- 3% · Canada, Jamaica
- Languages at home
- 95% English-only · Spanish 3% German/W. Germanic 1%
Political lean MEDSL · Capitol
- 2024 margin
- Strong D (+21.9) · D 60.1% · R 38.2% · Other 1.7%
- All cycles
- 2024: D+21.9
Not yet ingested
- Civics
- —
Market trends
- HPI YoY
- ▼ -33.19%
- Current HPI
- 251.5895
- Rent YoY
- —
- Metro
- —
- State GDP YoY
- ▲ 1.06%
- F500 in state
- 38
Industry mix (Fortune 500 HQ in CT)
| Industry | F500 HQs | Revenue |
|---|---|---|
| Industrial Machinery | 4 | $38B |
|
||
| Insurance | 3 | $71B |
|
||
| Financial Services | 2 | $25B |
|
||
| Transportation / Logistics | 2 | $18B |
|
||
| Healthcare | 1 | $247B |
|
||
| Telecommunications | 1 | $55B |
|
||
Price history
+68.1% since first listed9 events — show timeline
- 2026-04-22 Listed $220,000 Smart MLS
- 2026-03-11 Listing Removed — Smart MLS
- 2025-06-23 Listed $250,000 Smart MLS
- 2001-03-12 Sold (MLS) $111,900 Smart MLS
- 2001-01-04 Listed $109,900 Smart MLS
- 1991-12-26 Sold (Public Records) $128,900 Public Records
- 1991-12-01 Sold (Public Records) $128,900 Public Records
- 1990-05-02 Sold (Public Records) $130,900 Public Records
- 1990-05-01 Sold (Public Records) $130,900 Public Records
Property tax history
+0.8%/yrLatest (2023): $4,217 · +2.7% YoY. Source: county tax records.
Cash-flow waterfall
monthlySold comps — $/sqft
last 12 mo · ≤1 miLoading sold comps…