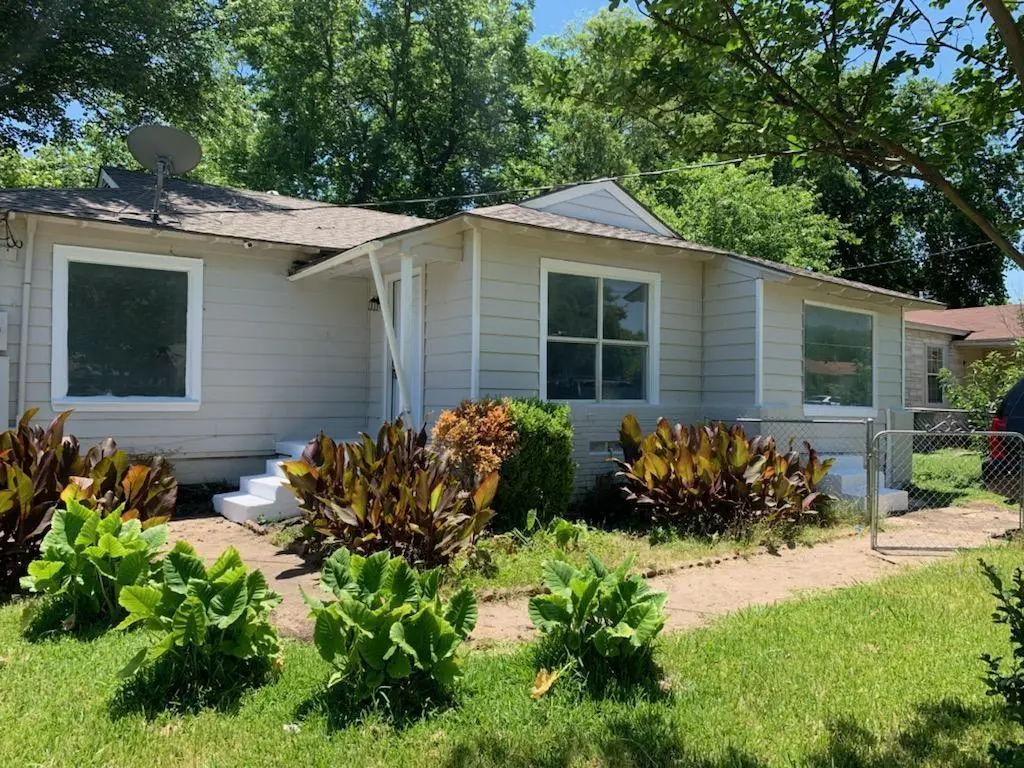
2410 E Overton Rd · Dallas, TX
Flood risk 3/10 · Minor
- FEMA flood zone
- X (unshaded)
- Chance of flooding over 30 yrs
- 0.2%
- Est. flood insurance / yr
- $507 – $1,088
Fire risk 1/10 · Minimal
- Est. fire insurance / yr
- $1,222 – $2,270
Heat risk 7/10 · Major
- Hot days now (above 109°F)
- 7 days/yr
- Hot days in 30 yrs
- 24 days/yr
Wind risk 6/10 · Moderate
- Chance of severe wind over 30 yrs
- 27.0%
Air-quality risk 2/10 · Minimal
- Unhealthy air days now
- 1 days/yr
- Unhealthy air days in 30 yrs
- 2 days/yr
Risk factors via First Street. Map © Google.
Why this score? — see what drove the D- grade
The composite is a weighted blend of 9 inputs, each scored 0–100. Each bar is that input's sub-score; the figure is the points it added to the 100-point composite (weight × sub-score).
- Cash flow +9.9/30.0
- ARV discount +8.5/15.0
- Livability +4.0/5.0
- Rent growth +3.6/5.0
- 1% rule +3.4/10.0
- DSCR +2.8/10.0
- Schools +2.8/10.0
- Condition / age +2.5/5.0
- Appreciation +0.0/10.0
$194,900
🖨 Deal sheet (PDF) 📄 Offer letter ✓ Due diligence
Listing remarks
Price Drop! Newly renovated home in Oak Cliff TX. This home has been completely updated. Updates include, new windows, foundation repair, new carpet, and laminate flooring. The drywall has been replaced and painted throughout with a soft finish. All doors and baseboards have been painted or replaced. The bathroom has been remodeled with a new tile finish. In addition to these updates, the kitchen has been remodeled with new cabinets, countertop and stainless steel undermount sink. The kitchen is finished with black appliances. This is great find for a new homeowner or investor wanting to obtain great rental income. The stove, refrigerator and central AC unit will be installed with once unde
Key facts
- 8,015 sq ft lot
- Built 1950
- Listed 30 days
Neighborhood map
What this means for you Summary
Snapshot
- This is a 2-bed/1.0-bath single-family listed at $195k.
Deal economics
- At list price, monthly cash flow is $-122 ($-1k/yr) — negative.
- To cash-flow at today's rent, offer at most $173k (11.1% below list).
- To meet the 1% rule (rent ≥ 1% of price), the offer needs to be $163k (16.3% below list).
- Recommended offer: $163k (16.3% below list) — sets the bar for 1% rule.
- Cap rate 5.5% vs local median 2.3% in Dallas — top-decile yield for the area; either an underpriced asset or a hidden risk that comps aren't pricing in. Stress-test before assuming the spread holds.
Location & tenants
- Location reads 81/100 on livability (#24 in TX, #1,380 nationally) — a professional / high-income tenant draw. Strengths: amenities A+, commute A+, housing A+; Watch: crime F.
- Dallas ISD (urban): math 31% / reading 36% proficiency, ranked #559 of 826 in TX (top 68%) — families likely to look elsewhere, expect single-tenant / working-renter base with shorter leases; 83% free/reduced lunch — lower-income household profile, screen leases tightly.
- Zoned schools: John Neely Bryan El (math 17% / reading 22%, grade F, #3,583 of 4,322 statewide, top 86%, 379 students, 97% FRL); John Lewis Social Justice Academy At O W Holmes (math 22% / reading 22%, grade F, #1,360 of 1,662 statewide, top 83%, 581 students, 100% FRL); Franklin D Roosevelt H S of Innovation (math 12% / reading 22%, grade F, #1,491 of 1,632 statewide, top 92%, 748 students, 96% FRL).
- Zoned-school proficiency averages 20% at this address vs 34% district-wide (-14 pts) — the specific schools serving this property underperform the Dallas ISD average; the district grade overstates school quality for this exact location.
- Market conditions: Rents rising fast (+4.2%/yr); 253 active listings in the ZIP; 30 comparable units currently listed for rent nearby; rentals at typical pace (median 26d on market — plan ~3-4 weeks tenant-placement turnaround); lower-income renter base — watch delinquency; 12,577 units permitted in Dallas County in 2024 (6,829 in 5+ unit buildings).
- At $1,631/mo this rent would consume 47% of the median local household income ($41k/yr) (locally 2465% of renters already pay >50% of income on rent) — very limited rent-growth headroom before tenants either downsize or default.
Forward outlook
- Local home prices are declining (-3.0%/yr); year-one equity from $1k of loan paydown is wiped out by about $6k of value loss. Plan a longer hold.
- Dallas County population projected at +35% by 2050 — long-run rental-demand tailwind backs the buy-and-hold thesis.
Negotiation context
- It's been on market 30 days — a 2% lower offer ($192k) is reasonable based on typical stale-listing flexibility.
Risks & watch-outs
- Watch-outs: built in 1950 — expect roof / HVAC / electrical / plumbing capex.
- Climate carrying-cost: major wind risk, 27% chance of damaging wind over 30y; extreme-heat days projected 7→24/yr by 2055 (HVAC capex compounding) — expect insurance premiums to compound above CPI over the hold.
Questions for the listing agent
- What do current leases actually rent for vs. the listed asking? Can we see a recent rent roll and the last 12 months of T-12 income?
- Built in 1950 — when were the roof, HVAC, electrical panel, plumbing, and water heater last replaced?
- Is there a deadline driving the sale (1031 exchange, divorce, estate, relocation)? That informs how much negotiation room exists.
- Crime grade is F in this area — have there been break-ins, vandalism, or insurance claims at this property in the last 3 years? What carrier currently insures it and at what premium?
- The area grade is low — what's the realistic commute time and amenity access for the typical tenant pool here? Any planned neighborhood developments (good or bad) we should know about?
- What's the average days-on-market for RENTAL listings here right now (not sales)? A rising rental-DOM trend means longer vacancies and softer asking-rent achievability than the comps imply.
- What's the recent tenant-quality profile in this submarket — average credit score on applications, eviction rate, late-payment / NSF rate, and stable-employment percentage? A property-management company in the area should have these aggregated.
- How much new for-sale + rental construction is in the pipeline within 1–3 miles? Heavy new supply typically softens prices + rents 12–24 months out; constrained supply supports both.
Investment metrics
- 1% rule
- 0.84% ✗
- Cap rate
- 5.54%
- Cash-on-cash
- -2.68%
- DSCR
- 0.88
- GRM
- 10.0
CMA / ARV
- ARV (on-the-fly)
- $199,472
- Comps found
- 12
Show comp detail 12 sales within ~0.75 mi
| Address | Dist | Beds/Ba | Sqft | Sold | Price | $/sf | Match |
|---|---|---|---|---|---|---|---|
| 2218 Kathleen Ave | 0.26mi | 2/1.0 | 1,128 (+3%) | 2mo | $155,900 | $138 | 81 |
| 2516 Marfa Ave | 0.15mi | 3/2.0 (+1) | 1,056 (-4%) | 3mo | $219,900 | $208 | 75 |
| 2427 Hudspeth Ave | 0.12mi | 3/1.0 (+1) | 1,192 (+9%) | 1mo | $179,000 | $150 | 74 |
| 2628 Lea Crest Dr | 0.32mi | 3/2.0 (+1) | 1,100 (+0%) | 4mo | $217,500 | $198 | 73 |
| 2554 Marfa Ave | 0.23mi | 3/2.0 (+1) | 1,042 (-5%) | 6mo | $144,500 | $139 | 67 |
| 2703 Eagle Dr | 0.67mi | 3/1.0 (+1) | 1,088 (-1%) | 6mo | $180,000 | $165 | 57 |
| 2665 Locust Ave | 0.72mi | 3/2.0 (+1) | 1,076 (-2%) | 3mo | $131,200 | $122 | 52 |
| 2148 Kathleen Ave | 0.32mi | 3/2.0 (+1) | 1,250 (+14%) | 2mo | $259,500 | $208 | 51 |
| 2725 Custer Dr | 0.73mi | 3/2.0 (+1) | 1,073 (-2%) | 5mo | $195,000 | $182 | 49 |
| 1713 Hemphill Dr | 0.48mi | 2/1.0 | 932 (-15%) | 5mo | $165,000 | $177 | 49 |
| 2629 Bowling Green Ave | 0.62mi | 2/1.0 | 949 (-13%) | 4mo | $205,000 | $216 | 45 |
| 2734 Kellogg Ave | 0.52mi | 3/2.0 (+1) | 1,252 (+14%) | 4mo | $240,000 | $192 | 40 |
Match score weights: distance 35% · size 25% · config 20% · recency 20%. Top-matched comps best support the ARV.
Projected returns pro-forma
-3.0% appreciation · 4.2% rent growth · sell at horizon
- IRR
- -19.3%
- Equity multiple
- 0.32×
- Total profit
- $-37,291
- Equity at exit
- $29,060
- IRR
- -9.5%
- Equity multiple
- 0.38×
- Total profit
- $-33,832
- Equity at exit
- $16,851
Cash invested: $54,572 (down + closing). Projections, not guarantees.
Landlord ↔ Tenant lean methodology
- Overall (STATE)
- 87 Strongly Landlord-Friendly
- State Texas
- 87 Strongly Landlord-Friendly · R+5
- County
- — inherits STATE
- City
- — inherits STATE
ZIP-level market 75216
- Home prices YoY
- -29.7%
- Rents YoY
- 4.2%
- Active inventory
- 253
- Price-to-rent
- 10.0×
Monthly cashflow live
- Estimated rent
- $1,631 high interval (Pro) →
- Mortgage (P&I)
- −$1,022
- Tax from tax record
- −$307 /mo · $3,689/yr
- Insurance
- −$81
- HOA
- −$0
- Vacancy / Maint / Mgmt
- −$343
- Net cashflow
- $-122
Break-even live
Sensitivity live
| Price | -10% $-12 | -5% $-67 | +0% $-122 | +5% $-177 | +10% $-232 |
|---|---|---|---|---|---|
| Rent | -10% $-251 | -5% $-186 | +0% $-122 | +5% $-57 | +10% $7 |
| Rate | -1.0pp $-24 | -0.5pp $-72 | base $-122 | +0.5pp $-172 | +1.0pp $-224 |
UW: 25.0% down · 7.5% · 30yr · 1.5% tax · 5.0% vac · 8.0% maint · 8.0% mgmt
Financing live
Cash to close
- Down payment
- $48,725
- Closing costs
- $5,847
- Reserves months
- —
- Total cash needed
- —
Loan-product check · same deal, 3 products live
Conventional
25% down · 7.5% · 30yr
- Down + closing
- —
- Monthly P&I
- —
- Monthly cashflow
- —
- DSCR
- —
- Eligible?
- —
Personal DTI + credit; lowest rate.
DSCR
20% down · 8.5% · 30yr
- Down + closing
- —
- Monthly P&I
- —
- Monthly cashflow
- —
- DSCR
- —
- Eligible?
- —
No personal income docs; deal must DSCR.
Hard money
10% down · 12.0% · 12mo
- Down + closing
- —
- Monthly P&I
- —
- Monthly cashflow
- —
- DSCR
- —
- Eligible?
- —
Short-term bridge; refi at stabilization.
Rent comps 30 comps
| Address | Beds | Baths | Sqft | Rent | $/sqft | DOM | Units | Dist |
|---|---|---|---|---|---|---|---|---|
| 2503 Stovall Dr Dallas, TX | 2.0 | 2.0 | 768 | $2,300 | $2.99 | 45d | 1 | 0.23mi |
| 2538 Stovall Dr Dallas, TX | 3.0 | 1.0 | 986 | $1,625 | $1.65 | 7d | 1 | 0.31mi |
| 2303 Deer Path Dr Dallas, TX | 2.0 | 1.0 | 790 | $1,650 | $2.09 | 9d | 1 | 0.33mi |
| 3206 Kellogg Ave Dallas, TX | 3.0 | 1.5 | 1076 | $1,800 | $1.67 | 45d | 1 | 0.39mi |
| 2669 Marfa Ave Unit 3 Dallas, TX | 1.0 | 1.0 | 1248 | $750 | $0.60 | 26d | 1 | 0.44mi |
| 3320 Mundy Dr Dallas, TX | 3.0 | 2.0 | 1010 | $1,695 | $1.68 | 45d | 1 | 0.46mi |
| 1717 Hemphill Dr Dallas, TX | 3.0 | 1.0 | 1222 | $1,695 | $1.39 | 26d | 1 | 0.49mi |
| 2723 Kellogg Ave Dallas, TX | 3.0 | 2.0 | 1255 | $1,700 | $1.35 | 9d | 1 | 0.56mi |
| 3930 S Denley Dr Dallas, TX | 3.0 | 2.0 | 1135 | $1,900 | $1.67 | 9d | 1 | 0.68mi |
| 1618 Marfa Ave Dallas, TX | 3.0 | 2.0 | 1100 | $1,900 | $1.73 | 45d | 1 | 0.75mi |
| 4306 Landrum Ave Dallas, TX | 3.0 | 2.0 | 1226 | $1,695 | $1.38 | 3d | 1 | 0.77mi |
| 4306 Landrum Ave Dallas, TX | 3.0 | 2.0 | 1226 | $1,695 | $1.38 | 8d | 1 | 0.77mi |
| 2023 E Illinois Ave Dallas, TX | 2.0 | 1.5 | 1304 | $1,695 | $1.30 | 23d | 1 | 0.78mi |
| 2625 E Illinois Ave Dallas, TX | 2.0 | 1.0 | 750 | $1,050 | $1.40 | 5d | 1 | 0.84mi |
| 2625 E Illinois Ave Dallas, TX | 1.0–2.0 | 1.0 | 700 | $1,050 | $1.50 | 14d | 18 | 0.84mi |
| 2625 E Illinois Ave Dallas, TX | 2.0 | 1.0 | 750 | $1,050 | $1.40 | 21d | 1 | 0.84mi |
| 2625 E Illinois Ave Unit 102 Dallas, TX | 2.0 | 1.0 | 750 | $1,050 | $1.40 | 26d | 1 | 0.86mi |
| 4417 S Lancaster Rd Dallas, TX | 2.0 | 1.0–2.0 | 874 | $1,595 | $1.82 | 4d | 1 | 0.91mi |
| 1334 Marfa Ave Dallas, TX | 3.0 | 2.0 | 1100 | $1,475 | $1.34 | 45d | 1 | 1.01mi |
| 2821 E Kiest Blvd Dallas, TX | 1.0 | 1.0 | 700 | $990 | $1.41 | 9d | 1 | 1.12mi |
| 4105 Balch Dr Dallas, TX | 3.0 | 2.5 | 1464 | $1,650 | $1.13 | 45d | 1 | 1.22mi |
| 3024 Modree Ave Dallas, TX | 3.0 | 2.0 | 1149 | $1,700 | $1.48 | 45d | 1 | 1.26mi |
| 2751 E Ledbetter Dr Dallas, TX | 1.0–3.0 | 1.0–1.5 | 794 | $1,186 | $1.49 | 45d | 3 | 1.32mi |
| 2906 E Kiest Blvd Dallas, TX | 2.0–3.0 | 1.0–2.0 | 798 | $1,235 | $1.55 | 0d | 6 | 1.32mi |
| 4836 Sunnyvale St Dallas, TX | 1.0–3.0 | 1.0–2.0 | 515 | $1,330 | $2.58 | 45d | 7 | 1.33mi |
| 3015 E Ledbetter Dr Dallas, TX | 2.0–3.0 | 2.0 | 1030 | $1,100 | $1.07 | 5d | 1 | 1.45mi |
| 3608 S Marsalis Ave Dallas, TX | 2.0 | 1.0 | 907 | $1,400 | $1.54 | 45d | 1 | 1.46mi |
| 4934 Kildare Ave Dallas, TX | 3.0 | 2.0 | 1118 | $1,595 | $1.43 | 26d | 1 | 1.46mi |
| 2826 Alaska Ave Dallas, TX | 3.0 | 2.0 | 1190 | $1,790 | $1.50 | 1d | 1 | 1.46mi |
| 2423 Maryland Ave Dallas, TX | 2.0 | 2.0 | 1102 | $2,350 | $2.13 | 45d | 1 | 1.49mi |
Listing history 6 events
-
2022-08-18soldstatus
-
2022-07-06status Pending
-
2022-06-23price $194,900
-
2022-06-06$199,900 Active
-
2022-03-04soldstatus
-
1998-08-19soldstatus
ⓘ Source: listings_history table (triggers on properties + properties_extension) + one-shot
backfill from property_details.listing_events for pre-trigger history.
Tax reassessment forecast TX · Resets to sale price
- Current annual tax
- $3,689 · $307/mo
- Projected year-2 tax
- $3,689 · $307/mo
- Expected delta
- $0/yr ($0/mo · 0.0%)
ⓘ Screening estimate from a state-policy table — verify with the county assessor before closing.
Climate risk First Street
- Flood 3/10 Moderate FEMA zone X (unshaded) · 20% chance over 30 yrs
- Wildfire 1/10 Low
- Heat 7/10 Severe 7 d/yr ≥109°F today · 24 d/yr by 30 yrs out
- Wind 6/10 Major 27% chance of damaging wind over 30 yrs
- Air quality 2/10 Low 1 unhealthy d/yr today · 2 by 30 yrs out
Nearby sold comps map
Loading sold comps map…
Walkable amenities ~0.75 mi
Loading nearby amenities…
Taxation est. · year 1
- Rental income
- $19,576
- − Mortgage interest
- −$10,917
- − Property taxes
- −$3,689
- − Insurance
- −$974
- − Repairs & maintenance
- −$1,566
- − Management
- −$1,566
- − Depreciation
- −$5,670
- Taxable loss
- −$4,807
- Est. tax savings @ 24.0%
- +$1,154
- After-tax cash flow
- $-310/yr
For passive investors: Depreciation is non-cash, so a rental often shows a tax loss while cash-flowing — sheltering income. Rental losses are passive: they offset passive income freely, and up to $25,000/yr can offset ordinary (W-2) income if you actively participate and your MAGI is under $100k (phasing out to $0 by $150k); unused losses carry forward. On sale, claimed depreciation is recaptured at up to 25%, and gains may owe capital-gains tax (a 1031 exchange can defer both). Figures are a year-1 estimate at your 24.0% rate — not tax advice; consult a CPA.
Schools (NCES district)
- District
- Dallas ISD
- NCES district ID
- 4816230
- Math proficiency
- 31% ▼ -16.00%
- Reading proficiency
- 36% ▼ -4.00%
- Median HH income
- $42,881
- Composite
- 28.41/100
- National rank
- #6763
- State rank
- #559 of 826 in TX
Livability — Dallas
- Score
- 81/100
- State rank
- #24
- US rank
- #1380
Category grades
Schools grade is shown separately in the Schools card above.
Census & demographics
- Census place
- Dallas, TX
- County
- Dallas County · 2,612,404 people
- City population
- 1,168,437
- Metro
- Dallas-Fort Worth-Arlington, TX
- Population (ZIP)
- 55,894
- Household income
- $41,386
- Rent vs Own
- Severe rent burden
- 2465.0
Population outlook (Dallas County) Hauer SSP2
- Today (2025)
- 2,979,839 people
- By 2030
- 3,191,823 · +7.1%
- By 2040
- 3,619,611 · +21.5%
- By 2050
- 4,026,915 · +35.1%
- By 2075
- 4,957,073 · +66.4%
- By 2100
- 5,508,725 · +84.9%
Race, ethnicity, and origin ACS 2023
- Neighborhood character
- Majority Black (51%)
- Race & ethnicity
- Black 51% Hispanic / Latino 44% Two or more races 14% White 3%
- Hispanic origin (detail)
- Mexican 40%
- Common ancestry
- Hispanic 1%
- Foreign-born
- 17% · Canada
- Languages at home
- 62% English-only · Spanish 37%
Political lean MEDSL · Dallas
- 2024 margin
- Strong D (+22.2) · D 60.2% · R 38.0% · Other 1.8%
- 2008→2024 swing
- +6.9pp toward D · 2008: 15.3pp · 2024: 22.2pp
- All cycles
- 2024: D+22.2 2020: D+31.6 2016: D+26.2 2012: D+15.4 2008: D+15.3
Not yet ingested
- Civics
- —
Market trends
- HPI YoY
- ▼ -126.35%
- Current HPI
- 299.1825
- Rent YoY
- ▲ 4.20%
- Metro
- Dallas-Fort Worth-Arlington, TX
- State GDP YoY
- ▲ 3.95%
- F500 in state
- 110
Industry mix (Fortune 500 HQ in TX)
| Industry | F500 HQs | Revenue |
|---|---|---|
| Energy | 16 | $1,198B |
|
||
| Technology | 5 | $198B |
|
||
| Engineering / Construction | 4 | $72B |
|
||
| Energy Services | 3 | $60B |
|
||
| Utilities | 3 | $41B |
|
||
| Healthcare | 2 | $330B |
|
||
Price history
-2.5% since first listed6 events — show timeline
- 2022-08-18 Sold (Public Records) — Public Records
- 2022-07-06 Pending — NTREIS
- 2022-06-23 Price Changed $194,900 NTREIS
- 2022-06-06 Listed $199,900 NTREIS
- 2022-03-04 Sold (Public Records) — Public Records
- 1998-08-19 Sold (Public Records) — Public Records
Property tax history
+8.3%/yrLatest (2025): $3,689 · -0.4% YoY. Source: county tax records.
Cash-flow waterfall
monthlySold comps — $/sqft
last 12 mo · ≤1 miLoading sold comps…