65812 Acoma Ave · Desert Hot Springs, CA
Flood risk 3/10 · Minor
- FEMA flood zone
- X (shaded)
- Chance of flooding over 30 yrs
- 0.2%
- Est. flood insurance / yr
- $507 – $1,088
Fire risk 6/10 · Moderate
- Est. fire insurance / yr
- $659 – $1,223
Heat risk 9/10 · Severe
- Hot days now (above 109°F)
- 7 days/yr
- Hot days in 30 yrs
- 21 days/yr
Wind risk 1/10 · Minimal
- Chance of severe wind over 30 yrs
- —
Air-quality risk 5/10 · Moderate
- Unhealthy air days now
- 7 days/yr
- Unhealthy air days in 30 yrs
- 10 days/yr
Risk factors via First Street. Map © Google.
Why this score? — see what drove the D grade
The composite is a weighted blend of 9 inputs, each scored 0–100. Each bar is that input's sub-score; the figure is the points it added to the 100-point composite (weight × sub-score).
- Cash flow +15.1/30.0
- ARV discount +7.5/15.0
- DSCR +4.6/10.0
- 1% rule +4.2/10.0
- Rent growth +3.4/5.0
- Schools +2.7/10.0
- Livability +2.5/5.0
- Condition / age +2.5/5.0
- Appreciation +0.0/10.0
$225,000
🖨 Deal sheet 📄 Offer letter ✓ Due diligence
Listing remarks MLS
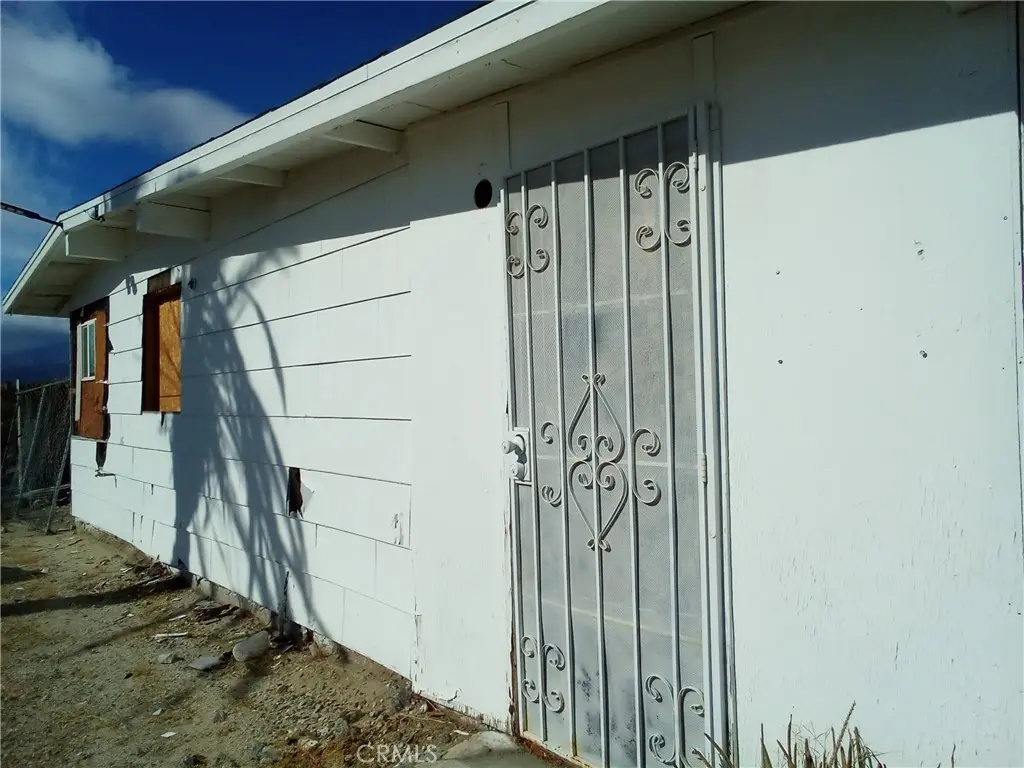
Charmin older home with fantastic potential! Some renovation work is already underway, giving you a head start on bringing this property back to life. Ideal for buyers seeking a customizable space or an investment opportunity. Renovations included all new plumbing and electrical thought the house. Permitted additions, including a full bathroom in the primary bedroom brings the total living space to 1,474 sq. ft. (Public records shows 1,200 sq ft) Convenient location and strong potential for appreciation.
Key facts
- Customizable space
- New plumbing
- Renovation work
Tags
Neighborhood map
What this means for you Summary
Snapshot
- This is a 2-bed/1.0-bath other listed at $225k.
Deal economics
- At list price, monthly cash flow is $75 ($898/yr) — positive.
- The deal already cash-flows at list — no discount required.
- To meet the 1% rule (rent ≥ 1% of price), the offer needs to be $208k (7.7% below list).
- Recommended offer: $198k (12.0% below list) — sets the bar for market timing.
- Cap rate 6.7% vs local median 4.0% in Desert Hot Springs — top-decile yield for the area; either an underpriced asset or a hidden risk that comps aren't pricing in. Stress-test before assuming the spread holds.
Location & tenants
- Location reads 49/100 on livability (#1,149 in CA) — a working-class tenant base; expect higher turnover. Strengths: housing B+; Watch: crime D+, schools F, amenities F.
- Palm Springs Unified (suburban): math 21% / reading 42% proficiency, ranked #328 of 517 in CA (top 63%) — families likely to look elsewhere, expect single-tenant / working-renter base with shorter leases; 73% free/reduced lunch — lower-income household profile, screen leases tightly.
- Market conditions: Rents rising (+3.7%/yr); 515 active listings in the ZIP; 34 comparable units currently listed for rent nearby; rentals lingering (median 44d on market — plan ~5-8 weeks vacancy on turnover, expect pricing pressure); 59% of comp listings sitting > 30 days — soft ceiling on asking rent; 9,195 units permitted in Riverside County in 2024 (1,512 in 5+ unit buildings).
- At $2,076/mo this rent would consume 46% of the median local household income ($54k/yr) (locally 2095% of renters already pay >50% of income on rent) — very limited rent-growth headroom before tenants either downsize or default.
Forward outlook
- Local home prices are declining (-3.0%/yr); year-one equity from $2k of loan paydown is wiped out by about $7k of value loss. Plan a longer hold.
- Riverside County population projected at +22% by 2050 — long-run rental-demand tailwind backs the buy-and-hold thesis.
Negotiation context
- It's been on market 198 days — a 12% lower offer ($198k) is reasonable based on typical stale-listing flexibility.
- 4 sale attempts since 16y ago; this cycle's ask has dropped $50k (18%) from the opening price — seller is motivated, your offer sets the floor, not the list.
- Current owner paid $169k; 33% above their basis — modest negotiation headroom, anchor on the comps not their cost.
Risks & watch-outs
- Watch-outs: built in 1959 — expect roof / HVAC / electrical / plumbing capex.
- Climate carrying-cost: major wildfire risk; extreme-heat days projected 7→21/yr by 2055 (HVAC capex compounding) — expect insurance premiums to compound above CPI over the hold.
Questions for the listing agent
- It's been on market 198 days. Have you received any prior offers? Is the seller open to a 12% concession, seller financing, or rate buy-down credit?
- Built in 1959 — when were the roof, HVAC, electrical panel, plumbing, and water heater last replaced?
- Why hasn't it sold? Are there any deal-killer items the seller is aware of (foundation, flood, title, zoning, code violations)?
- Is there a deadline driving the sale (1031 exchange, divorce, estate, relocation)? That informs how much negotiation room exists.
- Schools are F-rated, which usually means shorter tenancies and higher turnover. Who's the typical renter profile here, and what's been the actual vacancy rate?
- Crime grade is D in this area — have there been break-ins, vandalism, or insurance claims at this property in the last 3 years? What carrier currently insures it and at what premium?
- The area grade is low — what's the realistic commute time and amenity access for the typical tenant pool here? Any planned neighborhood developments (good or bad) we should know about?
- What's the average days-on-market for RENTAL listings here right now (not sales)? A rising rental-DOM trend means longer vacancies and softer asking-rent achievability than the comps imply.
- What's the recent tenant-quality profile in this submarket — average credit score on applications, eviction rate, late-payment / NSF rate, and stable-employment percentage? A property-management company in the area should have these aggregated.
- How much new for-sale + rental construction is in the pipeline within 1–3 miles? Heavy new supply typically softens prices + rents 12–24 months out; constrained supply supports both.
Investment metrics
- 1% rule
- 0.92% ✗
- Cap rate
- 6.69%
- Cash-on-cash
- 1.43%
- DSCR
- 1.06
- GRM
- 9.0
CMA / ARV
No comps found within radius.
Projected returns pro-forma
-3.0% appreciation · 3.66% rent growth · sell at horizon
- IRR
- -13.3%
- Equity multiple
- 0.52×
- Total profit
- $-30,267
- Equity at exit
- $33,548
- IRR
- -3.3%
- Equity multiple
- 0.77×
- Total profit
- $-14,293
- Equity at exit
- $19,454
Cash invested: $63,000 (down + closing). Projections, not guarantees.
Landlord ↔ Tenant lean methodology
- Overall (STATE)
- 18 Strongly Tenant-Friendly
- State California
- 18 Strongly Tenant-Friendly · D+13
- County
- — inherits STATE
- City
- — inherits STATE
ZIP-level market 92240
- Home prices YoY
- -19.6%
- Rents YoY
- 3.7%
- Active inventory
- 515
- Price-to-rent
- 9.0×
Monthly cashflow live
- Estimated rent
- $2,076 high interval (Pro) →
- Mortgage (P&I)
- −$1,180
- Tax from tax record
- −$292 /mo · $3,502/yr
- Insurance
- −$94
- HOA
- −$0
- Vacancy / Maint / Mgmt
- −$436
- Net cashflow
- $75
Break-even live
UW: 25.0% down · 7.5% · 30yr · 1.5% tax · 5.0% vac · 8.0% maint · 8.0% mgmt
Financing live
Cash to close
- Down payment
- $56,250
- Closing costs
- $6,750
- Reserves months
- —
- Total cash needed
- —
Loan-product check · same deal, 3 products live
Conventional
25% down · 7.5% · 30yr
- Down + closing
- —
- Monthly P&I
- —
- Monthly cashflow
- —
- DSCR
- —
- Eligible?
- —
Personal DTI + credit; lowest rate.
DSCR
20% down · 8.5% · 30yr
- Down + closing
- —
- Monthly P&I
- —
- Monthly cashflow
- —
- DSCR
- —
- Eligible?
- —
No personal income docs; deal must DSCR.
Hard money
10% down · 12.0% · 12mo
- Down + closing
- —
- Monthly P&I
- —
- Monthly cashflow
- —
- DSCR
- —
- Eligible?
- —
Short-term bridge; refi at stabilization.
Rent comps 34 comps
| Address | Beds | Baths | Sqft | Rent | $/sqft | DOM | Units | Dist |
|---|---|---|---|---|---|---|---|---|
| 65568 Acoma Ave Desert Hot Springs, CA | 2.0 | 2.5 | 1320 | $2,095 | $1.59 | 14d | 1 | 0.28mi |
| 66051 3rd St Desert Hot Springs, CA | 2.0 | 1.0 | 760 | $1,675 | $2.20 | 24d | 1 | 0.30mi |
| 65565 Acoma Ave #49 Desert Hot Springs, CA | 3.0 | 2.0 | 1396 | $2,300 | $1.65 | 43d | 1 | 0.34mi |
| 65841 6th St Desert Hot Springs, CA | 2.0 | 2.0 | 1204 | $2,250 | $1.87 | 43d | 1 | 0.39mi |
| 66212 2nd St Desert Hot Springs, CA | 2.0 | 1.0 | 960 | $2,000 | $2.08 | 43d | 1 | 0.42mi |
| 66351 First St Unit 2 Desert Hot Springs, CA | 1.0 | 1.0 | 800 | $1,295 | $1.62 | 43d | 1 | 0.52mi |
| 66299 Desert View Ave Desert Hot Springs, CA | 2.0 | 1.0 | 800 | $1,650 | $2.06 | 43d | 1 | 0.53mi |
| 66309 Desert View Ave Unit 1 Desert Hot Springs, CA | 2.0 | 1.0 | 800 | $1,650 | $2.06 | 43d | 1 | 0.54mi |
| 66369 Buena Vista Ave Apt A Desert Hot Springs, CA | 3.0 | 2.0 | 931 | $1,499 | $1.61 | 43d | 1 | 0.55mi |
| 66435 Acoma Ave Apt 2 Desert Hot Springs, CA | 2.0 | 1.5 | 775 | $1,525 | $1.97 | 43d | 1 | 0.60mi |
| 66300 6th St Desert Hot Springs, CA | 3.0 | 2.0 | 1364 | $2,550 | $1.87 | 24d | 1 | 0.63mi |
| 66444 Desert View Ave Unit B Desert Hot Springs, CA | 3.0 | 2.0 | 1294 | $2,275 | $1.76 | 43d | 1 | 0.63mi |
| 13322 El Rio Ln Desert Hot Springs, CA | 3.0 | 2.0 | 1215 | $2,750 | $2.26 | 43d | 1 | 0.64mi |
| 66434 Estrella Ave Desert Hot Springs, CA | 2.0 | 2.0 | 850 | $1,800 | $2.12 | 43d | 1 | 0.66mi |
| 10792 Santa Cruz Rd Desert Hot Springs, CA | 3.0 | 2.5 | 1321 | $2,295 | $1.74 | 24d | 1 | 0.71mi |
| 66362 7th St Unit J Desert Hot Springs, CA | 1.0 | 1.0 | 700 | $1,675 | $2.39 | 43d | 1 | 0.73mi |
| 13715 El Rio Ln Desert Hot Springs, CA | 3.0 | 2.0 | 1318 | $2,600 | $1.97 | 7d | 1 | 0.83mi |
| 66688 First St Unit 3 Desert Hot Springs, CA | 3.0 | 2.5 | 1500 | $2,499 | $1.67 | 43d | 1 | 0.87mi |
| 11625 Mesquite Ave Desert Hot Springs, CA | 3.0 | 2.0 | 1248 | $2,200 | $1.76 | 43d | 1 | 0.93mi |
| 66113 14th St Desert Hot Springs, CA | 3.0 | 2.0 | 1219 | $2,500 | $2.05 | 18d | 1 | 0.94mi |
| 13950 West Dr Unit B Desert Hot Springs, CA | 2.0 | 2.0 | 1008 | $1,600 | $1.59 | 1d | 1 | 0.97mi |
| 66800 Pierson Blvd Desert Hot Springs, CA | 2.0 | 2.0 | 900 | $1,500 | $1.67 | 43d | 1 | 1.00mi |
| 13405 Ocotillo Rd Desert Hot Springs, CA | 2.0 | 1.0 | 864 | $1,750 | $2.03 | 1d | 1 | 1.05mi |
| 13987 El Cajon Dr Desert Hot Springs, CA | 3.0 | 2.0 | 1215 | $2,600 | $2.14 | 7d | 1 | 1.07mi |
| 10510 Ocotillo Rd Desert Hot Springs, CA | 3.0 | 2.0 | 1400 | $3,000 | $2.14 | 4d | 1 | 1.09mi |
| 10510 Ocotillo Rd Desert Hot Springs, CA | 3.0 | 2.5 | 1400 | $3,000 | $2.14 | 43d | 1 | 1.09mi |
| 66700 Crescent Dr Unit A Desert Hot Springs, CA | 3.0 | 2.0 | 1400 | $2,195 | $1.57 | 14d | 1 | 1.09mi |
| 66590 Joseph Way Unit B Desert Hot Springs, CA | 2.0 | 1.0 | 785 | $2,295 | $2.92 | 24d | 1 | 1.09mi |
| 66144 Avenida Cadena Desert Hot Springs, CA | 3.0 | 2.0 | 1488 | $2,395 | $1.61 | 43d | 1 | 1.26mi |
| 66144 Avenida Cadena Desert Hot Springs, CA | 3.0 | 2.0 | 1488 | $2,295 | $1.54 | 18d | 1 | 1.26mi |
| 12300 Ambrosio Dr Desert Hot Springs, CA | 3.0 | 2.0 | 1260 | $2,400 | $1.90 | 43d | 1 | 1.26mi |
| 65548 Avenida Barona Desert Hot Springs, CA | 3.0 | 2.0 | 1200 | $2,799 | $2.33 | 10d | 1 | 1.31mi |
| 13895 Luis Dr Desert Hot Springs, CA | 2.0 | 1.0 | 814 | $1,800 | $2.21 | 43d | 1 | 1.44mi |
| 67285 Pierson Blvd Desert Hot Springs, CA | 2.0 | 2.0 | 1000 | $2,200 | $2.20 | 43d | 1 | 1.47mi |
Listing history 20 events
-
2026-06-08days on market $225,000 Active 198 DOM
-
2026-06-07days on market $225,000 Active 197 DOM
-
2026-06-04days on market $225,000 Active 194 DOM
-
2026-06-03days on market $225,000 Active 193 DOM
-
2026-06-02days on market $225,000 Active 192 DOM
-
2026-06-01days on market $225,000 Active 191 DOM
-
2026-05-31days on market $225,000 Active 190 DOM
-
2026-05-10price $225,000 510-char remark
Show marketing remark (510 chars)
Charmin older home with fantastic potential! Some renovation work is already underway, giving you a head start on bringing this property back to life. Ideal for buyers seeking a customizable space or an investment opportunity. Renovations included all new plumbing and electrical thought the house. Permitted additions, including a full bathroom in the primary bedroom brings the total living space to 1,474 sq. ft. (Public records shows 1,200 sq ft) Convenient location and strong potential for appreciation.
-
2026-01-01price $260,000 510-char remark
Show marketing remark (510 chars)
Charmin older home with fantastic potential! Some renovation work is already underway, giving you a head start on bringing this property back to life. Ideal for buyers seeking a customizable space or an investment opportunity. Renovations included all new plumbing and electrical thought the house. Permitted additions, including a full bathroom in the primary bedroom brings the total living space to 1,474 sq. ft. (Public records shows 1,200 sq ft) Convenient location and strong potential for appreciation.
-
2025-11-22$275,000 Active 510-char remark
Show marketing remark (510 chars)
Charmin older home with fantastic potential! Some renovation work is already underway, giving you a head start on bringing this property back to life. Ideal for buyers seeking a customizable space or an investment opportunity. Renovations included all new plumbing and electrical thought the house. Permitted additions, including a full bathroom in the primary bedroom brings the total living space to 1,474 sq. ft. (Public records shows 1,200 sq ft) Convenient location and strong potential for appreciation.
-
2022-10-03historical
-
2022-09-28$245,000 Active
-
2020-08-17soldstatus $169,000 Closed
-
2020-08-12soldstatus $169,000
-
2020-06-24status Pending
-
2020-06-15$169,000 Active
-
2010-07-12soldstatus $17,500 Closed
-
2010-05-08status Pending
-
2010-04-26$17,000 Active
-
1998-10-22soldstatus $32,000
ⓘ Source: listings_history table (triggers on properties + properties_extension) + one-shot
backfill from property_details.listing_events for pre-trigger history.
Tax reassessment forecast CA · Resets to sale price
- Current annual tax
- $3,502 · $292/mo
- Projected year-2 tax
- $3,502 · $292/mo
- Expected delta
- $0/yr ($0/mo · 0.0%)
ⓘ Screening estimate from a state-policy table — verify with the county assessor before closing.
Climate risk First Street
- Flood 3/10 Moderate FEMA zone X (shaded) · 20% chance over 30 yrs
- Wildfire 6/10 Major
- Heat 9/10 Extreme 7 d/yr ≥109°F today · 21 d/yr by 30 yrs out
- Wind 1/10 Low
- Air quality 5/10 Major 7 unhealthy d/yr today · 10 by 30 yrs out
Nearby sold comps map
Loading sold comps map…
Walkable amenities ~0.75 mi
Loading nearby amenities…
Taxation est. · year 1
- Rental income
- $24,917
- − Mortgage interest
- −$12,603
- − Property taxes
- −$3,502
- − Insurance
- −$1,125
- − Repairs & maintenance
- −$1,993
- − Management
- −$1,993
- − Depreciation
- −$6,545
- Taxable loss
- −$2,846
- Est. tax savings @ 24.0%
- +$683
- After-tax cash flow
- $1,581/yr
For passive investors: Depreciation is non-cash, so a rental often shows a tax loss while cash-flowing — sheltering income. Rental losses are passive: they offset passive income freely, and up to $25,000/yr can offset ordinary (W-2) income if you actively participate and your MAGI is under $100k (phasing out to $0 by $150k); unused losses carry forward. On sale, claimed depreciation is recaptured at up to 25%, and gains may owe capital-gains tax (a 1031 exchange can defer both). Figures are a year-1 estimate at your 24.0% rate — not tax advice; consult a CPA.
Schools (NCES district)
- District
- Palm Springs Unified
- NCES district ID
- 0629550
- Math proficiency
- 21% ▼ -7.00%
- Reading proficiency
- 42% ▬ 0.00%
- Median HH income
- $43,638
- Composite
- 26.76/100
- National rank
- #7131
- State rank
- #328 of 517 in CA
Livability — Desert Hot Springs
- Score
- 49/100
- State rank
- #1149
- US rank
- #25774
Category grades
Schools grade is shown separately in the Schools card above.
Census & demographics
- Census place
- Desert Hot Springs, CA
- County
- Riverside County · 2,287,001 people
- City population
- 41,615
- Metro
- Riverside-San Bernardino-Ontario, CA
- Population (ZIP)
- 41,615
- Household income
- $54,023
- Rent vs Own
- Severe rent burden
- 2095.0
Population outlook (Riverside County) Hauer SSP2
- Today (2025)
- 2,664,475 people
- By 2030
- 2,802,692 · +5.2%
- By 2040
- 3,050,904 · +14.5%
- By 2050
- 3,256,783 · +22.2%
- By 2075
- 3,655,058 · +37.2%
- By 2100
- 3,766,594 · +41.4%
Race, ethnicity, and origin ACS 2023
- Neighborhood character
- Majority Hispanic (64%)
- Race & ethnicity
- Hispanic / Latino 64% Two or more races 27% White 23% Black 7% Native American 2% Asian 2%
- Hispanic origin (detail)
- Mexican 53%
- Common ancestry
- Lithuanian 1% Romanian 1% Italian 1%
- Foreign-born
- 27% · Canada, Vietnam
- Languages at home
- 47% English-only · Spanish 50% Russian/Polish/Slavic 1%
Political lean MEDSL · Riverside
- 2024 margin
- Toss-up / Even · D 48.0% · R 49.3% · Other 2.6%
- 2008→2024 swing
- -3.6pp toward R · 2008: 2.3pp · 2024: -1.3pp
- All cycles
- 2024: R+1.3 2020: D+8.0 2016: D+4.3 2012: R+0.4 2008: D+2.3
Not yet ingested
- Civics
- —
Market trends
- HPI YoY
- ▼ -102.10%
- Current HPI
- 418.4691
- Rent YoY
- ▲ 3.66%
- Metro
- Riverside-San Bernardino-Ontario, CA
- State GDP YoY
- ▲ 3.21%
- F500 in state
- 116
Industry mix (Fortune 500 HQ in CA)
| Industry | F500 HQs | Revenue |
|---|---|---|
| Technology | 27 | $1,492B |
|
||
| Financial Services | 3 | $174B |
|
||
| Retail | 3 | $44B |
|
||
| Insurance | 3 | $26B |
|
||
| Media / Entertainment | 2 | $115B |
|
||
| Pharmaceuticals / Biotech | 2 | $62B |
|
||
Price history
+603.1% since first listed13 events — show timeline
- 2026-05-10 Price Changed $225,000 CRMLS
- 2026-01-01 Price Changed $260,000 CRMLS
- 2025-11-22 Listed $275,000 CRMLS
- 2022-10-03 Listing Removed — CRMLS
- 2022-09-28 Listed $245,000 CRMLS
- 2020-08-17 Sold (MLS) $169,000 GPSMLS
- 2020-08-12 Sold (Public Records) $169,000 Public Records
- 2020-06-24 Pending — GPSMLS
- 2020-06-15 Listed $169,000 GPSMLS
- 2010-07-12 Sold (MLS) $17,500 CRMLS
- 2010-05-08 Pending — CRMLS
- 2010-04-26 Listed $17,000 CRMLS
- 1998-10-22 Sold (Public Records) $32,000 Public Records
Property tax history
+10.7%/yrLatest (2025): $3,502 · -0.9% YoY. Source: county tax records.
Cash-flow waterfall
monthlySold comps — $/sqft
last 12 mo · ≤1 miLoading sold comps…