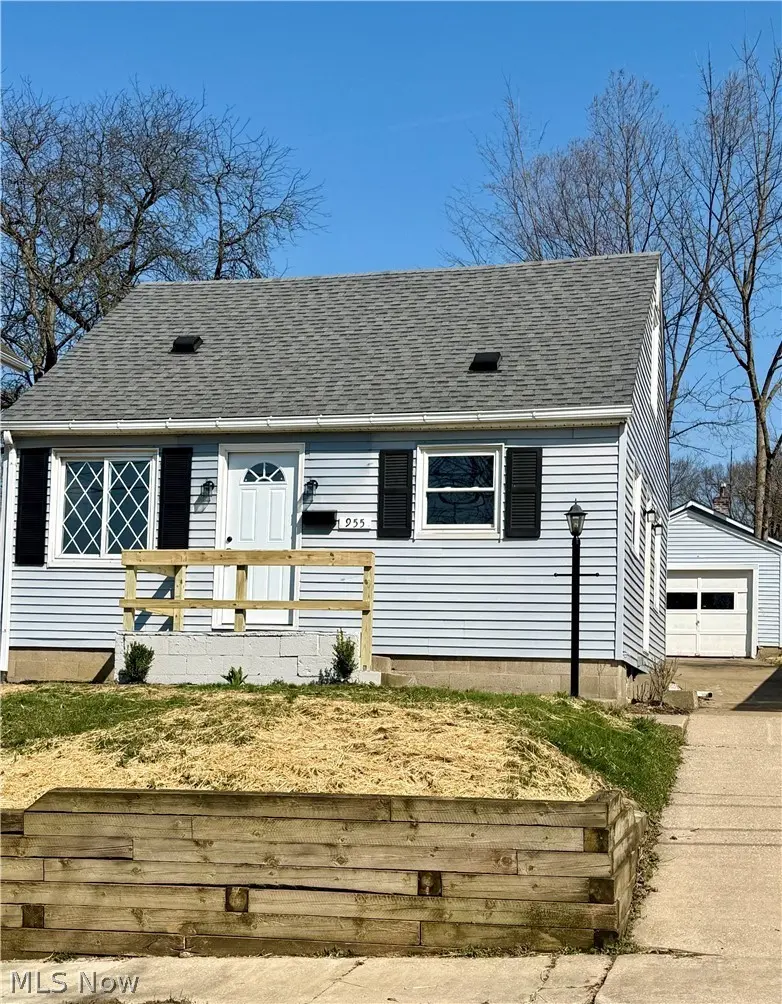
955 Iona Ave · Akron, OH
Flood risk 1/10 · Minimal
- FEMA flood zone
- X (unshaded)
- Chance of flooding over 30 yrs
- 0.0%
- Est. flood insurance / yr
- $473 – $860
Fire risk 1/10 · Minimal
- Est. fire insurance / yr
- $713 – $1,323
Heat risk 3/10 · Minor
- Hot days now (above 97°F)
- 7 days/yr
- Hot days in 30 yrs
- 17 days/yr
Wind risk 1/10 · Minimal
- Chance of severe wind over 30 yrs
- —
Air-quality risk 2/10 · Minimal
- Unhealthy air days now
- 0 days/yr
- Unhealthy air days in 30 yrs
- 1 days/yr
Risk factors via First Street. Map © Google.
Why this score? — see what drove the D grade
The composite is a weighted blend of 9 inputs, each scored 0–100. Each bar is that input's sub-score; the figure is the points it added to the 100-point composite (weight × sub-score).
- Cash flow +19.1/30.0
- DSCR +6.0/10.0
- 1% rule +5.1/10.0
- Livability +4.0/5.0
- Rent growth +3.5/5.0
- Condition / age +2.5/5.0
- Schools +2.1/10.0
- ARV discount +0.6/15.0
- Appreciation +0.0/10.0
$98,500
🖨 Deal sheet 📄 Offer letter ✓ Due diligence
Listing remarks
Fully renovated with a brand-new furnace and major updates throughout. The completely updated kitchen features butcher-block countertops and stainless steel appliances, while the fully remodeled bathroom includes a new tub and fixtures. New luxury vinyl plank flooring runs through the main areas, complemented by plush new carpet in the bedrooms. Updated lighting and fixtures throughout add a clean, modern finish. With significant mechanical and cosmetic improvements already completed, this move-in-ready home offers peace of mind and low-maintenance living.
Key facts
- Remodeled bathroom
- Updated kitchen
- New fixtures
Tags
Property features AI
Finance
- HOA & community: Community pool
Exterior
- Parking: Attached garage (1 car)
- Utilities: Public water; Public sewer
- Home design: Single-story home; 806 sq ft above-grade finished area
- Construction: Frame construction; Asphalt roof; Year built (assessor)
- Exterior features: Community pool
Interior
- Bedrooms: 2 main-level bedrooms
- Bathrooms: 1 full bathroom (main level)
- Heating & cooling: Forced-air heating (gas)
- Interior features: 5 total rooms; Unfinished basement
Neighborhood map
What this means for you Summary
Snapshot
- This is a 2-bed/1.0-bath single-family listed at $98k.
Deal economics
- At list price, monthly cash flow is $104 ($1k/yr) — positive.
- The deal already cash-flows at list — no discount required.
- Meets the 1% rule at list price ($995 rent vs $98k).
- Recommended offer: $96k (3.0% below list) — sets the bar for market timing.
Location & tenants
- Location reads 81/100 on livability (#104 in OH, #1,591 nationally) — a professional / high-income tenant draw. Strengths: amenities A+, commute A+, cost of living A+; Watch: crime F, employment F.
- Akron City (urban): math 22% / reading 30% proficiency, ranked #602 of 656 in OH (top 92%) — low school quality limits family demand, transient renter base, plan for 1-2y turnover; 66% free/reduced lunch — lower-income household profile, screen leases tightly.
- Market conditions: Rents rising (+3.9%/yr); 104 active listings in the ZIP; 25 comparable units currently listed for rent nearby; rentals at typical pace (median 23d on market — plan ~3-4 weeks tenant-placement turnaround); 1,114 units permitted in Summit County in 2024 (397 in 5+ unit buildings).
Forward outlook
- Local home prices are declining (-3.0%/yr); year-one equity from $681 of loan paydown is wiped out by about $3k of value loss. Plan a longer hold.
- Summit County population projected to shrink 6% by 2050 — rents likely to lag national; underwrite the cash flow, not the appreciation.
Negotiation context
- It's been on market 53 days — a 3% lower offer ($96k) is reasonable based on typical stale-listing flexibility.
- 5 sale attempts with the ask held roughly flat each time — persistent listings suggest the price (not the market) is what's stuck; bring a comps-based counter.
Risks & watch-outs
- Watch-outs: built in 1948 — expect roof / HVAC / electrical / plumbing capex.
Questions for the listing agent
- It's been on market 53 days. Have you received any prior offers? Is the seller open to a 3% concession, seller financing, or rate buy-down credit?
- Built in 1948 — when were the roof, HVAC, electrical panel, plumbing, and water heater last replaced?
- Is there a deadline driving the sale (1031 exchange, divorce, estate, relocation)? That informs how much negotiation room exists.
- Crime grade is F in this area — have there been break-ins, vandalism, or insurance claims at this property in the last 3 years? What carrier currently insures it and at what premium?
- The area grade is low — what's the realistic commute time and amenity access for the typical tenant pool here? Any planned neighborhood developments (good or bad) we should know about?
- What's the average days-on-market for RENTAL listings here right now (not sales)? A rising rental-DOM trend means longer vacancies and softer asking-rent achievability than the comps imply.
- What's the recent tenant-quality profile in this submarket — average credit score on applications, eviction rate, late-payment / NSF rate, and stable-employment percentage? A property-management company in the area should have these aggregated.
- How much new for-sale + rental construction is in the pipeline within 1–3 miles? Heavy new supply typically softens prices + rents 12–24 months out; constrained supply supports both.
Investment metrics
- 1% rule
- 1.01% ✓
- Cap rate
- 7.56%
- Cash-on-cash
- 4.53%
- DSCR
- 1.20
- GRM
- 8.2
CMA / ARV
- ARV (on-the-fly)
- $85,436
- Comps found
- 12
Show comp detail 12 sales within ~0.75 mi
| Address | Dist | Beds/Ba | Sqft | Sold | Price | $/sf | Match |
|---|---|---|---|---|---|---|---|
| 989 Harrison Ave | 0.09mi | 2/1.0 | 840 (+4%) | 8mo | $63,000 | $75 | 82 |
| 1882 16th St SW | 0.29mi | 2/1.0 | 818 (+2%) | 6mo | $86,000 | $105 | 78 |
| 1937 17th St SW | 0.19mi | 3/2.0 (+1) | 796 (-1%) | 11mo | $137,500 | $173 | 71 |
| 2217 Kimball Ct | 0.36mi | 2/1.0 | 782 (-3%) | 10mo | $83,000 | $106 | 70 |
| 979 Indian Trl | 0.38mi | 2/1.0 | 768 (-5%) | 15mo | $75,979 | $99 | 62 |
| 930 Saxon Ave | 0.47mi | 2/1.0 | 824 (+2%) | 16mo | $55,000 | $67 | 61 |
| 1188 Harpster Ave | 0.50mi | 2/1.5 | 780 (-3%) | 16mo | $85,000 | $109 | 55 |
| 1282 Kellogg Ave | 0.64mi | 2/1.0 | 750 (-7%) | 4mo | $75,000 | $100 | 55 |
| 2190 East Ave | 0.60mi | 2/1.0 | 852 (+6%) | 10mo | $70,500 | $83 | 54 |
| 1214 Chester Ave | 0.44mi | 2/1.0 | 716 (-11%) | 14mo | $80,000 | $112 | 49 |
| 1197 Sherwood Ave | 0.41mi | 3/1.0 (+1) | 912 (+13%) | 13mo | $127,000 | $139 | 43 |
| 1171 Jason Ave | 0.57mi | 3/1.0 (+1) | 922 (+14%) | 2mo | $155,000 | $168 | 43 |
Match score weights: distance 35% · size 25% · config 20% · recency 20%. Top-matched comps best support the ARV.
Projected returns pro-forma
-3.0% appreciation · 3.91% rent growth · sell at horizon
- IRR
- -8.2%
- Equity multiple
- 0.70×
- Total profit
- $-8,394
- Equity at exit
- $14,687
- IRR
- 2.5%
- Equity multiple
- 1.19×
- Total profit
- $5,138
- Equity at exit
- $8,516
Cash invested: $27,580 (down + closing). Projections, not guarantees.
Landlord ↔ Tenant lean methodology
- Overall (STATE)
- 73 Landlord-Friendly
- State Ohio
- 73 Landlord-Friendly · R+6
- County
- — inherits STATE
- City
- — inherits STATE
ZIP-level market 44314
- Rents YoY
- 3.9%
- Active inventory
- 104
- Price-to-rent
- 8.2×
Monthly cashflow live
- Estimated rent
- $995 high interval (Pro) →
- Mortgage (P&I)
- −$517
- Tax from tax record
- −$125 /mo · $1,495/yr
- Insurance
- −$41
- HOA
- −$0
- Vacancy / Maint / Mgmt
- −$209
- Net cashflow
- $104
Break-even live
UW: 25.0% down · 7.5% · 30yr · 1.5% tax · 5.0% vac · 8.0% maint · 8.0% mgmt
Financing live
Cash to close
- Down payment
- $24,625
- Closing costs
- $2,955
- Reserves months
- —
- Total cash needed
- —
Loan-product check · same deal, 3 products live
Conventional
25% down · 7.5% · 30yr
- Down + closing
- —
- Monthly P&I
- —
- Monthly cashflow
- —
- DSCR
- —
- Eligible?
- —
Personal DTI + credit; lowest rate.
DSCR
20% down · 8.5% · 30yr
- Down + closing
- —
- Monthly P&I
- —
- Monthly cashflow
- —
- DSCR
- —
- Eligible?
- —
No personal income docs; deal must DSCR.
Hard money
10% down · 12.0% · 12mo
- Down + closing
- —
- Monthly P&I
- —
- Monthly cashflow
- —
- DSCR
- —
- Eligible?
- —
Short-term bridge; refi at stabilization.
Rent comps 25 comps
| Address | Beds | Baths | Sqft | Rent | $/sqft | DOM | Units | Dist |
|---|---|---|---|---|---|---|---|---|
| 2047 20th St SW Akron, OH | 2.0 | 1.0 | 624 | $695 | $1.11 | 23d | 1 | 0.12mi |
| 2139 18th St SW Akron, OH | 2.0 | 1.0 | 992 | $1,100 | $1.11 | 43d | 1 | 0.17mi |
| 1035 Chester Ave Unit 1 Akron, OH | 2.0 | 1.0 | 624 | $900 | $1.44 | 23d | 1 | 0.23mi |
| 1035 Chester Ave Akron, OH | 2.0 | 1.0 | 624 | $900 | $1.44 | 14d | 1 | 0.24mi |
| 960 Jason Ave Akron, OH | 3.0 | 1.5 | 935 | $1,095 | $1.17 | 21d | 1 | 0.44mi |
| 1192 Harpster Ave Akron, OH | 1.0 | 1.0 | 684 | $868 | $1.27 | 14d | 1 | 0.50mi |
| 835 Kenmore Blvd Unit UP Akron, OH | 2.0 | 1.0 | 872 | $750 | $0.86 | 21d | 1 | 0.51mi |
| 2138 East Ave Akron, OH | 3.0 | 1.0 | 990 | $1,100 | $1.11 | 23d | 1 | 0.52mi |
| 847 Jason Ave Unit 1 Akron, OH | 2.0 | 1.0 | 798 | $825 | $1.03 | 23d | 1 | 0.53mi |
| 781 Saxon Ave Akron, OH | 2.0 | 1.0 | 800 | $900 | $1.12 | 43d | 1 | 0.64mi |
| 2264 5th St SW Unit 2266 Akron, OH | 2.0 | 1.0 | 676 | $750 | $1.11 | 14d | 1 | 0.78mi |
| 2266 5th St SW Akron, OH | 2.0 | 1.0 | 676 | $750 | $1.11 | 14d | 1 | 0.78mi |
| 1253 California Ave Akron, OH | 2.0 | 1.0 | 780 | $950 | $1.22 | 23d | 1 | 0.83mi |
| 1253 California Ave Akron, OH | 2.0 | 1.0 | 780 | $1,100 | $1.41 | 44d | 1 | 0.83mi |
| 899 Rosamond Ave Akron, OH | 1.0–2.0 | 1.0 | 690 | $825 | $1.20 | 23d | 1 | 0.89mi |
| 1455 Woodbirch Ave Akron, OH | 3.0 | 2.0 | 1008 | $1,500 | $1.49 | 21d | 1 | 1.00mi |
| 1453 Woodbirch Ave Akron, OH | 3.0 | 2.0 | 1008 | $1,500 | $1.49 | 43d | 1 | 1.01mi |
| 2569 Romig Rd Unit 2597-1N Akron, OH | 1.0 | 1.0 | 675 | $925 | $1.37 | 14d | 1 | 1.02mi |
| 2569 Romig Rd Unit 2561-16 Akron, OH | 2.0 | 1.5 | 810 | $1,125 | $1.39 | 14d | 1 | 1.02mi |
| 1032 Andrew St Akron, OH | 3.0 | 1.0 | 960 | $1,097 | $1.14 | 43d | 1 | 1.05mi |
| 1138 Kohler Ave Akron, OH | 3.0 | 1.0 | 1000 | $1,250 | $1.25 | 14d | 1 | 1.09mi |
| 685 Longview Ave Akron, OH | 3.0 | 1.0 | 1100 | $1,150 | $1.05 | 43d | 1 | 1.22mi |
| 1069 Fess Ave Akron, OH | 2.0 | 1.0 | 940 | $1,095 | $1.16 | 43d | 1 | 1.22mi |
| 1169 Weiser Ave Akron, OH | 2.0 | 1.0 | 768 | $950 | $1.24 | 43d | 1 | 1.25mi |
| 1494 Diagonal Rd Akron, OH | 3.0 | 1.0 | 1064 | $1,495 | $1.41 | 43d | 1 | 1.44mi |
Listing history 15 events
-
2026-05-22status Pending
-
2026-04-27historical Contingent
-
2026-04-13status Active
-
2026-04-02historical Contingent
-
2026-03-30$98,500 Active
-
2026-03-06historical
-
2026-02-26price $99,500
-
2026-01-24price $99,900
-
2026-01-07$109,400 Active
-
2026-01-07historical
-
2025-12-21price $109,900
-
2025-12-02$116,900 Active
-
2025-12-02historical
-
2025-11-20price $119,900
-
2025-11-07$122,900 Active
ⓘ Source: listings_history table (triggers on properties + properties_extension) + one-shot
backfill from property_details.listing_events for pre-trigger history.
Tax reassessment forecast OH · Partial reset (capped growth)
- Current annual tax
- $1,495 · $125/mo
- Projected year-2 tax
- $1,516 · $126/mo
- Expected delta
- +$21/yr (+$2/mo · 1.4%)
ⓘ Screening estimate from a state-policy table — verify with the county assessor before closing.
Climate risk First Street
- Flood 1/10 Low FEMA zone X (unshaded) · 0% chance over 30 yrs
- Wildfire 1/10 Low
- Heat 3/10 Moderate 7 d/yr ≥97°F today · 17 d/yr by 30 yrs out
- Wind 1/10 Low
- Air quality 2/10 Low 0 unhealthy d/yr today · 1 by 30 yrs out
Nearby sold comps map
Loading sold comps map…
Walkable amenities ~0.75 mi
Loading nearby amenities…
Taxation est. · year 1
- Rental income
- $11,944
- − Mortgage interest
- −$5,518
- − Property taxes
- −$1,495
- − Insurance
- −$492
- − Repairs & maintenance
- −$956
- − Management
- −$956
- − Depreciation
- −$2,865
- Taxable loss
- −$338
- Est. tax savings @ 24.0%
- +$81
- After-tax cash flow
- $1,331/yr
For passive investors: Depreciation is non-cash, so a rental often shows a tax loss while cash-flowing — sheltering income. Rental losses are passive: they offset passive income freely, and up to $25,000/yr can offset ordinary (W-2) income if you actively participate and your MAGI is under $100k (phasing out to $0 by $150k); unused losses carry forward. On sale, claimed depreciation is recaptured at up to 25%, and gains may owe capital-gains tax (a 1031 exchange can defer both). Figures are a year-1 estimate at your 24.0% rate — not tax advice; consult a CPA.
Schools (NCES district)
- District
- Akron City
- NCES district ID
- 3904348
- Math proficiency
- 22% ▼ -17.00%
- Reading proficiency
- 30% ▼ -12.00%
- Median HH income
- $33,811
- Composite
- 21.31/100
- National rank
- #8383
- State rank
- #602 of 656 in OH
Livability — Akron
- Score
- 81/100
- State rank
- #104
- US rank
- #1591
Category grades
Schools grade is shown separately in the Schools card above.
Census & demographics
- Census place
- Akron, OH
- County
- Summit County · 440,783 people
- City population
- 174,375
- Metro
- Akron, OH
- Population (ZIP)
- 17,885
- Household income
- $47,468
- Rent vs Own
- Severe rent burden
- 975.0
Population outlook (Summit County) Hauer SSP2
- Today (2025)
- 546,583 people
- By 2030
- 544,028 · -0.5%
- By 2040
- 531,363 · -2.8%
- By 2050
- 514,923 · -5.8%
- By 2075
- 481,765 · -11.9%
- By 2100
- 432,265 · -20.9%
Race, ethnicity, and origin ACS 2023
- Neighborhood character
- Predominantly White (69%)
- Race & ethnicity
- White 69% Black 16% Two or more races 12% Hispanic / Latino 3% Asian 3%
- Common ancestry
- Slovak 2% Romanian 2% Lithuanian 1%
- Foreign-born
- 3% · India, Canada, Philippines
- Languages at home
- 96% English-only · Chinese 2% Russian/Polish/Slavic 1% Spanish 1%
Political lean MEDSL · Summit
- 2024 margin
- Lean D (+7.0) · D 53.0% · R 46.0%
- 2008→2024 swing
- -9.6pp toward R · 2008: 16.6pp · 2024: 7.0pp
- All cycles
- 2024: D+7.0 2020: D+9.6 2016: D+8.2 2012: D+14.8 2008: D+16.6
Not yet ingested
- Civics
- —
Market trends
- HPI YoY
- ▼ -166.61%
- Current HPI
- 151.066
- Rent YoY
- ▲ 3.91%
- Metro
- Akron, OH
- State GDP YoY
- ▲ 1.98%
- F500 in state
- 48
Industry mix (Fortune 500 HQ in OH)
| Industry | F500 HQs | Revenue |
|---|---|---|
| Insurance | 3 | $145B |
|
||
| Industrial Machinery | 3 | $49B |
|
||
| Financial Services | 3 | $24B |
|
||
| Consumer Goods | 2 | $93B |
|
||
| Aerospace / Defense | 2 | $47B |
|
||
| Utilities | 2 | $33B |
|
||
Price history
-19.9% since first listed15 events — show timeline
- 2026-05-22 Pending — MLSNOW
- 2026-04-27 Contingent — MLSNOW
- 2026-04-13 Relisted — MLSNOW
- 2026-04-02 Contingent — MLSNOW
- 2026-03-30 Listed $98,500 MLSNOW
- 2026-03-06 Listing Removed — MLSNOW
- 2026-02-26 Price Changed $99,500 MLSNOW
- 2026-01-24 Price Changed $99,900 MLSNOW
- 2026-01-07 Listing Removed — MLSNOW
- 2026-01-07 Listed $109,400 MLSNOW
- 2025-12-21 Price Changed $109,900 MLSNOW
- 2025-12-02 Listing Removed — MLSNOW
- 2025-12-02 Listed $116,900 MLSNOW
- 2025-11-20 Price Changed $119,900 MLSNOW
- 2025-11-07 Listed $122,900 MLSNOW
Property tax history
+7.5%/yrLatest (2025): $1,495 · +5.7% YoY. Source: county tax records.
Cash-flow waterfall
monthlySold comps — $/sqft
last 12 mo · ≤1 miLoading sold comps…