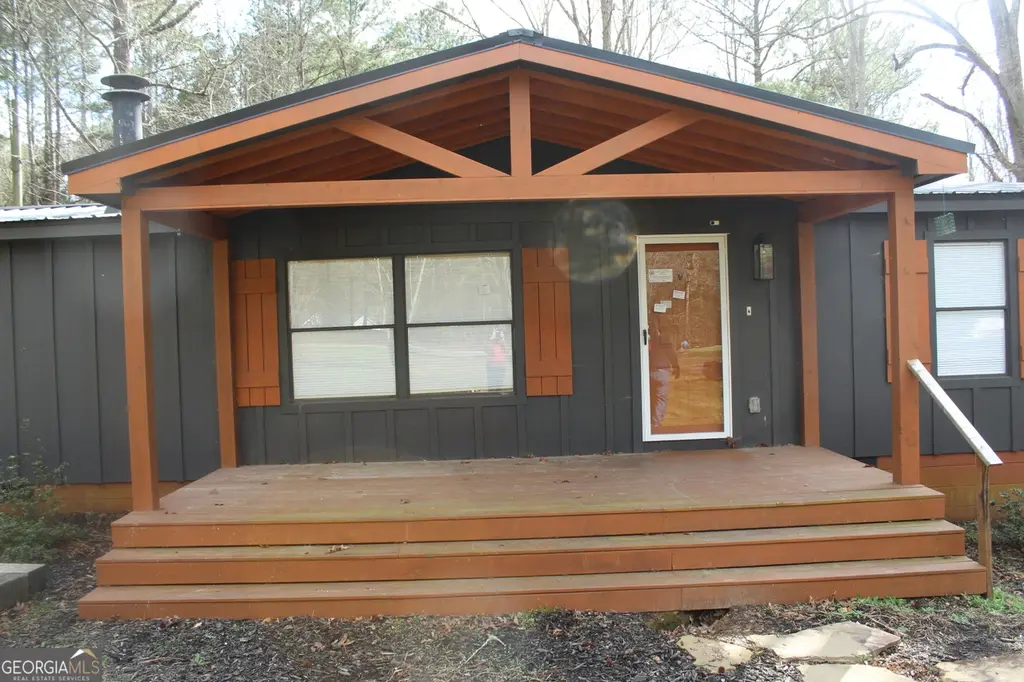
163 Sanders Rd · Jackson, GA
Flood risk 1/10 · Minimal
- FEMA flood zone
- X (unshaded)
- Chance of flooding over 30 yrs
- 0.0%
- Est. flood insurance / yr
- $507 – $1,088
Fire risk 4/10 · Minor
- Est. fire insurance / yr
- $963 – $1,789
Heat risk 6/10 · Moderate
- Hot days now (above 108°F)
- 7 days/yr
- Hot days in 30 yrs
- 17 days/yr
Wind risk 6/10 · Moderate
- Chance of severe wind over 30 yrs
- 33.0%
Air-quality risk 3/10 · Minor
- Unhealthy air days now
- 3 days/yr
- Unhealthy air days in 30 yrs
- 3 days/yr
Risk factors via First Street. Map © Google.
Why this score? — see what drove the D grade
The composite is a weighted blend of 9 inputs, each scored 0–100. Each bar is that input's sub-score; the figure is the points it added to the 100-point composite (weight × sub-score).
- ARV discount +14.3/15.0
- Cash flow +11.4/30.0
- DSCR +3.3/10.0
- Livability +2.8/5.0
- Rent growth +2.5/5.0
- Condition / age +2.5/5.0
- Schools +2.4/10.0
- 1% rule +2.3/10.0
- Appreciation +0.0/10.0
$229,900
🖨 Deal sheet 📄 Offer letter ✓ Due diligence
Listing remarks MLS
Discover the serenity and peace on your own 3.22 acres of paradise. This modern home has 3 bedrooms, 2 bathrooms, family room with fireplace, and open kitchen and dining room combo. The owner's suite has a tub and tile shower, plus vanity and double mirrors. Relax on the large deck that overlooks the large, fenced backyard. Bring your vision and discover the peace and quiet of country living. Vacant but schedule through showingtime to get the lxbx code.
Key facts
- Large deck
- Country living
- 3.22 acres
Tags
Neighborhood map
What this means for you Summary
Snapshot
- This is a 3-bed/2.0-bath single-family listed at $230k.
Deal economics
- At list price, monthly cash flow is $-81 ($-970/yr) — negative.
- To cash-flow at today's rent, offer at most $216k (6.2% below list).
- To meet the 1% rule (rent ≥ 1% of price), the offer needs to be $168k (26.8% below list).
- Recommended offer: $168k (26.8% below list) — sets the bar for 1% rule.
- Cap rate 5.9% vs local median 3.7% in Jackson — top-decile yield for the area; either an underpriced asset or a hidden risk that comps aren't pricing in. Stress-test before assuming the spread holds.
Location & tenants
- Location reads 56/100 on livability (#482 in GA) — a working-class tenant base; expect higher turnover. Strengths: cost of living A+, housing A+; Watch: schools F, amenities F, commute F.
- Butts County (rural): math 24% / reading 31% proficiency, ranked #103 of 174 in GA (top 59%) — low school quality limits family demand, transient renter base, plan for 1-2y turnover; 61% free/reduced lunch — lower-income household profile, screen leases tightly.
- Market conditions: 321 active listings in the ZIP; 60 units permitted in Butts County in 2024 (0 in 5+ unit buildings).
Forward outlook
- Local home prices are declining (-3.0%/yr); year-one equity from $2k of loan paydown is wiped out by about $7k of value loss. Plan a longer hold.
- Butts County population projected at -17% by 2050 — secular population decline; favor cash flow + early exit over multi-decade hold.
Negotiation context
- It's been on market 63 days — a 6% lower offer ($216k) is reasonable based on typical stale-listing flexibility.
- 9 sale attempts since 14y ago; this cycle's ask has dropped $30k (12%) from the opening price — seller is motivated, your offer sets the floor, not the list.
Risks & watch-outs
- Climate carrying-cost: major wind risk, 33% chance of damaging wind over 30y; extreme-heat days projected 7→17/yr by 2055 (HVAC capex compounding) — expect insurance premiums to compound above CPI over the hold.
Questions for the listing agent
- What do current leases actually rent for vs. the listed asking? Can we see a recent rent roll and the last 12 months of T-12 income?
- It's been on market 63 days. Have you received any prior offers? Is the seller open to a 27% concession, seller financing, or rate buy-down credit?
- Why hasn't it sold? Are there any deal-killer items the seller is aware of (foundation, flood, title, zoning, code violations)?
- Is there a deadline driving the sale (1031 exchange, divorce, estate, relocation)? That informs how much negotiation room exists.
- Schools are F-rated, which usually means shorter tenancies and higher turnover. Who's the typical renter profile here, and what's been the actual vacancy rate?
- The area grade is low — what's the realistic commute time and amenity access for the typical tenant pool here? Any planned neighborhood developments (good or bad) we should know about?
- What's the average days-on-market for RENTAL listings here right now (not sales)? A rising rental-DOM trend means longer vacancies and softer asking-rent achievability than the comps imply.
- What's the recent tenant-quality profile in this submarket — average credit score on applications, eviction rate, late-payment / NSF rate, and stable-employment percentage? A property-management company in the area should have these aggregated.
- How much new for-sale + rental construction is in the pipeline within 1–3 miles? Heavy new supply typically softens prices + rents 12–24 months out; constrained supply supports both.
Investment metrics
- 1% rule
- 0.73% ✗
- Cap rate
- 5.87%
- Cash-on-cash
- -1.51%
- DSCR
- 0.93
- GRM
- 11.4
CMA / ARV
- ARV (median comp)
- $271,014
- List price
- $229,900
- Delta
- -15.17%
- Verdict
- UNDERPRICED
- Comps
- 14 within 1.0 mi
Show comp detail 4 sales within ~0.75 mi
| Address | Dist | Beds/Ba | Sqft | Sold | Price | $/sf | Match |
|---|---|---|---|---|---|---|---|
| 158 Sanders Rd | 0.07mi | 3/2.0 | 1,507 (+14%) | 6mo | $277,000 | $184 | 68 |
| 129 Old Kersey Rd | 0.42mi | 3/2.0 | 1,467 (+11%) | 1mo | $294,000 | $200 | 61 |
| 739 Barnetts Bridge Rd | 0.58mi | 3/2.0 | 1,405 (+6%) | 6mo | $175,000 | $125 | 58 |
| 160 C Hamm Rd Unit C | 0.49mi | 3/2.0 | 1,515 (+14%) | 9mo | $339,900 | $224 | 45 |
Match score weights: distance 35% · size 25% · config 20% · recency 20%. Top-matched comps best support the ARV.
Projected returns pro-forma
-3.0% appreciation · 3.0% rent growth · sell at horizon
- IRR
- -18.8%
- Equity multiple
- 0.34×
- Total profit
- $-42,485
- Equity at exit
- $34,279
- IRR
- -11.4%
- Equity multiple
- 0.32×
- Total profit
- $-43,964
- Equity at exit
- $19,878
Cash invested: $64,372 (down + closing). Projections, not guarantees.
Landlord ↔ Tenant lean methodology
- Overall (STATE)
- 90 Strongly Landlord-Friendly
- State Georgia
- 90 Strongly Landlord-Friendly · R+3
- County
- — inherits STATE
- City
- — inherits STATE
ZIP-level market 30233
- Home prices YoY
- -3.9%
- Active inventory
- 321
- Price-to-rent
- 11.4×
Monthly cashflow live
- Estimated rent
- $1,683 medium interval (Pro) →
- Mortgage (P&I)
- −$1,206
- Tax from tax record
- −$109 /mo · $1,312/yr
- Insurance
- −$96
- HOA
- −$0
- Vacancy / Maint / Mgmt
- −$354
- Net cashflow
- $-81
Break-even live
UW: 25.0% down · 7.5% · 30yr · 1.5% tax · 5.0% vac · 8.0% maint · 8.0% mgmt
Financing live
Cash to close
- Down payment
- $57,475
- Closing costs
- $6,897
- Reserves months
- —
- Total cash needed
- —
Loan-product check · same deal, 3 products live
Conventional
25% down · 7.5% · 30yr
- Down + closing
- —
- Monthly P&I
- —
- Monthly cashflow
- —
- DSCR
- —
- Eligible?
- —
Personal DTI + credit; lowest rate.
DSCR
20% down · 8.5% · 30yr
- Down + closing
- —
- Monthly P&I
- —
- Monthly cashflow
- —
- DSCR
- —
- Eligible?
- —
No personal income docs; deal must DSCR.
Hard money
10% down · 12.0% · 12mo
- Down + closing
- —
- Monthly P&I
- —
- Monthly cashflow
- —
- DSCR
- —
- Eligible?
- —
Short-term bridge; refi at stabilization.
Listing history 46 events
-
2026-06-18days on market $229,900 Active 63 DOM
-
2026-06-17days on market $229,900 Active 62 DOM
-
2026-06-16days on market $229,900 Active 61 DOM
-
2026-06-15days on market $229,900 Active 60 DOM
-
2026-06-13days on market $229,900 Active 58 DOM
-
2026-06-09days on market $229,900 Active 54 DOM
-
2026-06-08remarks 480-char remark
-
2026-06-08days on market $229,900 Active 53 DOM
-
2026-06-07days on market $229,900 Active 52 DOM
-
2026-06-04days on market $229,900 Active 49 DOM
-
2026-06-03days on market $229,900 Active 48 DOM
-
2026-06-02days on market $229,900 Active 47 DOM
-
2026-06-01days on market $229,900 Active 46 DOM
-
2026-05-31days on market $229,900 Active 45 DOM
-
2026-04-16historical
-
2026-03-18$259,900 New
-
2026-03-17$259,900 New 461-char remark
Show marketing remark (461 chars)
Discover the serenity and peace on your own 3.22 acres of paradise. This modern home has 3 bedrooms, 2 bathrooms, family room with fireplace, and open kitchen and dining room combo. The owner's suite has a tub and tile shower, plus vanity and double mirrors. Relax on the large deck that overlooks the large, fenced backyard. Bring your vision and discover the peace and quiet of country living. Vacant but schedule through showingtime to get the lxbx code.
-
2023-07-21soldstatus $268,000
-
2023-07-20soldstatus $268,000 Sold
-
2023-06-21status Under Contract
-
2023-06-16historical
-
2023-05-26status Back On Market
-
2023-05-26status Under Contract
-
2023-05-10$269,900 New
-
2023-05-10$289,900 New
-
2022-09-08soldstatus $55,000
-
2017-10-20soldstatus $55,000
-
2017-08-25soldstatus $55,000 Sold
-
2017-07-28status Under Contract
-
2017-07-25$59,250 New
-
2013-04-06price $37,500
-
2013-04-03soldstatus $37,500
-
2013-03-21soldstatus $37,500 Sold
-
2013-03-13status Under Contract
-
2013-03-06price $45,000
-
2013-02-25$45,000 New
-
2013-01-24price $20,000
-
2012-10-12soldstatus $20,000 Sold
-
2012-09-21historical
-
2012-09-20price $22,250
-
2012-09-12price $22,250 Back On Market
-
2012-09-12status Back On Market
-
2012-03-15historical
-
2012-02-21price $23,250
-
2012-01-26$27,250 New
-
1999-07-02soldstatus $13,900
ⓘ Source: listings_history table (triggers on properties + properties_extension) + one-shot
backfill from property_details.listing_events for pre-trigger history.
Tax reassessment forecast GA · Resets to sale price
- Current annual tax
- $1,312 · $109/mo
- Projected year-2 tax
- $2,115 · $176/mo
- Expected delta
- +$803/yr (+$67/mo · 61.2%)
ⓘ Screening estimate from a state-policy table — verify with the county assessor before closing.
Climate risk First Street
- Flood 1/10 Low FEMA zone X (unshaded) · 0% chance over 30 yrs
- Wildfire 4/10 Moderate
- Heat 6/10 Major 7 d/yr ≥108°F today · 17 d/yr by 30 yrs out
- Wind 6/10 Major 33% chance of damaging wind over 30 yrs
- Air quality 3/10 Moderate 3 unhealthy d/yr today · 3 by 30 yrs out
Nearby sold comps map
Loading sold comps map…
Walkable amenities ~0.75 mi
Loading nearby amenities…
Taxation est. · year 1
- Rental income
- $20,202
- − Mortgage interest
- −$12,878
- − Property taxes
- −$1,312
- − Insurance
- −$1,150
- − Repairs & maintenance
- −$1,616
- − Management
- −$1,616
- − Depreciation
- −$6,688
- Taxable loss
- −$5,058
- Est. tax savings @ 24.0%
- +$1,214
- After-tax cash flow
- $244/yr
For passive investors: Depreciation is non-cash, so a rental often shows a tax loss while cash-flowing — sheltering income. Rental losses are passive: they offset passive income freely, and up to $25,000/yr can offset ordinary (W-2) income if you actively participate and your MAGI is under $100k (phasing out to $0 by $150k); unused losses carry forward. On sale, claimed depreciation is recaptured at up to 25%, and gains may owe capital-gains tax (a 1031 exchange can defer both). Figures are a year-1 estimate at your 24.0% rate — not tax advice; consult a CPA.
Schools (NCES district)
- District
- Butts County
- NCES district ID
- 1300690
- Math proficiency
- 24% ▼ -4.00%
- Reading proficiency
- 31% ▼ -1.00%
- Median HH income
- $45,248
- Composite
- 23.65/100
- National rank
- #7842
- State rank
- #103 of 174 in GA
Livability — Jackson
- Score
- 56/100
- State rank
- #482
- US rank
- #22448
Category grades
Schools grade is shown separately in the Schools card above.
Census & demographics
- County
- Butts County · 24,730 people
- City population
- 24,730
- Metro
- Atlanta-Sandy Springs-Alpharetta, GA
- Population (ZIP)
- 24,730
- Household income
- $74,222
- Rent vs Own
- Severe rent burden
- 88.0
Population outlook (Butts County) Hauer SSP2
- Today (2025)
- 22,763 people
- By 2030
- 22,127 · -2.8%
- By 2040
- 20,591 · -9.5%
- By 2050
- 18,978 · -16.6%
- By 2075
- 15,292 · -32.8%
- By 2100
- 11,404 · -49.9%
Race, ethnicity, and origin ACS 2023
- Neighborhood character
- Predominantly White (73%)
- Race & ethnicity
- White 73% Black 19% Two or more races 6% Hispanic / Latino 4%
- Common ancestry
- Slovak 1% Serbian 1% Romanian 1%
- Foreign-born
- 2% · Canada
- Languages at home
- 96% English-only · Spanish 4%
Political lean MEDSL · Butts
- 2024 margin
- Solid R (+45.2) · D 27.2% · R 72.4%
- 2008→2024 swing
- -13.5pp toward R · 2008: -31.7pp · 2024: -45.2pp
- All cycles
- 2024: R+45.2 2020: R+43.6 2016: R+43.8 2012: R+35.6 2008: R+31.7
Not yet ingested
- Civics
- —
Market trends
- HPI YoY
- ▼ -12.98%
- Current HPI
- 316.5436
- Rent YoY
- —
- Metro
- Atlanta-Sandy Springs-Alpharetta, GA
- State GDP YoY
- ▲ 2.66%
- F500 in state
- 28
Industry mix (Fortune 500 HQ in GA)
| Industry | F500 HQs | Revenue |
|---|---|---|
| Paper / Packaging | 2 | $29B |
|
||
| Retail | 1 | $160B |
|
||
| Transportation / Logistics | 1 | $91B |
|
||
| Airlines | 1 | $62B |
|
||
| Consumer Goods | 1 | $47B |
|
||
| Utilities | 1 | $25B |
|
||
Price history
+1769.8% since first listed32 events — show timeline
- 2026-04-16 Listing Removed — GAMLS
- 2026-03-18 Listed $259,900 GAMLS
- 2026-03-17 Listed $259,900 GAMLS
- 2023-07-21 Sold (Public Records) $268,000 Public Records
- 2023-07-20 Sold (MLS) $268,000 GAMLS
- 2023-06-21 Pending — GAMLS
- 2023-06-16 Listing Removed — GAMLS
- 2023-05-26 Relisted — GAMLS
- 2023-05-26 Pending — GAMLS
- 2023-05-10 Listed $289,900 GAMLS
- 2023-05-10 Listed $269,900 GAMLS
- 2022-09-08 Sold (Public Records) $55,000 Public Records
- 2017-10-20 Sold (Public Records) $55,000 Public Records
- 2017-08-25 Sold (MLS) $55,000 GAMLS
- 2017-07-28 Pending — GAMLS
- 2017-07-25 Listed $59,250 GAMLS
- 2013-04-06 Price Changed $37,500 GAMLS
- 2013-04-03 Sold (Public Records) $37,500 Public Records
- 2013-03-21 Sold (MLS) $37,500 GAMLS
- 2013-03-13 Pending — GAMLS
- 2013-03-06 Price Changed $45,000 GAMLS
- 2013-02-25 Listed $45,000 GAMLS
- 2013-01-24 Price Changed $20,000 GAMLS
- 2012-10-12 Sold (MLS) $20,000 GAMLS
- 2012-09-21 Listing Removed — GAMLS
- 2012-09-20 Price Changed $22,250 GAMLS
- 2012-09-12 Relisted — GAMLS
- 2012-09-12 Price Changed $22,250 GAMLS
- 2012-03-15 Listing Removed — GAMLS
- 2012-02-21 Price Changed $23,250 GAMLS
- 2012-01-26 Listed $27,250 GAMLS
- 1999-07-02 Sold (Public Records) $13,900 Public Records
Property tax history
+3.1%/yrLatest (2025): $1,312 · -8.1% YoY. Source: county tax records.
Cash-flow waterfall
monthlySold comps — $/sqft
last 12 mo · ≤1 miLoading sold comps…