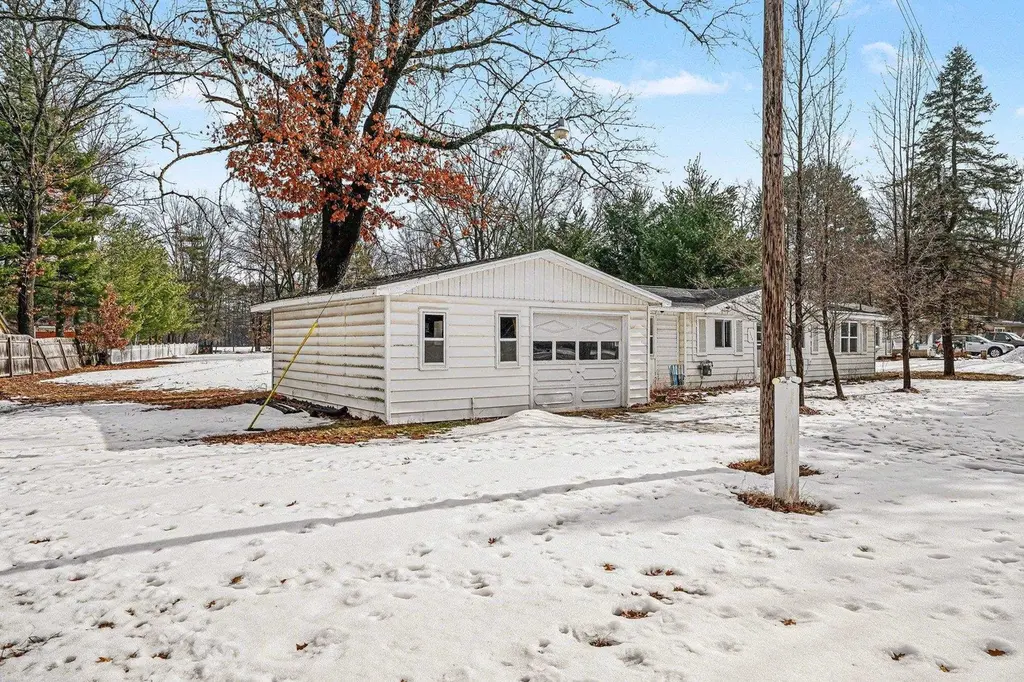
1654 Opland Rd · Sage, MI
Flood risk 1/10 · Minimal
- FEMA flood zone
- X (unshaded)
- Chance of flooding over 30 yrs
- 0.0%
- Est. flood insurance / yr
- $473 – $860
Fire risk 4/10 · Minor
- Est. fire insurance / yr
- $784 – $1,456
Heat risk 2/10 · Minimal
- Hot days now (above 95°F)
- 7 days/yr
- Hot days in 30 yrs
- 14 days/yr
Wind risk 1/10 · Minimal
- Chance of severe wind over 30 yrs
- —
Air-quality risk 2/10 · Minimal
- Unhealthy air days now
- 1 days/yr
- Unhealthy air days in 30 yrs
- 1 days/yr
Risk factors via First Street. Map © Google.
Why this score? — see what drove the C+ grade
The composite is a weighted blend of 9 inputs, each scored 0–100. Each bar is that input's sub-score; the figure is the points it added to the 100-point composite (weight × sub-score).
- Cash flow +30.0/30.0
- DSCR +10.0/10.0
- 1% rule +9.4/10.0
- Schools +3.3/10.0
- Rent growth +2.5/5.0
- Livability +2.5/5.0
- Condition / age +2.5/5.0
- ARV discount +0.0/15.0
- Appreciation +0.0/10.0
$149,000
🖨 Deal sheet 📄 Offer letter ✓ Due diligence
Listing remarks MLS
Live the lake life without sacrificing privacy! Situated just off Pratt Lake on a spacious one-acre lot, this ranch-style home features three bedrooms, one bath and easy main-floor living. The expansive yard provides plenty of room for outdoor entertaining, gardening, or adding a pole building for storage. Enjoy peaceful country views with convenient lake access just minutes away-the perfect setting for relaxation and recreation.
Key facts
- One acre lot
- Outdoor entertaining
- Lake access
Tags
Neighborhood map
What this means for you Summary
Snapshot
- This is a 3-bed/1.0-bath single-family listed at $149k.
Deal economics
- At list price, monthly cash flow is $822 ($10k/yr) — positive.
- The deal already cash-flows at list — no discount required.
- Meets the 1% rule at list price ($2k rent vs $149k).
- Recommended offer: $136k (9.0% below list) — sets the bar for market timing.
Location & tenants
- Location reads: area grade C — affects rentability + tenant quality, not the cash-flow math above.
- Gladwin Community Schools (town): math 28% / reading 51% proficiency, ranked #232 of 540 in MI (top 43%) — families likely to look elsewhere, expect single-tenant / working-renter base with shorter leases.
- Market conditions: 287 active listings in the ZIP; 90 units permitted in Gladwin County in 2024 (0 in 5+ unit buildings).
Forward outlook
- Local home prices are declining (-3.0%/yr); year-one equity from $1k of loan paydown is wiped out by about $4k of value loss. Plan a longer hold.
- Gladwin County population projected at -25% by 2050 — secular population decline; favor cash flow + early exit over multi-decade hold.
- At projected returns (-3.0% appreciation + 3.0% rent growth), your $42k cash investment doubles in ~6 years — after that, you're playing with house money.
Negotiation context
- It's been on market 118 days — a 9% lower offer ($136k) is reasonable based on typical stale-listing flexibility.
- 8 sale attempts since 12y ago with the ask held roughly flat each time — persistent listings suggest the price (not the market) is what's stuck; bring a comps-based counter.
- Current owner paid $41k; list at $149k implies a 263% gain — meaningful room to come down on a strong offer.
Questions for the listing agent
- It's been on market 118 days. Have you received any prior offers? Is the seller open to a 9% concession, seller financing, or rate buy-down credit?
- Why hasn't it sold? Are there any deal-killer items the seller is aware of (foundation, flood, title, zoning, code violations)?
- Is there a deadline driving the sale (1031 exchange, divorce, estate, relocation)? That informs how much negotiation room exists.
- What's the average days-on-market for RENTAL listings here right now (not sales)? A rising rental-DOM trend means longer vacancies and softer asking-rent achievability than the comps imply.
- What's the recent tenant-quality profile in this submarket — average credit score on applications, eviction rate, late-payment / NSF rate, and stable-employment percentage? A property-management company in the area should have these aggregated.
- How much new for-sale + rental construction is in the pipeline within 1–3 miles? Heavy new supply typically softens prices + rents 12–24 months out; constrained supply supports both.
Investment metrics
- 1% rule
- 1.44% ✓
- Cap rate
- 12.91%
- Cash-on-cash
- 23.64%
- DSCR
- 2.05
- GRM
- 5.8
CMA / ARV
- ARV (median comp)
- $113,113
- List price
- $149,000
- Delta
- 31.73%
- Verdict
- OVERPRICED
- Comps
- 20 within 1.0 mi
Show comp detail 3 sales within ~0.75 mi
| Address | Dist | Beds/Ba | Sqft | Sold | Price | $/sf | Match |
|---|---|---|---|---|---|---|---|
| 1524 E Lake Point Dr | 0.36mi | 3/2.0 | 1,139 (+1%) | 13mo | $215,000 | $189 | 66 |
| 1695 Opland Rd | 0.07mi | 2/1.0 (-1) | 981 (-13%) | 12mo | $155,896 | $159 | 60 |
| 4876 Cedar Dr Dr | 0.72mi | 3/1.5 | 1,100 (-2%) | 4mo | $132,500 | $120 | 57 |
Match score weights: distance 35% · size 25% · config 20% · recency 20%. Top-matched comps best support the ARV.
Projected returns pro-forma
-3.0% appreciation · 3.0% rent growth · sell at horizon
- IRR
- 16.7%
- Equity multiple
- 1.67×
- Total profit
- $28,136
- Equity at exit
- $22,216
- IRR
- 25.3%
- Equity multiple
- 3.20×
- Total profit
- $91,642
- Equity at exit
- $12,883
Cash invested: $41,720 (down + closing). Projections, not guarantees.
Landlord ↔ Tenant lean methodology
- Overall (STATE)
- 62 Landlord-Friendly
- State Michigan
- 62 Landlord-Friendly · EVEN
- County
- — inherits STATE
- City
- — inherits STATE
ZIP-level market 48624
- Home prices YoY
- -23.4%
- Active inventory
- 287
- Price-to-rent
- 5.8×
Monthly cashflow live
- Estimated rent
- $2,145 medium interval (Pro) →
- Mortgage (P&I)
- −$781
- Tax from tax record
- −$29 /mo · $352/yr
- Insurance
- −$62
- HOA
- −$0
- Vacancy / Maint / Mgmt
- −$450
- Net cashflow
- $822
Break-even live
UW: 25.0% down · 7.5% · 30yr · 1.5% tax · 5.0% vac · 8.0% maint · 8.0% mgmt
Financing live
Cash to close
- Down payment
- $37,250
- Closing costs
- $4,470
- Reserves months
- —
- Total cash needed
- —
Loan-product check · same deal, 3 products live
Conventional
25% down · 7.5% · 30yr
- Down + closing
- —
- Monthly P&I
- —
- Monthly cashflow
- —
- DSCR
- —
- Eligible?
- —
Personal DTI + credit; lowest rate.
DSCR
20% down · 8.5% · 30yr
- Down + closing
- —
- Monthly P&I
- —
- Monthly cashflow
- —
- DSCR
- —
- Eligible?
- —
No personal income docs; deal must DSCR.
Hard money
10% down · 12.0% · 12mo
- Down + closing
- —
- Monthly P&I
- —
- Monthly cashflow
- —
- DSCR
- —
- Eligible?
- —
Short-term bridge; refi at stabilization.
Listing history 38 events
-
2026-06-18days on market $149,000 Active 118 DOM
-
2026-06-17days on market $149,000 Active 117 DOM
-
2026-06-16days on market $149,000 Active 116 DOM
-
2026-06-15days on market $149,000 Active 115 DOM
-
2026-06-13days on market $149,000 Active 113 DOM
-
2026-06-12days on market $149,000 Active 112 DOM
-
2026-06-09days on market $149,000 Active 109 DOM
-
2026-06-08days on market $149,000 Active 108 DOM
-
2026-06-07days on market $149,000 Active 107 DOM
-
2026-06-07days on market $149,000 Active 106 DOM
-
2026-06-04days on market $149,000 Active 103 DOM
-
2026-06-02days on market $149,000 Active 102 DOM
-
2026-06-01days on market $149,000 Active 101 DOM
-
2026-05-31days on market $149,000 Active 100 DOM
-
2026-05-31days on market $149,000 Active 99 DOM
-
2026-02-21$149,000 Active 433-char remark
Show marketing remark (433 chars)
Live the lake life without sacrificing privacy! Situated just off Pratt Lake on a spacious one-acre lot, this ranch-style home features three bedrooms, one bath and easy main-floor living. The expansive yard provides plenty of room for outdoor entertaining, gardening, or adding a pole building for storage. Enjoy peaceful country views with convenient lake access just minutes away-the perfect setting for relaxation and recreation.
-
2025-08-08historical
-
2025-07-30price $124,900
-
2025-07-29price $124,900
-
2025-07-15price $128,000
-
2025-07-15price $128,000
-
2025-07-10$129,900 Active
-
2025-07-07price $129,900
-
2024-07-07historical
-
2024-07-07historical
-
2024-07-01price $109,000
-
2024-07-01price $109,000
-
2024-06-17$119,000 Active
-
2024-06-17$119,000 Active
-
2024-03-05historical
-
2024-02-27price $119,900
-
2024-02-12$132,000 Active
-
2017-08-28soldstatus $41,000
-
2017-04-03$47,750
-
2016-11-10historical
-
2016-03-16$48,500
-
2014-08-11soldstatus $42,650
-
2014-05-10$44,900
ⓘ Source: listings_history table (triggers on properties + properties_extension) + one-shot
backfill from property_details.listing_events for pre-trigger history.
Tax reassessment forecast MI · Partial reset (capped growth)
- Current annual tax
- $352 · $29/mo
- Projected year-2 tax
- $1,323 · $110/mo
- Expected delta
- +$971/yr (+$81/mo · 275.7%)
ⓘ Screening estimate from a state-policy table — verify with the county assessor before closing.
Climate risk First Street
- Flood 1/10 Low FEMA zone X (unshaded) · 0% chance over 30 yrs
- Wildfire 4/10 Moderate
- Heat 2/10 Low 7 d/yr ≥95°F today · 14 d/yr by 30 yrs out
- Wind 1/10 Low
- Air quality 2/10 Low 1 unhealthy d/yr today · 1 by 30 yrs out
Nearby sold comps map
Loading sold comps map…
Walkable amenities ~0.75 mi
Loading nearby amenities…
Taxation est. · year 1
- Rental income
- $25,742
- − Mortgage interest
- −$8,346
- − Property taxes
- −$352
- − Insurance
- −$745
- − Repairs & maintenance
- −$2,059
- − Management
- −$2,059
- − Depreciation
- −$4,335
- Taxable income
- $7,845
- Est. tax owed @ 24.0%
- −$1,883
- After-tax cash flow
- $7,979/yr
For passive investors: Depreciation is non-cash, so a rental often shows a tax loss while cash-flowing — sheltering income. Rental losses are passive: they offset passive income freely, and up to $25,000/yr can offset ordinary (W-2) income if you actively participate and your MAGI is under $100k (phasing out to $0 by $150k); unused losses carry forward. On sale, claimed depreciation is recaptured at up to 25%, and gains may owe capital-gains tax (a 1031 exchange can defer both). Figures are a year-1 estimate at your 24.0% rate — not tax advice; consult a CPA.
Schools (NCES district)
- District
- Gladwin Community Schools
- NCES district ID
- 2615990
- Math proficiency
- 28% ▼ -13.00%
- Reading proficiency
- 51% ▼ -2.00%
- Median HH income
- $38,917
- Composite
- 32.93/100
- National rank
- #5595
- State rank
- #232 of 540 in MI
Livability — Sage
No livability data for this city. (Only ~50 U.S. cities are tracked.)
Census & demographics
- Population (ZIP)
- 16,269
Population outlook (Gladwin County) Hauer SSP2
- Today (2025)
- 23,440 people
- By 2030
- 22,281 · -4.9%
- By 2040
- 19,867 · -15.2%
- By 2050
- 17,667 · -24.6%
- By 2075
- 12,909 · -44.9%
- By 2100
- 8,629 · -63.2%
Race, ethnicity, and origin ACS 2023
- Neighborhood character
- Predominantly White (94%)
- Race & ethnicity
- White 94% Two or more races 4% Hispanic / Latino 2%
- Common ancestry
- Romanian 8% Lithuanian 3% Iranian 3%
- Foreign-born
- 1%
- Languages at home
- 95% English-only · German/W. Germanic 4% Spanish 1%
Political lean MEDSL · Gladwin
- 2024 margin
- Solid R (+40.7) · D 29.1% · R 69.8% · Other 1.1%
- 2008→2024 swing
- -42.2pp toward R · 2008: 1.5pp · 2024: -40.7pp
- All cycles
- 2024: R+40.7 2020: R+36.8 2016: R+34.7 2012: R+7.2 2008: D+1.5
Not yet ingested
- Civics
- —
Market trends
- HPI YoY
- ▼ -72.67%
- Current HPI
- 238.0744
- Rent YoY
- —
- Metro
- —
- State GDP YoY
- ▲ 1.37%
- F500 in state
- 28
Industry mix (Fortune 500 HQ in MI)
| Industry | F500 HQs | Revenue |
|---|---|---|
| Automotive Parts | 3 | $48B |
|
||
| Automotive | 2 | $372B |
|
||
| Chemicals | 1 | $45B |
|
||
| Automotive Retail | 1 | $29B |
|
||
| Healthcare / Medical Devices | 1 | $23B |
|
||
| Automotive Technology | 1 | $20B |
|
||
Price history
+231.8% since first listed23 events — show timeline
- 2026-02-21 Listed $149,000 MiRealSource-MiMLS
- 2025-08-08 Listing Removed — MiRealSource-MiMLS
- 2025-07-30 Price Changed $124,900 MiRealSource-MiMLS
- 2025-07-29 Price Changed $124,900 WWMLS
- 2025-07-15 Price Changed $128,000 MiRealSource-MiMLS
- 2025-07-15 Price Changed $128,000 WWMLS
- 2025-07-10 Listed $129,900 MiRealSource-MiMLS
- 2025-07-07 Price Changed $129,900 WWMLS
- 2024-07-07 Listing Removed — MiRealSource-MiMLS
- 2024-07-07 Listing Removed — REALCOMP
- 2024-07-01 Price Changed $109,000 MiRealSource-MiMLS
- 2024-07-01 Price Changed $109,000 REALCOMP
- 2024-06-17 Listed $119,000 MiRealSource-MiMLS
- 2024-06-17 Listed $119,000 REALCOMP
- 2024-03-05 Listing Removed — MiRealSource-MiMLS
- 2024-02-27 Price Changed $119,900 MiRealSource-MiMLS
- 2024-02-12 Listed $132,000 MiRealSource-MiMLS
- 2017-08-28 Sold (Public Records) $41,000 Public Records
- 2017-04-03 Listed $47,750 MiRealSource-MiMLS
- 2016-11-10 Listing Removed — MiRealSource-MiMLS
- 2016-03-16 Listed $48,500 MiRealSource-MiMLS
- 2014-08-11 Sold (Public Records) $42,650 Public Records
- 2014-05-10 Listed $44,900 MiRealSource-MiMLS
Property tax history
-8.7%/yrLatest (2025): $352 · -63.4% YoY. Source: county tax records.
Cash-flow waterfall
monthlySold comps — $/sqft
last 12 mo · ≤1 miLoading sold comps…